Houses for sale & to rent in Remenham, Wargrave And Ruscombe, Henley-on-thames
House Prices in Remenham, Wargrave And Ruscombe
Properties in Remenham, Wargrave And Ruscombe have an average house price of £1,557,820.00 and had 25 Property Transactions within the last 3 years¹.
Remenham, Wargrave And Ruscombe is an area in Henley-on-thames, Wokingham with 239 households², where the most expensive property was sold for £6,500,000.00.
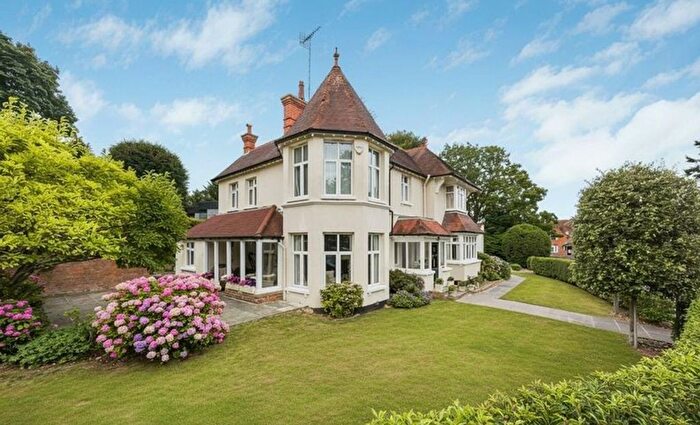
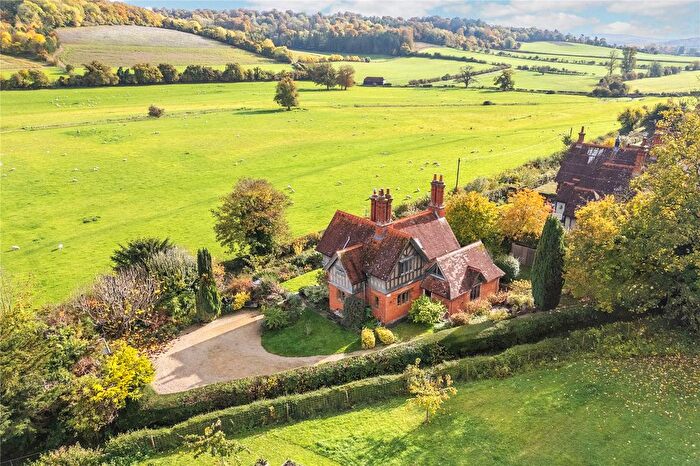
Properties for sale in Remenham, Wargrave And Ruscombe
Roads and Postcodes in Remenham, Wargrave And Ruscombe
Navigate through our locations to find the location of your next house in Remenham, Wargrave And Ruscombe, Henley-on-thames for sale or to rent.
| Streets | Postcodes |
|---|---|
| Aston Lane | RG9 3EJ RG9 3EL |
| Church Lane | RG9 3EX RG9 3EY |
| Ferry Lane | RG9 3DH |
| Henley Bridge | RG9 2LN RG9 2LW RG9 2LY |
| Matson Drive | RG9 3HB RG9 3HD RG9 3HE |
| Middle Culham | RG9 3DY |
| Remenham Hill | RG9 3EE RG9 3EG RG9 3EH RG9 3EP RG9 3EU RG9 3EW RG9 3HA RG9 3HJ RG9 3ER RG9 3ES RG9 3ET RG9 3HF RG9 3HG RG9 3HH RG9 3HN RG9 3HP RG9 3HW RG9 3JE |
| Remenham Lane | RG9 2LR RG9 3DB RG9 3DD RG9 2LS RG9 3DA |
| Remenham Row | RG9 2LQ |
| Remenham Terrace | RG9 3EN |
| Rosehill Woods | RG9 3EA |
| Upper Culham Lane | RG9 3BQ |
| Wargrave Road | RG9 2LT RG9 2LU RG9 2LX RG9 3HU RG9 3HX RG9 3HY RG9 3JD RG9 3HT |
| RG9 3DE RG9 3DS RG9 3HR RG9 2LP RG9 3AZ RG9 3DG RG9 3DJ RG9 3DL RG9 3DN RG9 3DP |
Transport near Remenham, Wargrave And Ruscombe
- FAQ
- Price Paid By Year
- Property Type Price
Frequently asked questions about Remenham, Wargrave And Ruscombe
What is the average price for a property for sale in Remenham, Wargrave And Ruscombe?
The average price for a property for sale in Remenham, Wargrave And Ruscombe is £1,557,820. There are 1,187 property listings for sale in Remenham, Wargrave And Ruscombe.
What streets have the most expensive properties for sale in Remenham, Wargrave And Ruscombe?
The streets with the most expensive properties for sale in Remenham, Wargrave And Ruscombe are Remenham Hill at an average of £2,405,583 and Henley Bridge at an average of £2,076,250.
What streets have the most affordable properties for sale in Remenham, Wargrave And Ruscombe?
The streets with the most affordable properties for sale in Remenham, Wargrave And Ruscombe are Remenham Row at an average of £835,000 and Wargrave Road at an average of £1,249,666.
Which train stations are available in or near Remenham, Wargrave And Ruscombe?
Some of the train stations available in or near Remenham, Wargrave And Ruscombe are Henley-On-Thames, Shiplake and Wargrave.
Property Price Paid in Remenham, Wargrave And Ruscombe by Year
The average sold property price by year was:
| Year | Average Sold Price | Price Change |
Sold Properties
|
|---|---|---|---|
| 2025 | £1,331,000 | 3% |
5 Properties |
| 2024 | £1,294,166 | -18% |
6 Properties |
| 2023 | £1,523,928 | -30% |
7 Properties |
| 2022 | £1,979,714 | 56% |
7 Properties |
| 2021 | £867,441 | 21% |
17 Properties |
| 2020 | £687,491 | -42% |
6 Properties |
| 2019 | £975,357 | -22% |
7 Properties |
| 2018 | £1,194,700 | 65% |
10 Properties |
| 2017 | £413,650 | -65% |
10 Properties |
| 2016 | £681,111 | 4% |
9 Properties |
| 2015 | £655,412 | -3% |
12 Properties |
| 2014 | £674,216 | 30% |
15 Properties |
| 2013 | £469,545 | -69% |
11 Properties |
| 2012 | £794,581 | 46% |
7 Properties |
| 2011 | £431,625 | -40% |
12 Properties |
| 2010 | £605,100 | 13% |
5 Properties |
| 2009 | £524,928 | -22% |
7 Properties |
| 2008 | £640,000 | 4% |
7 Properties |
| 2007 | £614,000 | 40% |
10 Properties |
| 2006 | £367,704 | -7% |
11 Properties |
| 2005 | £394,413 | -12% |
11 Properties |
| 2004 | £442,333 | 20% |
6 Properties |
| 2003 | £351,750 | -18% |
10 Properties |
| 2002 | £416,406 | 16% |
16 Properties |
| 2001 | £347,958 | 7% |
12 Properties |
| 2000 | £323,250 | 37% |
22 Properties |
| 1999 | £203,236 | 27% |
19 Properties |
| 1998 | £148,642 | -0,1% |
7 Properties |
| 1997 | £148,750 | -73% |
4 Properties |
| 1996 | £257,428 | 26% |
7 Properties |
| 1995 | £191,215 | - |
8 Properties |
Property Price per Property Type in Remenham, Wargrave And Ruscombe
Here you can find historic sold price data in order to help with your property search.
The average Property Paid Price for specific property types in the last three years are:
| Property Type | Average Sold Price | Sold Properties |
|---|---|---|
| Semi Detached House | £634,500.00 | 3 Semi Detached Houses |
| Detached House | £3,011,875.00 | 8 Detached Houses |
| Terraced House | £708,000.00 | 5 Terraced Houses |
| Flat | £1,045,222.00 | 9 Flats |

