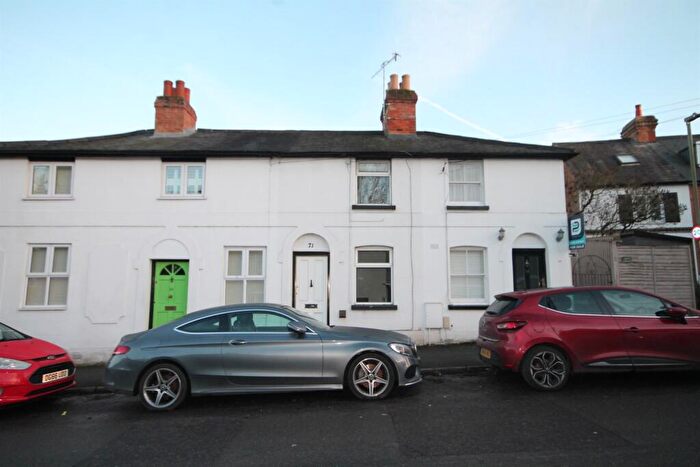
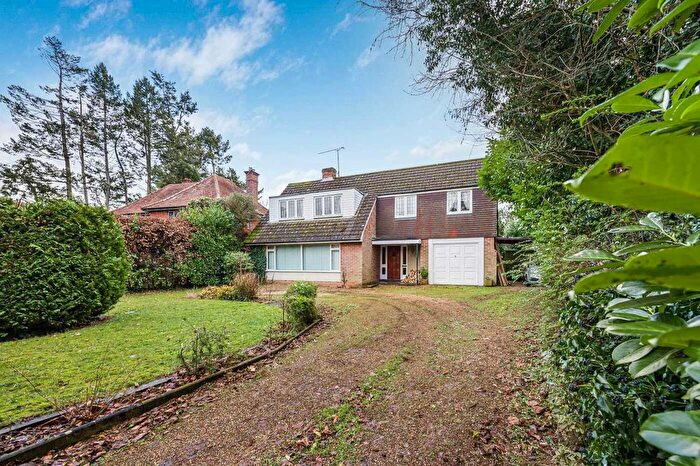
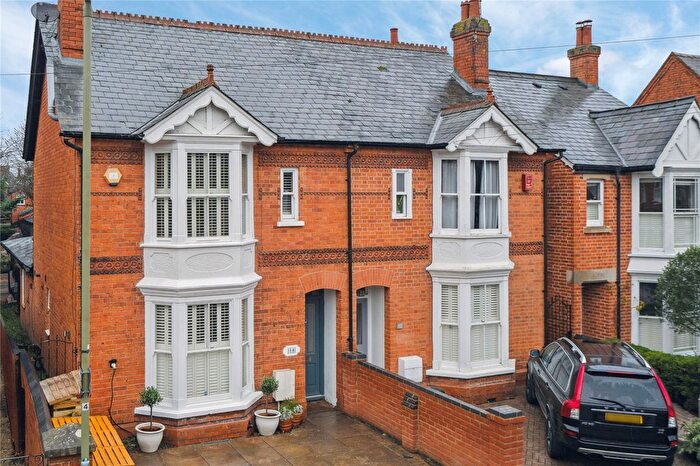
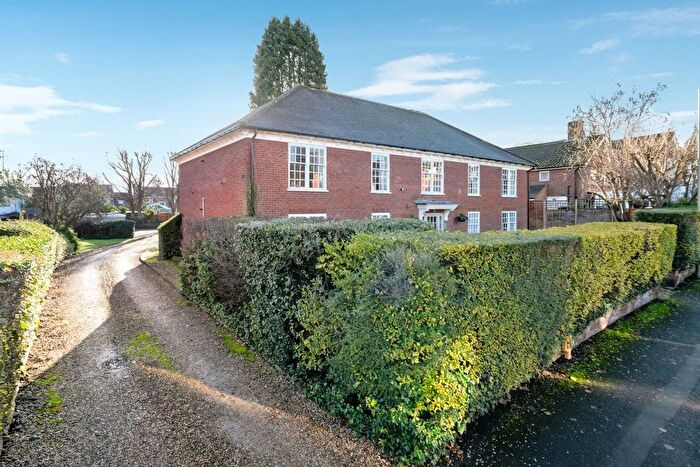
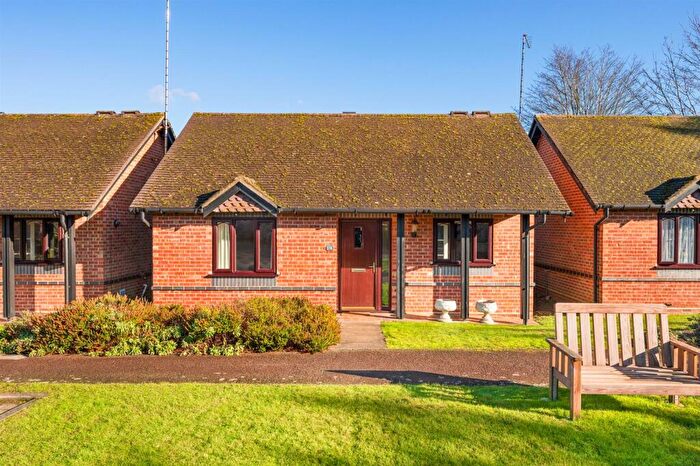
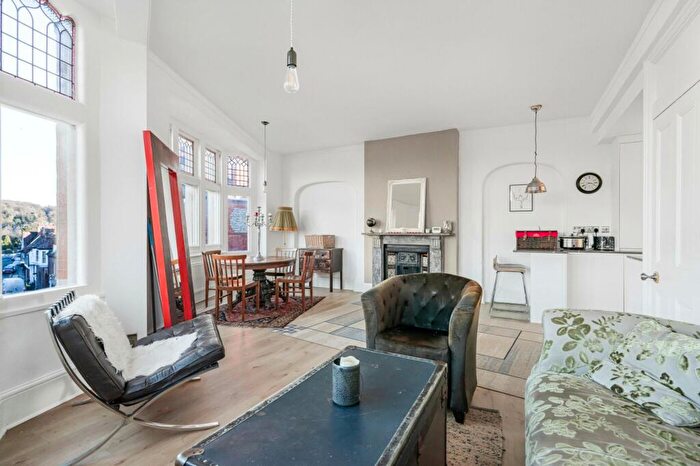
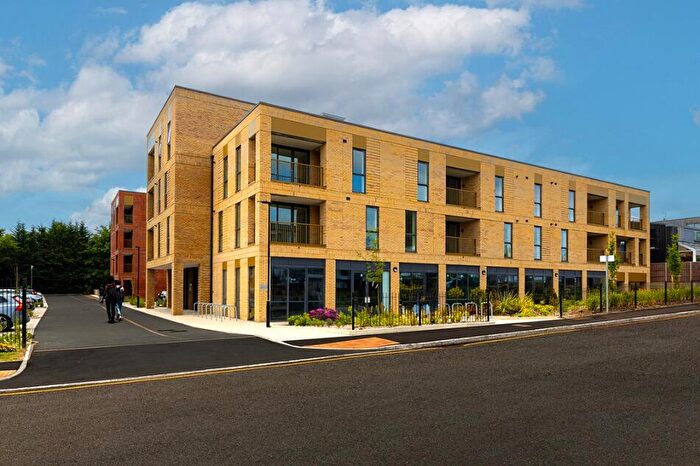
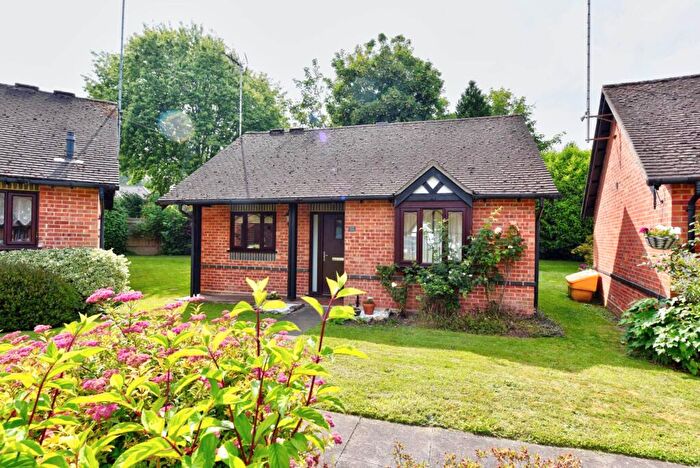
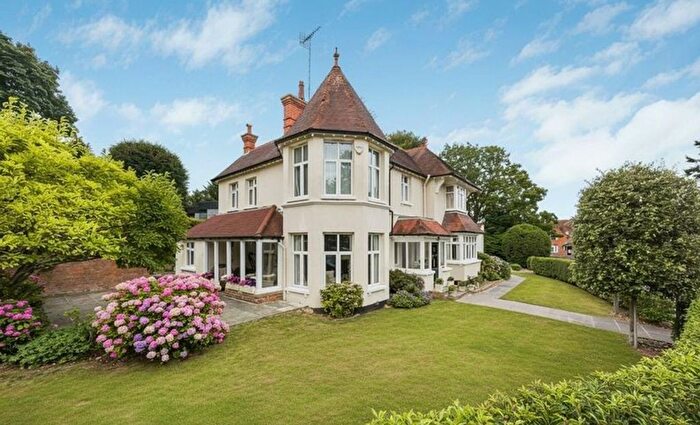
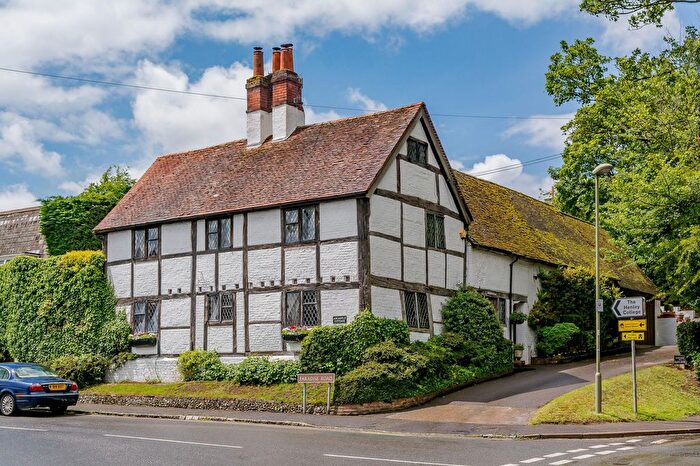
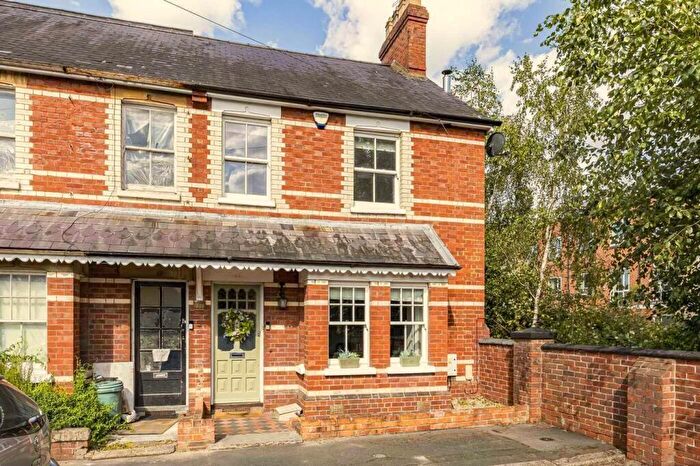
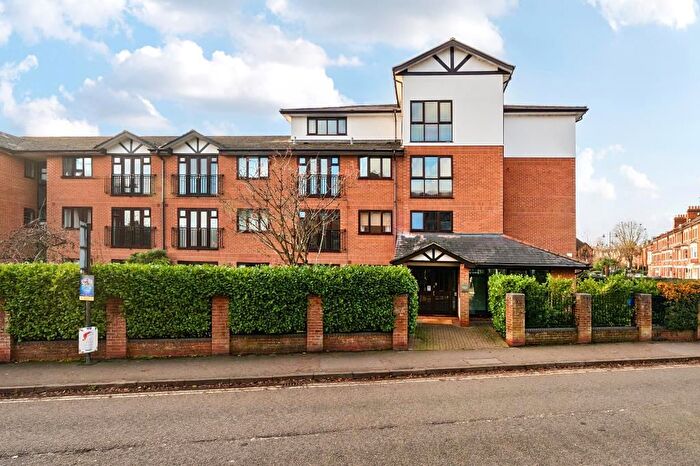
Houses for sale & to rent in Henley South, Henley-on-thames
House Prices in Henley South
Properties in Henley South have an average house price of £782,777.00 and had 396 Property Transactions within the last 3 years¹.
Henley South is an area in Henley-on-thames, Oxfordshire with 2,518 households², where the most expensive property was sold for £4,075,000.00.
Properties for sale in Henley South
Roads and Postcodes in Henley South
Navigate through our locations to find the location of your next house in Henley South, Henley-on-thames for sale or to rent.
| Streets | Postcodes |
|---|---|
| Albert Road | RG9 1SD |
| Auton Place | RG9 1LG |
| Belle Vue Road | RG9 1JG RG9 1JQ |
| Berkshire Road | RG9 1NA RG9 1NB RG9 1ND |
| Blandy Road | RG9 1PH RG9 1QB |
| Boathouse Reach | RG9 1TJ |
| Boston Road | RG9 1DY |
| Britannia Place | RG9 1FB |
| Carlesgill Place | RG9 1NY |
| Centenary Business Park | RG9 1DS |
| Charlotte Mews | RG9 1FY |
| Church Street | RG9 1SE |
| Coldharbour Close | RG9 1QF |
| Cromwell Road | RG9 1JH |
| Damer Gardens | RG9 1HX |
| Fairview Trading Estate | RG9 1HE |
| Farm Road | RG9 1EJ |
| Friday Street | RG9 1AH |
| Gillotts Close | RG9 1PY |
| Goodall Close | RG9 1BJ |
| Grange Road | RG9 1DE |
| Green Lane | RG9 1LR RG9 1LS |
| Greys Hill | RG9 1SJ RG9 1SL RG9 1SW |
| Greys Road | RG9 1QN RG9 1QS RG9 1QT RG9 1SB RG9 1SP RG9 1TD RG9 1TE |
| Grove Road | RG9 1DH |
| Hamilton Avenue | RG9 1SH |
| Harpsden Road | RG9 1ED RG9 1EE RG9 1EF RG9 1EG |
| Harpsden Way | RG9 1NL RG9 1NS RG9 1NT RG9 1NX |
| Henley Gate | RG9 4BB |
| Hofmann Mews | RG9 1DF |
| Imperial Court | RG9 1NP |
| Lime Court | RG9 1BN |
| Lovell Close | RG9 1PX |
| Makins Road | RG9 1PP RG9 1PR RG9 1PU RG9 1QA |
| Manor Road | RG9 1LT RG9 1LU RG9 1LX |
| Marmion Road | RG9 1DG |
| Meadow Road | RG9 1BD RG9 1BE |
| Mill Lane | RG9 4HB RG9 4HD |
| Newtown Gardens | RG9 1EH |
| Niagara Road | RG9 1EB |
| Noble Road | RG9 1NU |
| Norman Avenue | RG9 1ER RG9 1SG |
| Normanstead | RG9 1XR |
| Orchard Close | RG9 1HR |
| Park Road | RG9 1DB RG9 1DD |
| Peppard Lane | RG9 1LY RG9 1NF RG9 1NG RG9 1NJ RG9 1NQ |
| Putman Place | RG9 1BZ |
| Quebec Road | RG9 1EY RG9 1FH |
| Queen Close | RG9 1BP |
| Queen Street | RG9 1AP RG9 1AR |
| Reading Road | RG9 1AB RG9 1AG RG9 1AU RG9 1AX RG9 1BX RG9 1DJ RG9 1DL RG9 1DN RG9 1DP RG9 1DR RG9 1EA RG9 1EL RG9 1ES |
| River Terrace | RG9 1BG |
| Rotherfield Road | RG9 1NN RG9 1NR |
| Singers Close | RG9 1HD |
| Singers Lane | RG9 1HB |
| South Avenue | RG9 1JR |
| St Andrews Road | RG9 1HP RG9 1HS RG9 1HY RG9 1HZ RG9 1JA RG9 1JB RG9 1JD RG9 1JE RG9 1PG RG9 1PL RG9 1PN RG9 1PZ |
| St Katherines Road | RG9 1PJ |
| St Marks Road | RG9 1LJ RG9 1LN RG9 1LP RG9 1LW RG9 1PD |
| Station Road | RG9 1AF RG9 1AT RG9 1AY RG9 1BB RG9 1BS |
| Thameside | RG9 1BQ |
| The Close | RG9 1SR |
| Thorne Close | RG9 1RZ |
| Upton Close | RG9 1BT RG9 1BU |
| Vicarage Road | RG9 1HF RG9 1HJ RG9 1HN RG9 1HT RG9 1HU RG9 1HW RG9 1JT RG9 1JU |
| Victoria Court | RG9 1XG |
| Walton Avenue | RG9 1LA |
| War Memorial Place | RG9 1EP |
| Watermans Road | RG9 1EX |
| Western Avenue | RG9 1JP |
| Western Road | RG9 1JL RG9 1JN |
| Wilson Avenue | RG9 1ET RG9 1EU |
| Wootton Road | RG9 1QD RG9 1QE |
| Wyndale Close | RG9 1BA |
Transport near Henley South
- FAQ
- Price Paid By Year
- Property Type Price
Frequently asked questions about Henley South
What is the average price for a property for sale in Henley South?
The average price for a property for sale in Henley South is £782,777. This amount is 9% lower than the average price in Henley-on-thames. There are 1,364 property listings for sale in Henley South.
What streets have the most expensive properties for sale in Henley South?
The streets with the most expensive properties for sale in Henley South are Normanstead at an average of £2,527,000, Rotherfield Road at an average of £2,346,505 and Peppard Lane at an average of £1,758,333.
What streets have the most affordable properties for sale in Henley South?
The streets with the most affordable properties for sale in Henley South are Quebec Road at an average of £249,500, War Memorial Place at an average of £257,733 and Imperial Court at an average of £274,250.
Which train stations are available in or near Henley South?
Some of the train stations available in or near Henley South are Henley-On-Thames, Shiplake and Wargrave.
Property Price Paid in Henley South by Year
The average sold property price by year was:
| Year | Average Sold Price | Price Change |
Sold Properties
|
|---|---|---|---|
| 2025 | £810,908 | 8% |
65 Properties |
| 2024 | £745,141 | -18% |
113 Properties |
| 2023 | £877,109 | 15% |
83 Properties |
| 2022 | £742,740 | -6% |
135 Properties |
| 2021 | £788,456 | 14% |
184 Properties |
| 2020 | £677,479 | -11% |
118 Properties |
| 2019 | £752,676 | 3% |
106 Properties |
| 2018 | £731,922 | 4% |
126 Properties |
| 2017 | £704,285 | 7% |
119 Properties |
| 2016 | £654,040 | 13% |
117 Properties |
| 2015 | £570,583 | 1% |
133 Properties |
| 2014 | £566,038 | 13% |
142 Properties |
| 2013 | £490,193 | 3% |
143 Properties |
| 2012 | £475,120 | 3% |
128 Properties |
| 2011 | £458,500 | -3% |
137 Properties |
| 2010 | £473,019 | 10% |
170 Properties |
| 2009 | £426,589 | -9% |
106 Properties |
| 2008 | £466,186 | 1% |
92 Properties |
| 2007 | £459,431 | 6% |
174 Properties |
| 2006 | £430,007 | 14% |
189 Properties |
| 2005 | £371,341 | -5% |
137 Properties |
| 2004 | £388,255 | 17% |
170 Properties |
| 2003 | £322,691 | 9% |
183 Properties |
| 2002 | £295,203 | -6% |
149 Properties |
| 2001 | £312,017 | 17% |
189 Properties |
| 2000 | £259,548 | 30% |
159 Properties |
| 1999 | £182,368 | 0,1% |
186 Properties |
| 1998 | £182,187 | 20% |
149 Properties |
| 1997 | £146,023 | 13% |
199 Properties |
| 1996 | £126,851 | -2% |
157 Properties |
| 1995 | £129,853 | - |
142 Properties |
Property Price per Property Type in Henley South
Here you can find historic sold price data in order to help with your property search.
The average Property Paid Price for specific property types in the last three years are:
| Property Type | Average Sold Price | Sold Properties |
|---|---|---|
| Semi Detached House | £829,036.00 | 68 Semi Detached Houses |
| Detached House | £1,333,510.00 | 97 Detached Houses |
| Terraced House | £618,351.00 | 146 Terraced Houses |
| Flat | £399,713.00 | 85 Flats |

