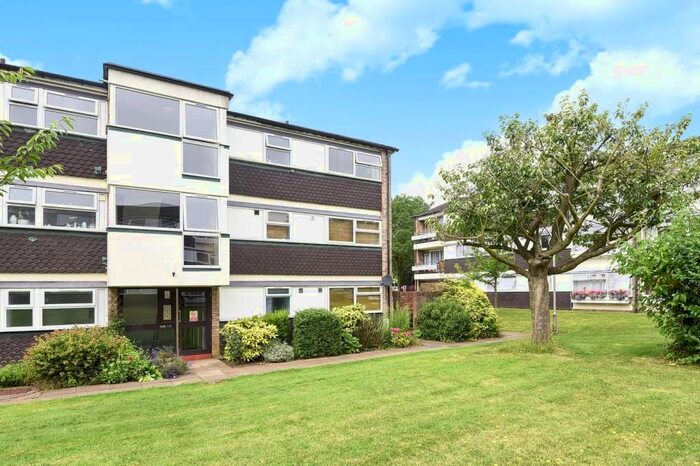
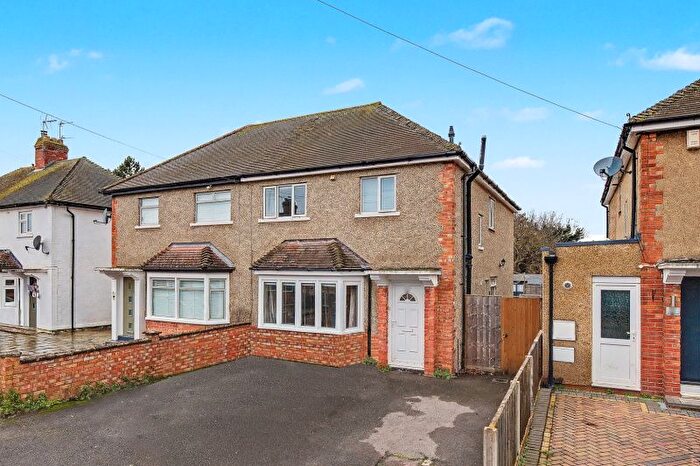
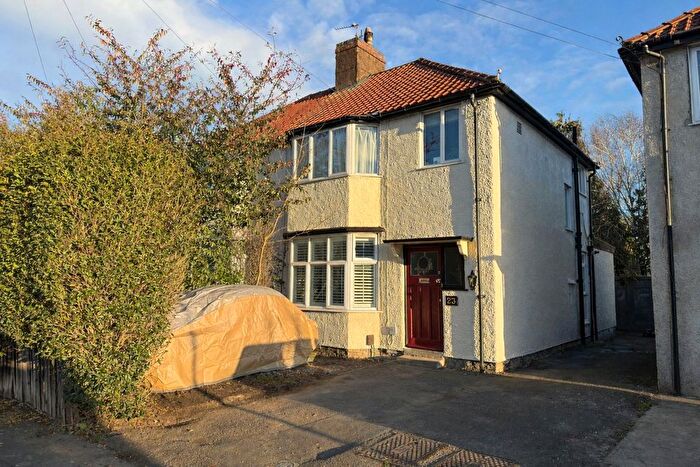
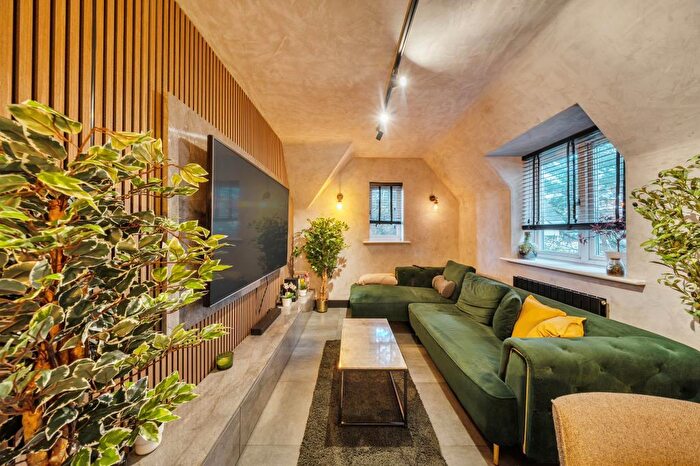
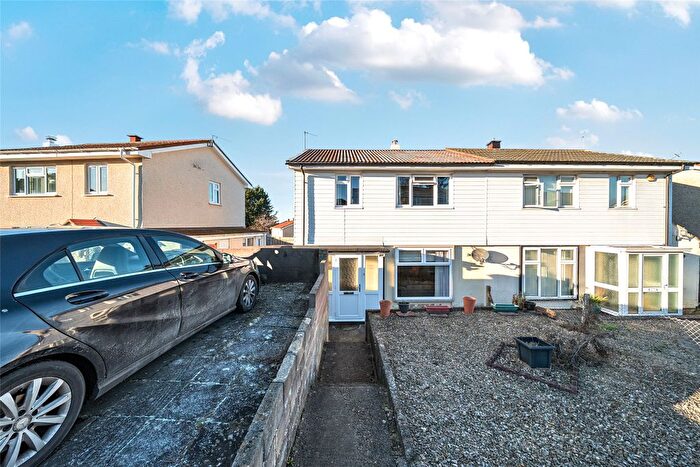
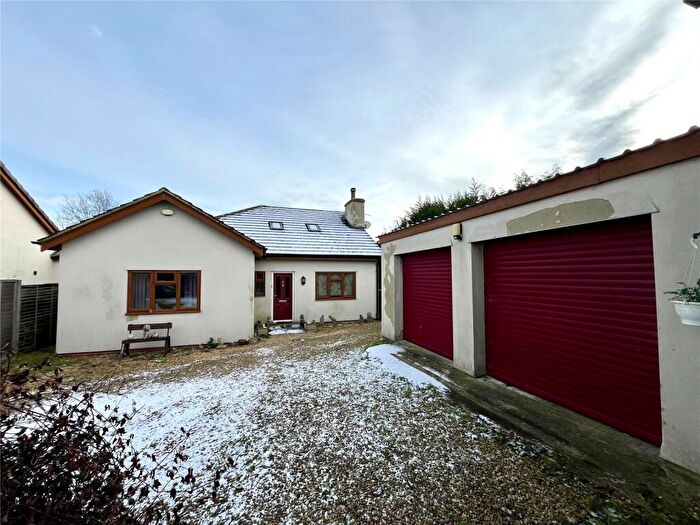
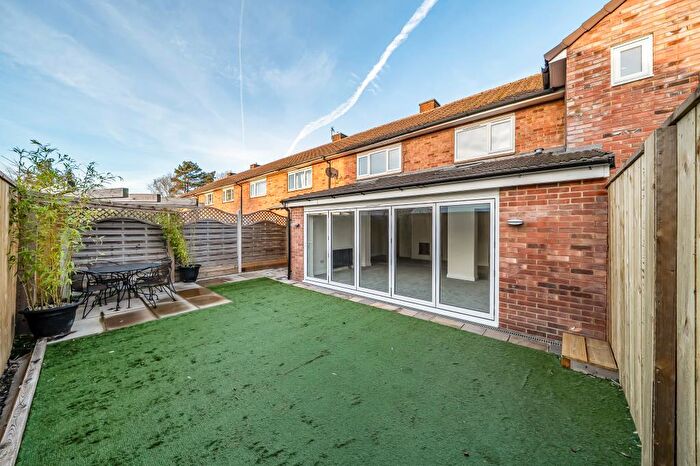
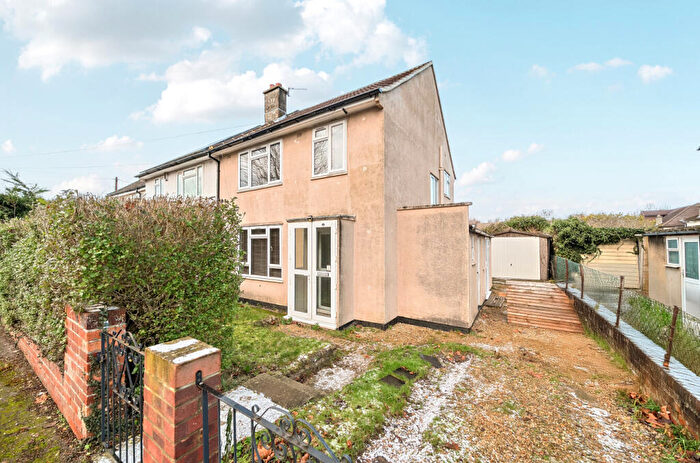
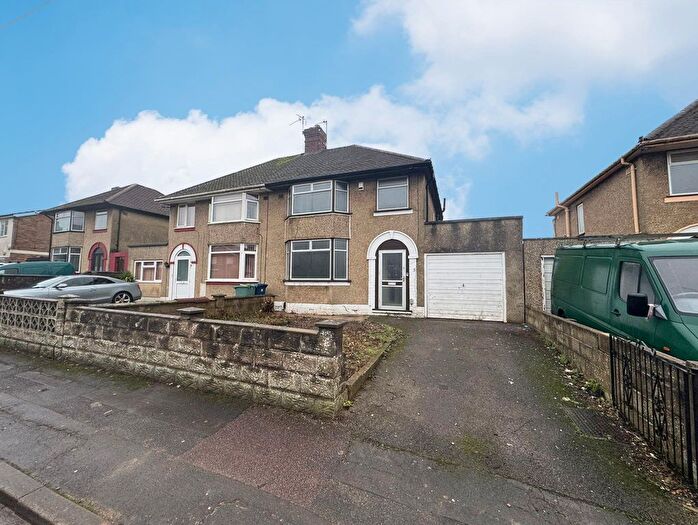
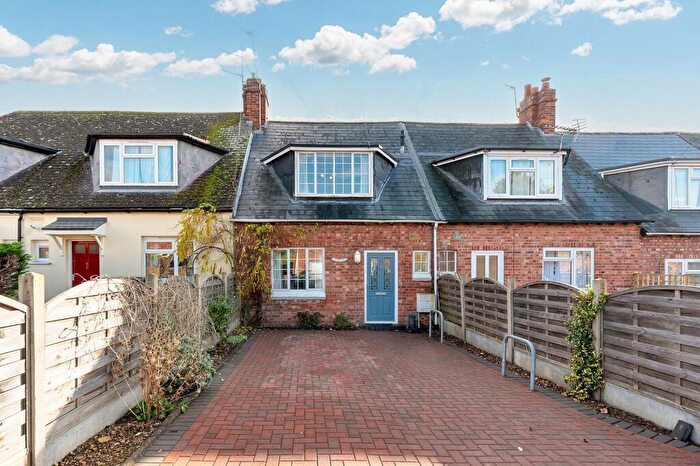
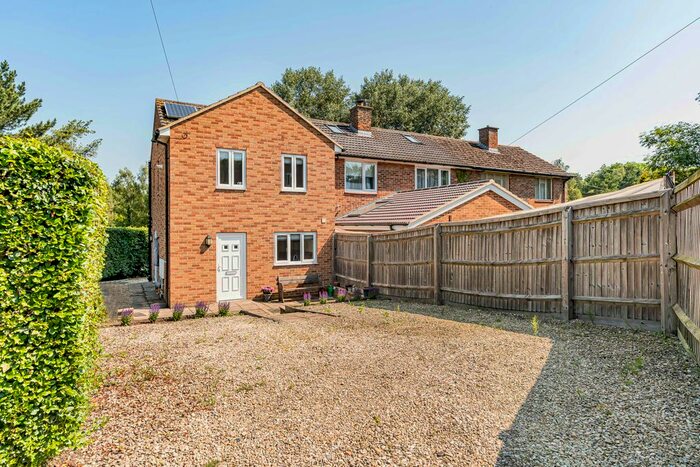
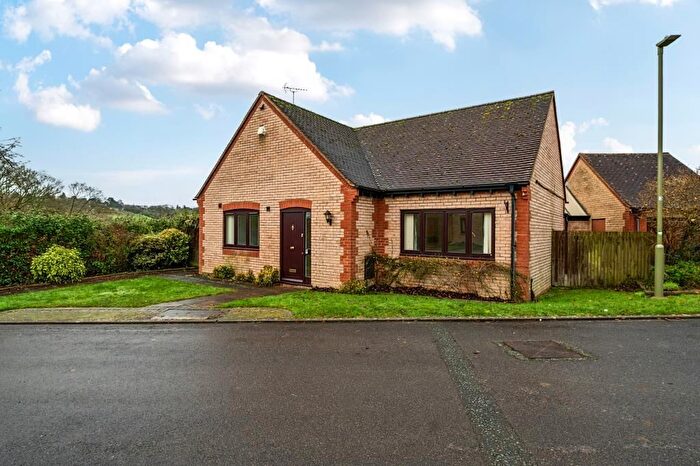
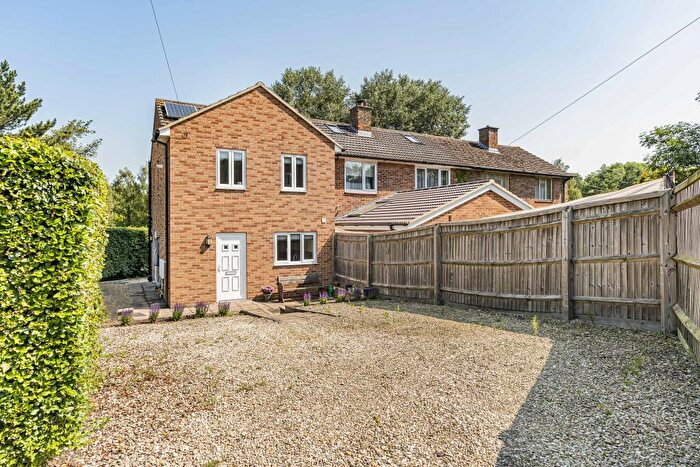
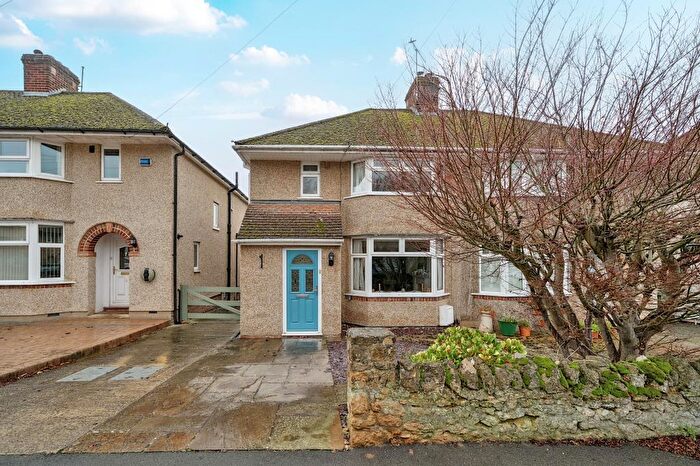
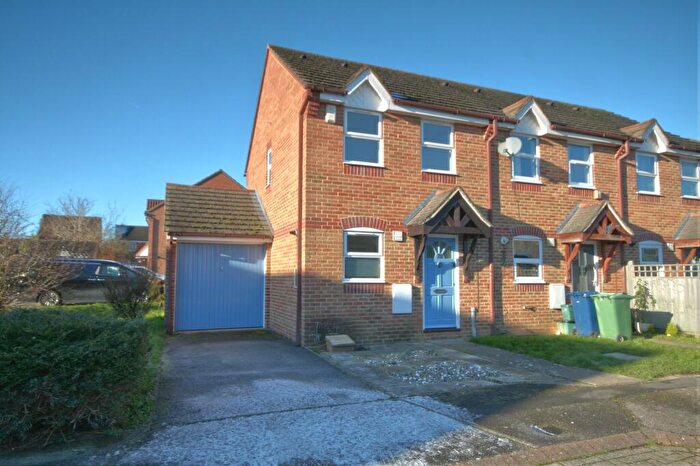
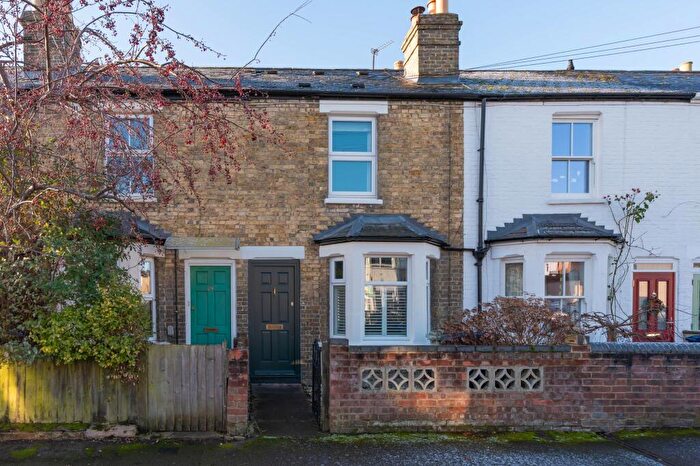
Houses for sale & to rent in Forest Hill And Holton, Oxford
House Prices in Forest Hill And Holton
Properties in Forest Hill And Holton have an average house price of £672,112.00 and had 90 Property Transactions within the last 3 years¹.
Forest Hill And Holton is an area in Oxford, Oxfordshire with 948 households², where the most expensive property was sold for £2,680,000.00.
Properties for sale in Forest Hill And Holton
Roads and Postcodes in Forest Hill And Holton
Navigate through our locations to find the location of your next house in Forest Hill And Holton, Oxford for sale or to rent.
| Streets | Postcodes |
|---|---|
| Badgers Close | OX33 1HP |
| Barns Close | OX33 1QB |
| Barton Village Road | OX3 9SE |
| Bayswater Farm Road | OX3 8BX OX3 8BY |
| Bayswater Mill Road | OX3 9SB |
| Bayswater Road | OX3 9RZ OX3 9SL |
| Beckley Court | OX3 9UB |
| Biscoe Court | OX33 1YX |
| Bungalow Close | OX3 9XA |
| Bury Hook Corner | OX33 1PT |
| Church Close | OX33 1DN |
| Church Hill | OX33 1EG |
| Church Street | OX3 9UT |
| Common Road | OX3 9UR |
| Courtfield Road | OX33 1HA |
| Cox Lane | OX33 1HW |
| Cromwell Place | OX33 1FN |
| Fairfax Gate | OX33 1QE |
| High Street | OX3 9UU |
| Hill Top Cottage | OX3 9SW |
| Horton Road | OX33 1AG |
| Lodge Farm Cottage | OX3 9SR |
| Main Street | OX33 1DY OX33 1DZ OX33 1EA OX33 1EB OX33 1EF |
| Mickle Way | OX33 1DU OX33 1DX |
| Middle Road | OX33 1EX OX33 1HD |
| Mill Lane | OX3 0QD |
| Mill Street | OX33 1HN OX33 1HQ |
| Milton Crescent | OX33 1EJ |
| New Inn Road | OX3 9SS OX3 9SU OX3 9TZ |
| Nourse Close | OX3 9TJ |
| Old Road | OX3 8TA |
| Otmoor Lane | OX3 9TB OX3 9UX |
| Post Box Cottages | OX3 9UJ |
| Pound Lane | OX33 1HF OX33 1HG |
| Powell Close | OX33 1EN |
| Roman Way | OX3 9UA |
| Shotover Kilns | OX3 8ST |
| Silver Birches | OX33 1HH |
| Simms Close | OX33 1HB |
| Stanton Cottages | OX33 1EY |
| Stanton Road | OX33 1DT |
| The Green | OX3 9TL |
| The Ridings | OX3 8TB |
| Tyndale Place | OX33 1YY |
| Waterperry Road | OX33 1PP OX33 1PW |
| Wheatley Road | OX33 1EH OX33 1ES OX33 1ET OX33 1EW |
| Woodperry Hill | OX33 1AL |
| Woodperry Road | OX3 9UY OX3 9UZ |
| OX3 9SP OX3 9TH OX3 9TN OX3 9TP OX3 9UH OX3 9UL OX3 9UN OX3 9US OX3 9UW OX33 1AH OX33 1AQ OX33 1HE OX33 1HS OX33 1PR OX33 1PS OX33 1PU OX33 1PX OX33 1PY OX33 1PZ OX33 1QF OX33 1QL |
Transport near Forest Hill And Holton
- FAQ
- Price Paid By Year
- Property Type Price
Frequently asked questions about Forest Hill And Holton
What is the average price for a property for sale in Forest Hill And Holton?
The average price for a property for sale in Forest Hill And Holton is £672,112. This amount is 17% higher than the average price in Oxford. There are 6,424 property listings for sale in Forest Hill And Holton.
What streets have the most expensive properties for sale in Forest Hill And Holton?
The streets with the most expensive properties for sale in Forest Hill And Holton are Middle Road at an average of £1,430,000, Bayswater Road at an average of £1,067,500 and Otmoor Lane at an average of £1,030,000.
What streets have the most affordable properties for sale in Forest Hill And Holton?
The streets with the most affordable properties for sale in Forest Hill And Holton are Badgers Close at an average of £194,166, Biscoe Court at an average of £215,833 and Tyndale Place at an average of £347,500.
Which train stations are available in or near Forest Hill And Holton?
Some of the train stations available in or near Forest Hill And Holton are Islip, Oxford and Oxford Parkway.
Property Price Paid in Forest Hill And Holton by Year
The average sold property price by year was:
| Year | Average Sold Price | Price Change |
Sold Properties
|
|---|---|---|---|
| 2025 | £562,884 | -17% |
13 Properties |
| 2024 | £657,588 | 4% |
32 Properties |
| 2023 | £633,176 | -21% |
17 Properties |
| 2022 | £763,062 | 9% |
28 Properties |
| 2021 | £694,031 | 8% |
46 Properties |
| 2020 | £639,000 | 2% |
24 Properties |
| 2019 | £623,333 | 15% |
25 Properties |
| 2018 | £526,877 | -3% |
27 Properties |
| 2017 | £544,935 | 8% |
36 Properties |
| 2016 | £502,588 | -8% |
20 Properties |
| 2015 | £545,137 | 9% |
30 Properties |
| 2014 | £495,784 | 6% |
30 Properties |
| 2013 | £465,916 | 2% |
18 Properties |
| 2012 | £457,449 | 2% |
18 Properties |
| 2011 | £448,256 | 7% |
26 Properties |
| 2010 | £418,224 | 2% |
29 Properties |
| 2009 | £410,677 | -36% |
17 Properties |
| 2008 | £560,318 | 15% |
19 Properties |
| 2007 | £478,773 | 27% |
40 Properties |
| 2006 | £348,576 | 3% |
42 Properties |
| 2005 | £336,984 | -10% |
30 Properties |
| 2004 | £372,214 | 8% |
41 Properties |
| 2003 | £341,747 | 13% |
32 Properties |
| 2002 | £296,213 | 8% |
40 Properties |
| 2001 | £273,024 | 22% |
36 Properties |
| 2000 | £213,857 | 26% |
37 Properties |
| 1999 | £158,851 | 4% |
39 Properties |
| 1998 | £152,623 | 6% |
32 Properties |
| 1997 | £143,824 | 13% |
51 Properties |
| 1996 | £125,745 | 18% |
31 Properties |
| 1995 | £102,783 | - |
84 Properties |
Property Price per Property Type in Forest Hill And Holton
Here you can find historic sold price data in order to help with your property search.
The average Property Paid Price for specific property types in the last three years are:
| Property Type | Average Sold Price | Sold Properties |
|---|---|---|
| Semi Detached House | £483,327.00 | 29 Semi Detached Houses |
| Detached House | £886,213.00 | 46 Detached Houses |
| Terraced House | £481,775.00 | 10 Terraced Houses |
| Flat | £178,000.00 | 5 Flats |

