
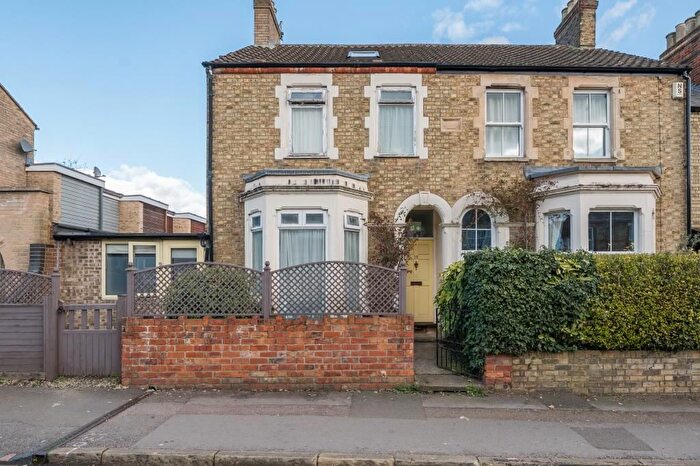
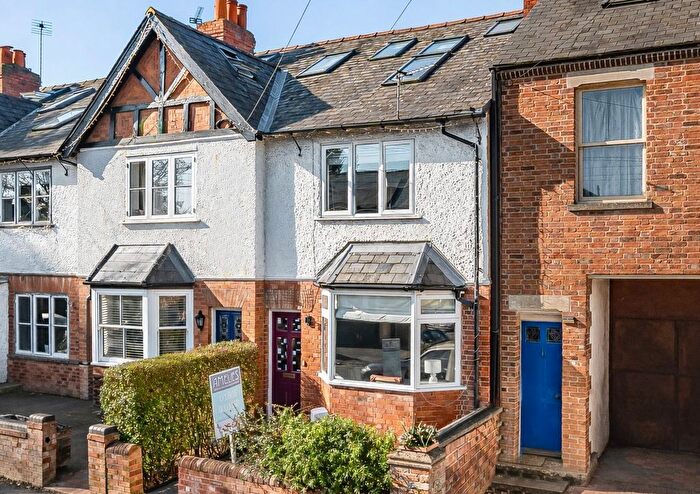
Houses for sale & to rent in Headington, Oxford
House Prices in Headington
Properties in Headington have an average house price of £602k and had 176 Property Transactions within the last 3 years¹.
Headington is an area in Oxford, Oxfordshire with 2,313 households², where the most expensive property was sold for £2.02M.
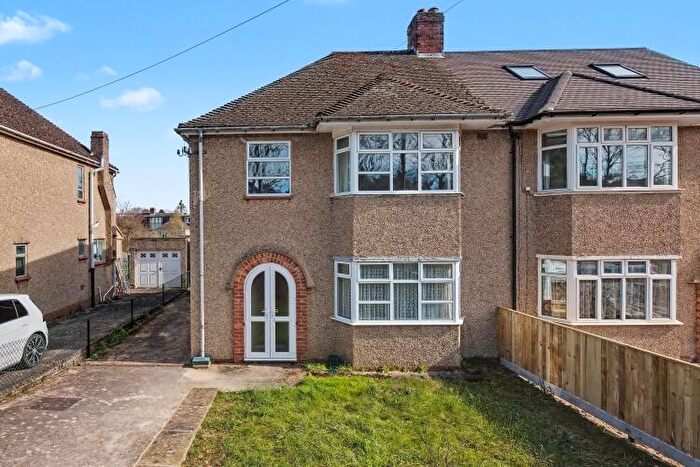
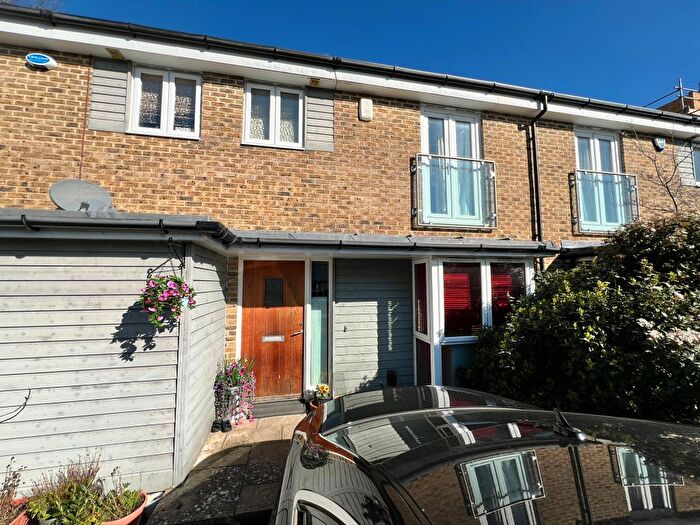
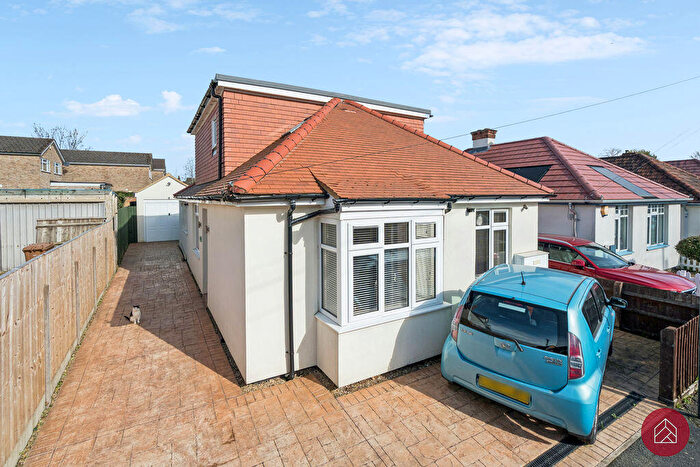
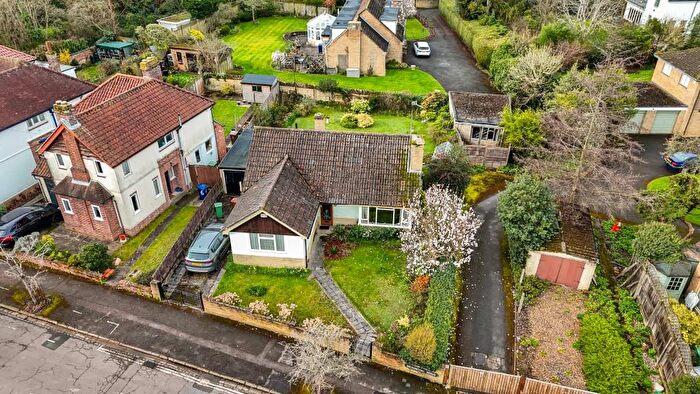
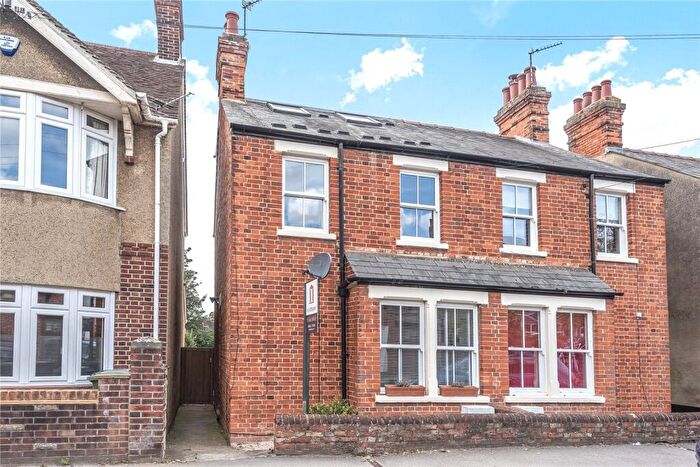
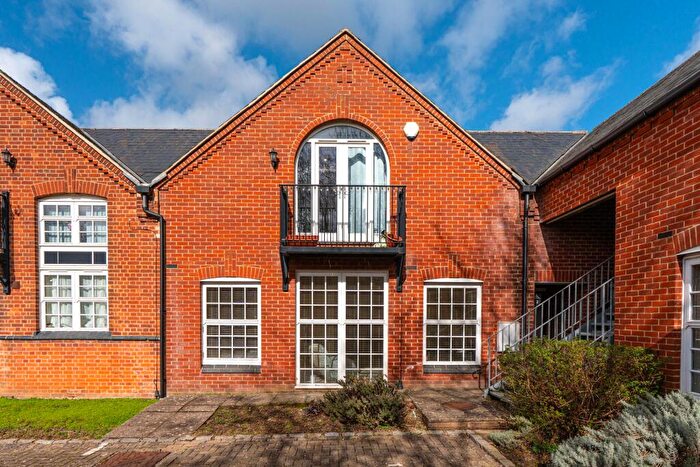
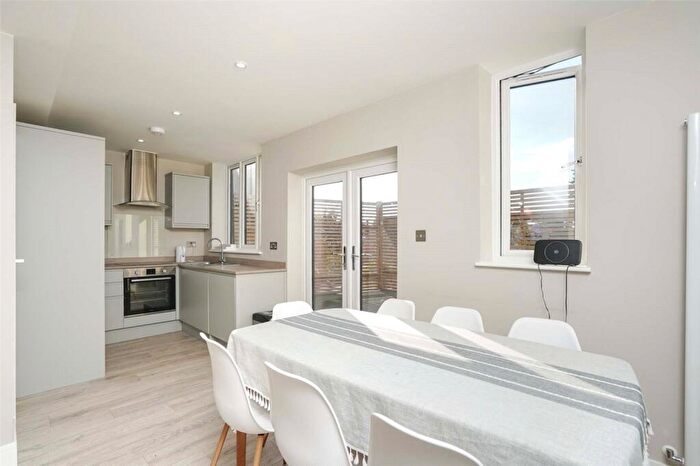
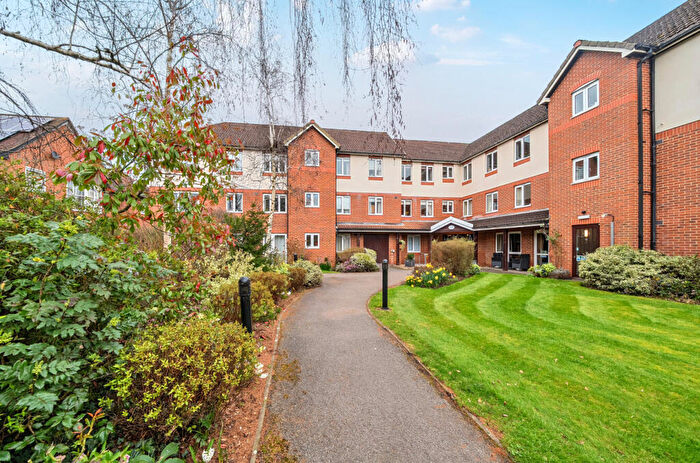
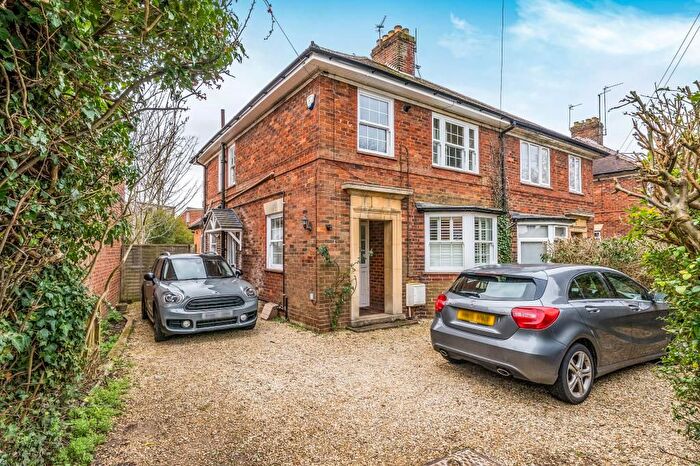
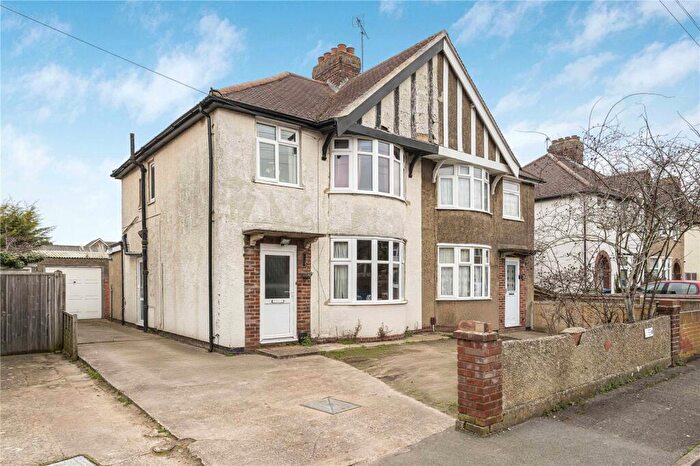
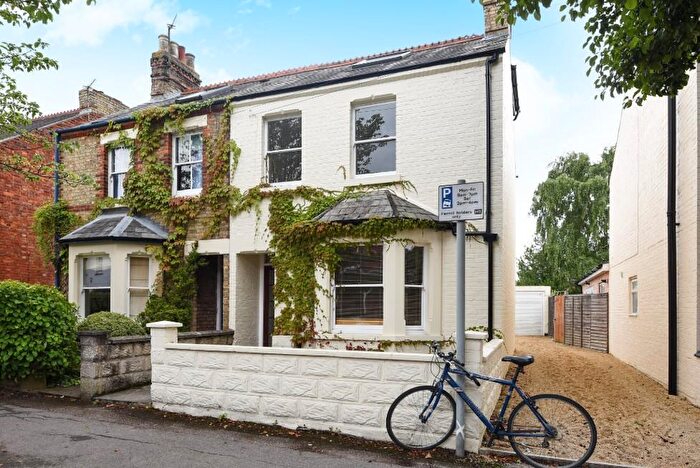
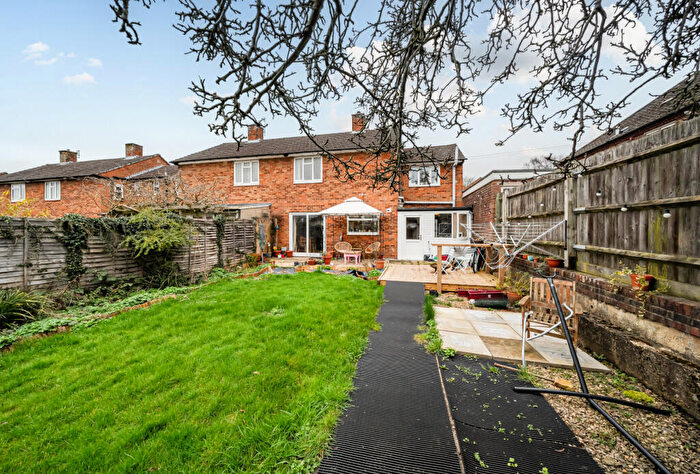
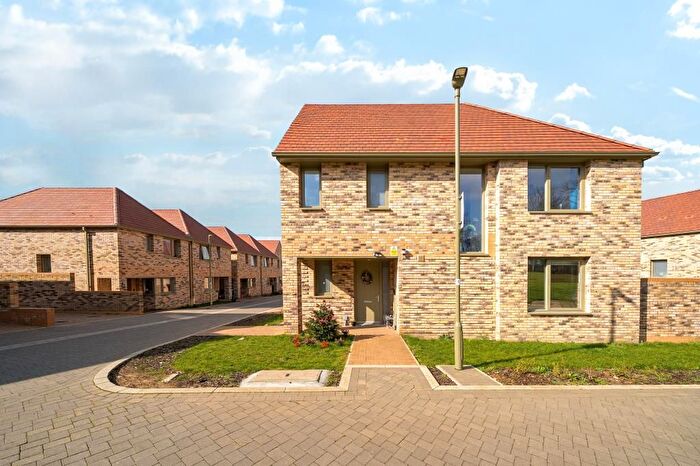
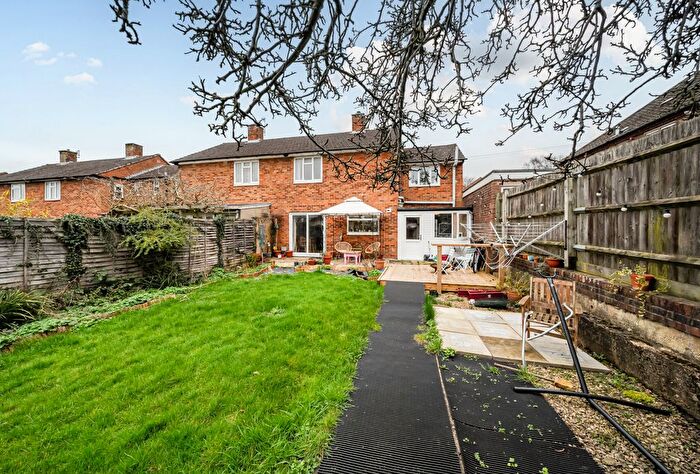
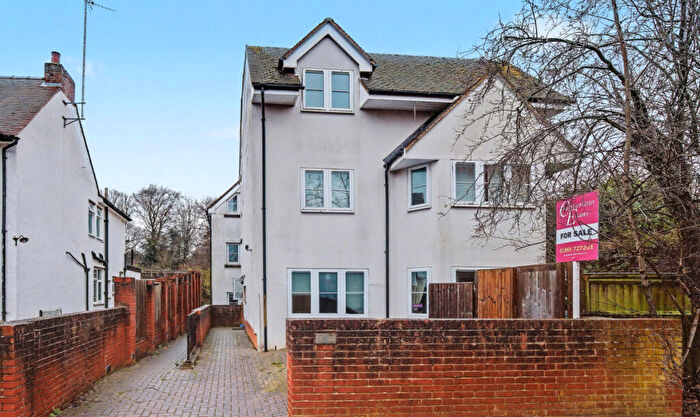
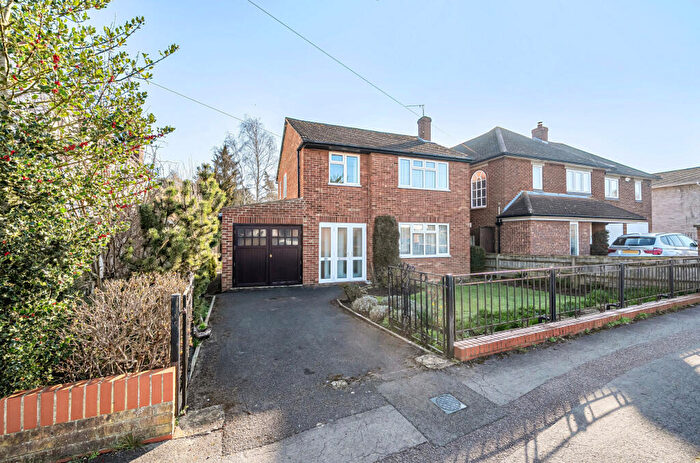
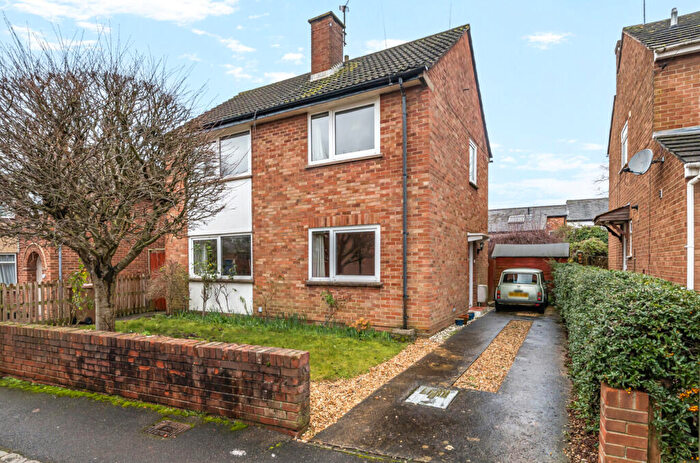
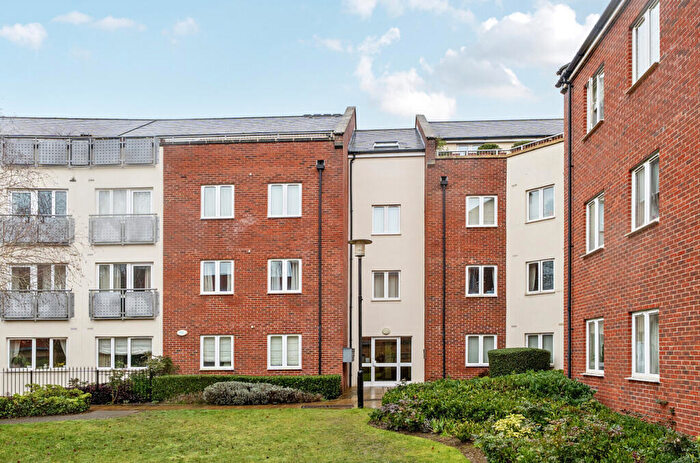
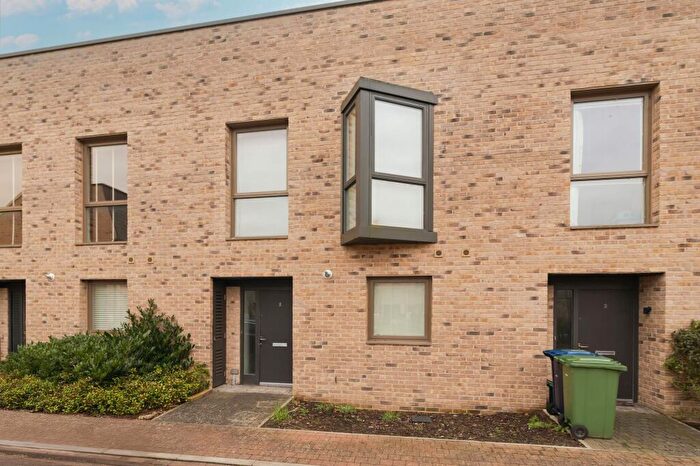
Properties for sale in Headington
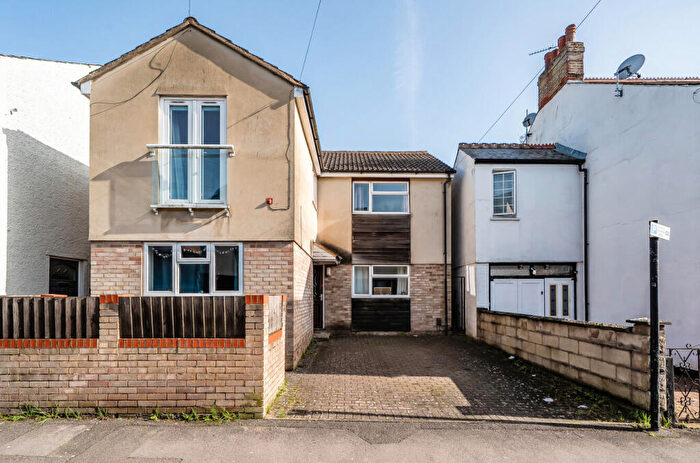
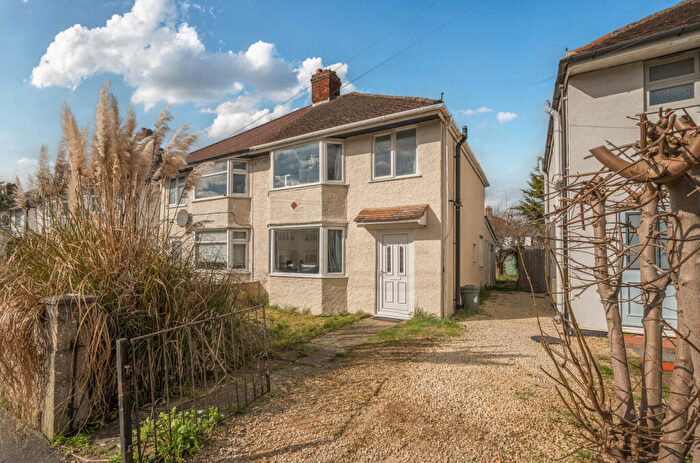
![]()
If you are looking to sell your house, let it out, or receive a property valuation, an expert can help you.
Click the button below to get started.

Roads and Postcodes in Headington
Navigate through our locations to find the location of your next house in Headington, Oxford for sale or to rent.
Transport near Headington

- FAQ
- Price Paid By Year
- Property Type Price
Frequently asked questions about Headington
What is the average price for a property for sale in Headington?
The average price for a property for sale in Headington is £602,373. This amount is 5% higher than the average price in Oxford. There are 1,236 property listings for sale in Headington.
What streets have the most expensive properties for sale in Headington?
The streets with the most expensive properties for sale in Headington are Brookside at an average of £1,504,500, St Andrews Road at an average of £1,360,000 and Barton Lane at an average of £1,200,000.
What streets have the most affordable properties for sale in Headington?
The streets with the most affordable properties for sale in Headington are Blackburn Close at an average of £125,375, Latimer Grange at an average of £260,833 and Nursery Close at an average of £289,200.
Which train stations are available in or near Headington?
Some of the train stations available in or near Headington are Oxford, Oxford Parkway and Islip.
Property Price Paid in Headington by Year
The average sold property price by year was:
| Year | Average Sold Price | Price Change |
Sold Properties
|
|---|---|---|---|
| 2025 | £534,946 | -15% |
62 Properties |
| 2024 | £613,199 | -8% |
54 Properties |
| 2023 | £662,305 | 7% |
60 Properties |
| 2022 | £617,648 | 10% |
88 Properties |
| 2021 | £556,991 | -11% |
99 Properties |
| 2020 | £619,242 | 4% |
48 Properties |
| 2019 | £594,711 | 9% |
62 Properties |
| 2018 | £543,830 | -4% |
59 Properties |
| 2017 | £565,486 | 7% |
57 Properties |
| 2016 | £526,250 | -1% |
84 Properties |
| 2015 | £533,804 | 13% |
101 Properties |
| 2014 | £464,641 | 17% |
110 Properties |
| 2013 | £387,704 | 4% |
116 Properties |
| 2012 | £373,809 | -4% |
96 Properties |
| 2011 | £390,582 | 9% |
66 Properties |
| 2010 | £353,969 | 1% |
89 Properties |
| 2009 | £349,783 | 0,3% |
86 Properties |
| 2008 | £348,567 | 8% |
72 Properties |
| 2007 | £321,846 | -0,1% |
146 Properties |
| 2006 | £322,015 | 12% |
135 Properties |
| 2005 | £282,993 | 1% |
125 Properties |
| 2004 | £279,214 | 5% |
153 Properties |
| 2003 | £265,297 | 14% |
108 Properties |
| 2002 | £227,411 | 16% |
112 Properties |
| 2001 | £190,289 | -3% |
111 Properties |
| 2000 | £196,220 | 23% |
92 Properties |
| 1999 | £152,063 | 8% |
115 Properties |
| 1998 | £140,092 | 5% |
114 Properties |
| 1997 | £133,367 | 19% |
90 Properties |
| 1996 | £108,215 | 1% |
134 Properties |
| 1995 | £107,475 | - |
91 Properties |
Property Price per Property Type in Headington
Here you can find historic sold price data in order to help with your property search.
The average Property Paid Price for specific property types in the last three years are:
| Property Type | Average Sold Price | Sold Properties |
|---|---|---|
| Semi Detached House | £684,352.00 | 57 Semi Detached Houses |
| Detached House | £1,029,588.00 | 34 Detached Houses |
| Terraced House | £465,256.00 | 25 Terraced Houses |
| Flat | £339,537.00 | 60 Flats |