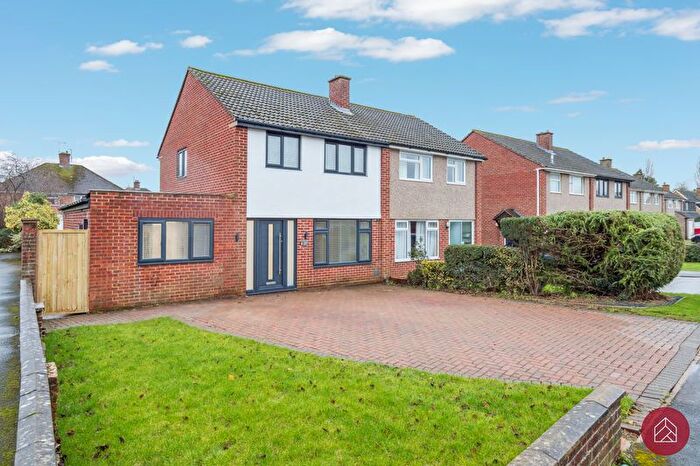
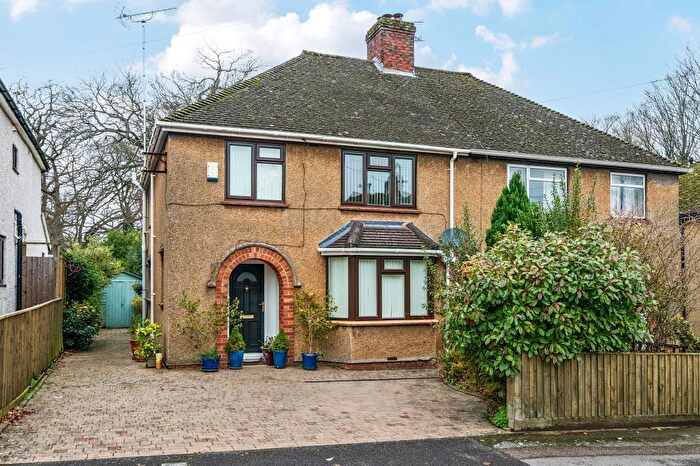
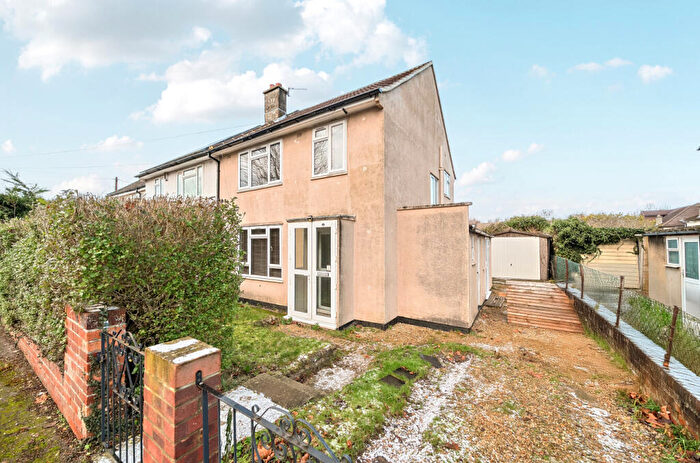
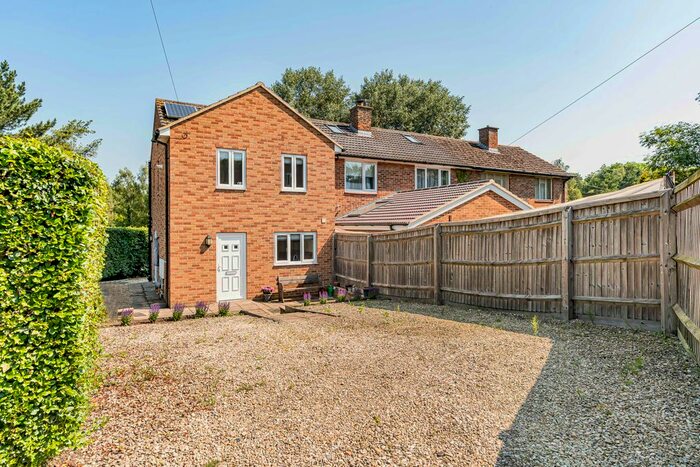
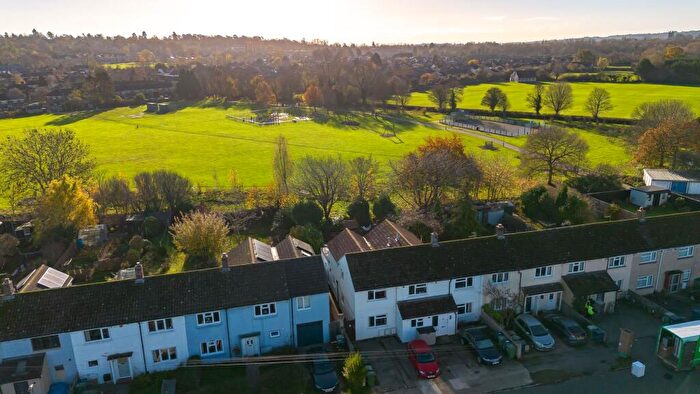
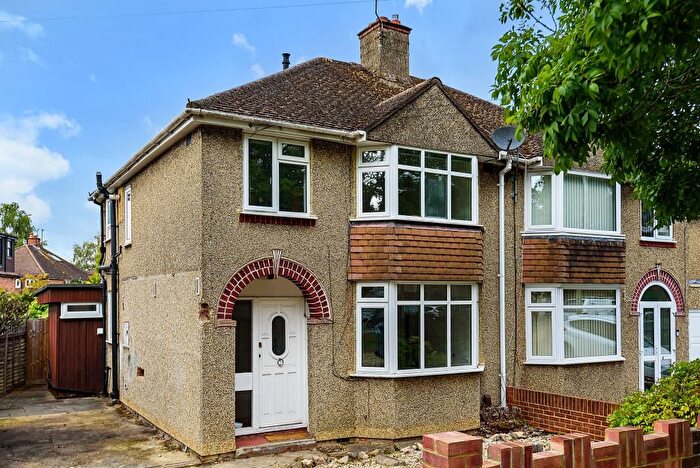
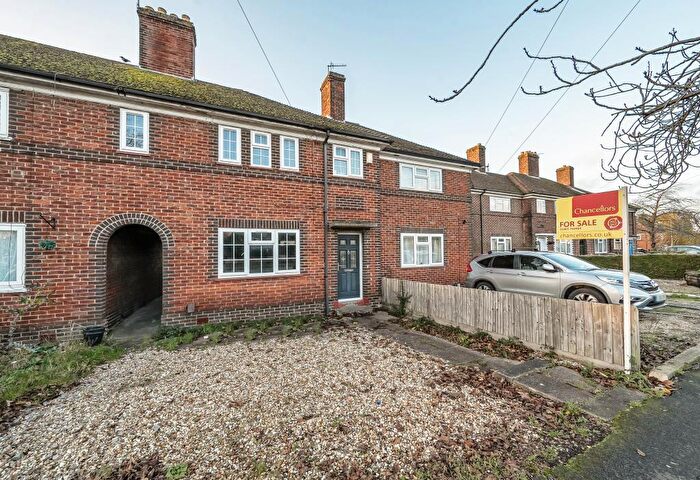
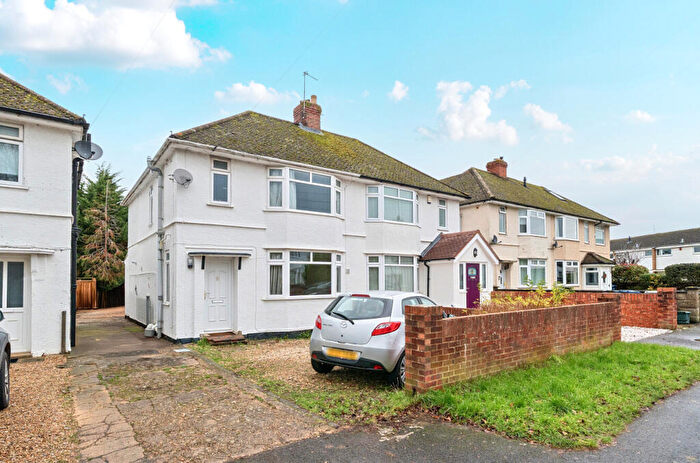
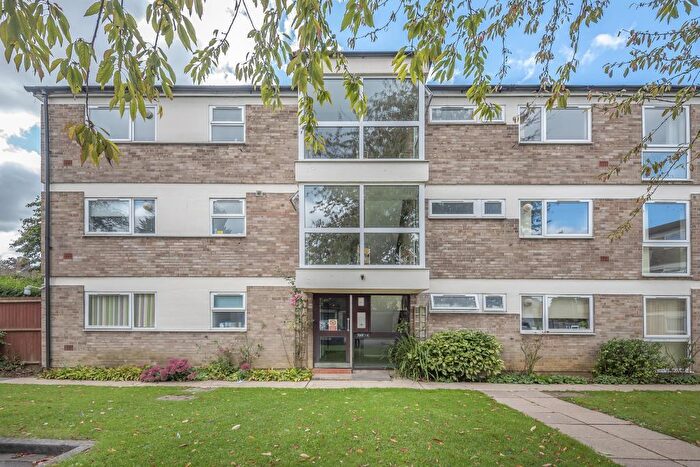
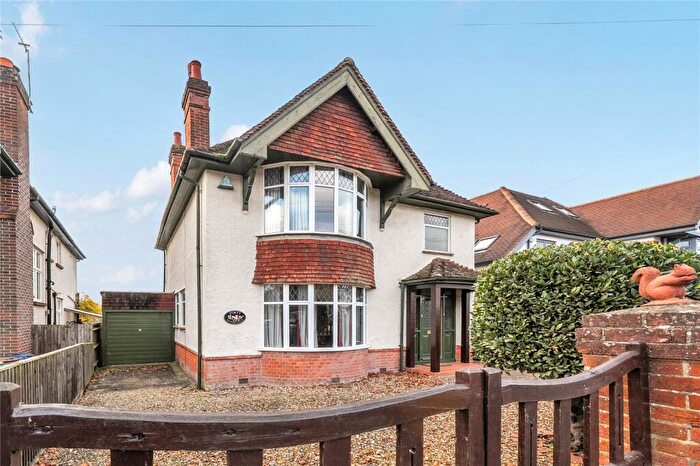
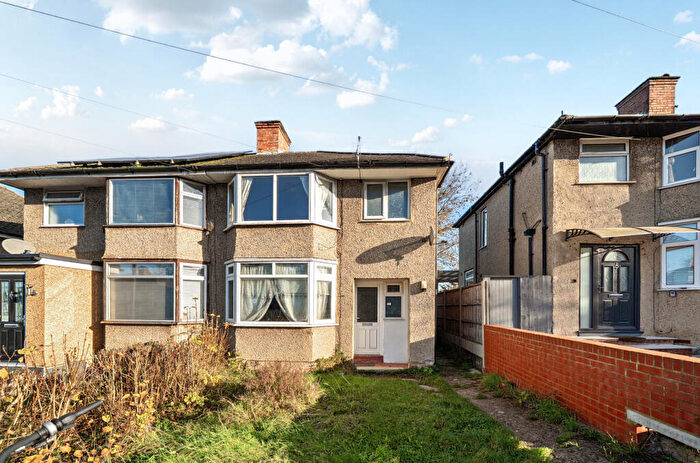
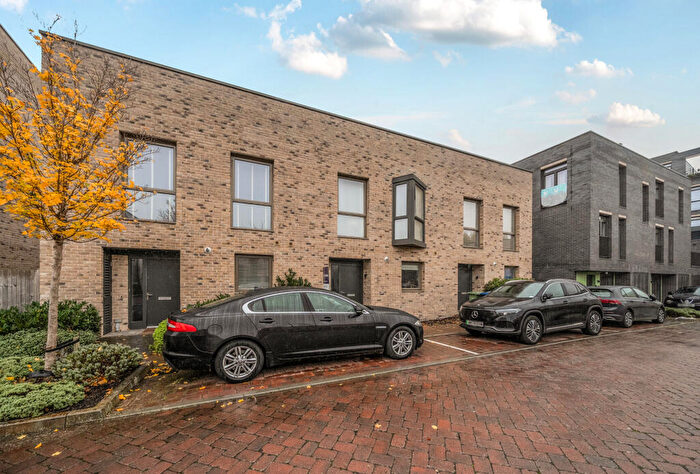
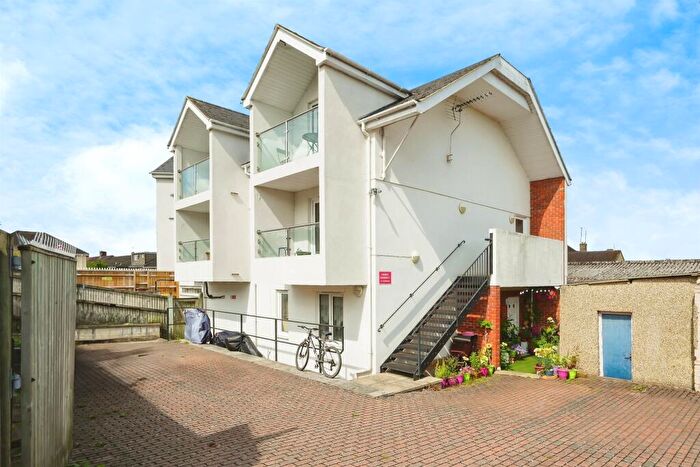
Houses for sale & to rent in Headington Hill And Northway, Oxford
House Prices in Headington Hill And Northway
Properties in Headington Hill And Northway have an average house price of £588,849.00 and had 165 Property Transactions within the last 3 years¹.
Headington Hill And Northway is an area in Oxford, Oxfordshire with 1,709 households², where the most expensive property was sold for £5,200,000.00.
Properties for sale in Headington Hill And Northway
Roads and Postcodes in Headington Hill And Northway
Navigate through our locations to find the location of your next house in Headington Hill And Northway, Oxford for sale or to rent.
| Streets | Postcodes |
|---|---|
| Alesworth Grove | OX3 9RD |
| Ambleside Drive | OX3 0AG OX3 0AH OX3 0AQ |
| Borrowmead Road | OX3 9QP OX3 9QW |
| Bowness Avenue | OX3 0AJ OX3 0AL |
| Broadhead Place | OX3 9RE |
| Brookfield Crescent | OX3 0AZ |
| Cherwell Drive | OX3 0LY |
| Cholesbury Grange | OX3 7TE |
| Colterne Close | OX3 0BA |
| Coniston Avenue | OX3 0AN OX3 0AW |
| Copse Lane | OX3 0AT OX3 0AU OX3 0AX OX3 0AY |
| Crotch Crescent | OX3 0JJ OX3 0JL OX3 0JN |
| Derwent Avenue | OX3 0AP OX3 0AR OX3 0AS |
| Doris Field Close | OX3 0DP |
| Eden Drive | OX3 0AB OX3 0AD OX3 0AE |
| Feilden Grove | OX3 0DU |
| Foxwell Drive | OX3 9QA OX3 9QB OX3 9QD OX3 9QE OX3 9QF |
| Gorse Leas | OX3 9DJ |
| Gouldland Gardens | OX3 9DQ |
| Grunsell Close | OX3 9QQ |
| Hadow Road | OX3 0JW |
| Halliday Hill | OX3 9PT OX3 9PU OX3 9PY OX3 9PZ |
| Harberton Mead | OX3 0DB |
| Hastoe Grange | OX3 7TF |
| Headington Road | OX3 0EB OX3 0ED |
| Headley Way | OX3 0LP OX3 0LR OX3 0LS OX3 0LT OX3 0LU OX3 0LX OX3 7SR OX3 7SY |
| Highbank Close | OX3 0AF |
| Holmes Park | OX3 0FG |
| Ingle Close | OX3 9DB |
| Jack Straws Lane | OX3 0DL OX3 0DN OX3 0DW |
| John Buchan Road | OX3 9QN |
| Lynn Close | OX3 0JH |
| Maltfield Road | OX3 9RG |
| Marston Road | OX3 0JA OX3 0JB OX3 0JD OX3 0JE |
| Mary Price Close | OX3 0LN OX3 0PE |
| Mccabe Place | OX3 0LQ |
| Meaden Hill | OX3 9QJ OX3 9QL |
| Milne Place | OX3 9DG |
| Pullens Field | OX3 0BU |
| Pullens Lane | OX3 0BX OX3 0BZ |
| Rolfe Place | OX3 0DS |
| Saxon Way | OX3 9DD OX3 9DE |
| Snowdon Mede | OX3 7TQ |
| Stainfield Road | OX3 9DH |
| Steep Rise | OX3 9QG |
| Stockleys Road | OX3 9RH |
| Sutton Road | OX3 9RB OX3 9RL |
| Upway Road | OX3 9QH |
| Westlands Drive | OX3 9QR OX3 9QS OX3 9QX OX3 9QY OX3 9QZ OX3 9RA |
Transport near Headington Hill And Northway
- FAQ
- Price Paid By Year
- Property Type Price
Frequently asked questions about Headington Hill And Northway
What is the average price for a property for sale in Headington Hill And Northway?
The average price for a property for sale in Headington Hill And Northway is £588,849. This amount is 3% higher than the average price in Oxford. There are 872 property listings for sale in Headington Hill And Northway.
What streets have the most expensive properties for sale in Headington Hill And Northway?
The streets with the most expensive properties for sale in Headington Hill And Northway are Pullens Lane at an average of £3,850,000, Jack Straws Lane at an average of £1,211,250 and Rolfe Place at an average of £1,157,500.
What streets have the most affordable properties for sale in Headington Hill And Northway?
The streets with the most affordable properties for sale in Headington Hill And Northway are Hastoe Grange at an average of £242,833, Stockleys Road at an average of £311,952 and Westlands Drive at an average of £320,150.
Which train stations are available in or near Headington Hill And Northway?
Some of the train stations available in or near Headington Hill And Northway are Oxford, Oxford Parkway and Islip.
Property Price Paid in Headington Hill And Northway by Year
The average sold property price by year was:
| Year | Average Sold Price | Price Change |
Sold Properties
|
|---|---|---|---|
| 2025 | £571,138 | -7% |
21 Properties |
| 2024 | £609,966 | 14% |
56 Properties |
| 2023 | £522,715 | -22% |
44 Properties |
| 2022 | £636,561 | 26% |
44 Properties |
| 2021 | £468,391 | -21% |
60 Properties |
| 2020 | £567,537 | 17% |
37 Properties |
| 2019 | £470,634 | -23% |
49 Properties |
| 2018 | £580,657 | 20% |
35 Properties |
| 2017 | £465,172 | -29% |
58 Properties |
| 2016 | £599,018 | 31% |
54 Properties |
| 2015 | £413,236 | -9% |
64 Properties |
| 2014 | £452,409 | 9% |
60 Properties |
| 2013 | £410,689 | 34% |
60 Properties |
| 2012 | £270,780 | -9% |
42 Properties |
| 2011 | £295,975 | -2% |
51 Properties |
| 2010 | £301,828 | 1% |
57 Properties |
| 2009 | £299,078 | -11% |
69 Properties |
| 2008 | £331,718 | 6% |
79 Properties |
| 2007 | £310,327 | 1% |
78 Properties |
| 2006 | £306,557 | 22% |
97 Properties |
| 2005 | £240,026 | -27% |
71 Properties |
| 2004 | £305,568 | 20% |
58 Properties |
| 2003 | £244,226 | 18% |
88 Properties |
| 2002 | £200,543 | 17% |
65 Properties |
| 2001 | £166,568 | 11% |
55 Properties |
| 2000 | £148,636 | 11% |
60 Properties |
| 1999 | £132,978 | 12% |
64 Properties |
| 1998 | £116,840 | 30% |
64 Properties |
| 1997 | £81,510 | -15% |
65 Properties |
| 1996 | £93,440 | -7% |
65 Properties |
| 1995 | £99,735 | - |
42 Properties |
Property Price per Property Type in Headington Hill And Northway
Here you can find historic sold price data in order to help with your property search.
The average Property Paid Price for specific property types in the last three years are:
| Property Type | Average Sold Price | Sold Properties |
|---|---|---|
| Semi Detached House | £481,003.00 | 75 Semi Detached Houses |
| Detached House | £1,304,485.00 | 28 Detached Houses |
| Terraced House | £484,463.00 | 36 Terraced Houses |
| Flat | £273,796.00 | 26 Flats |

