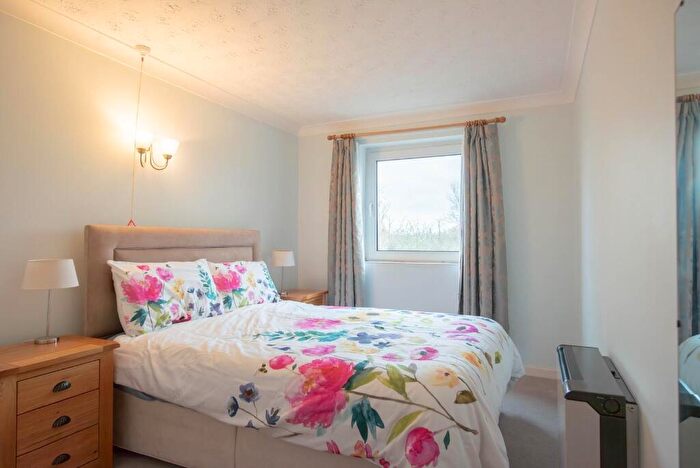
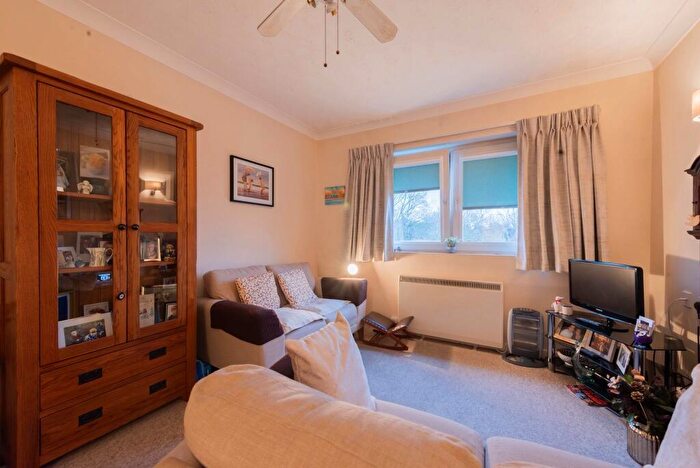
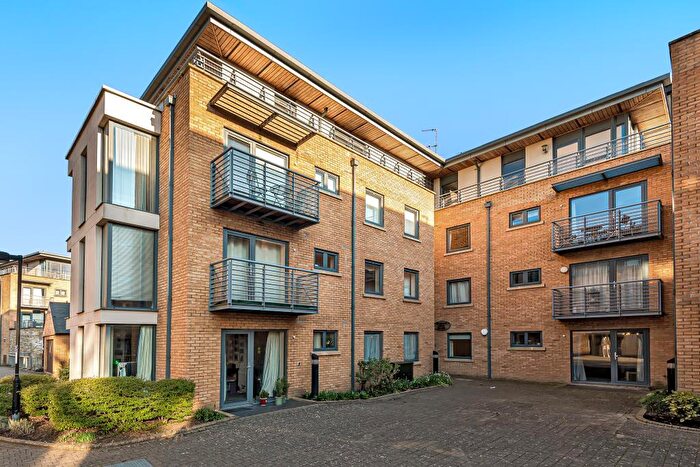
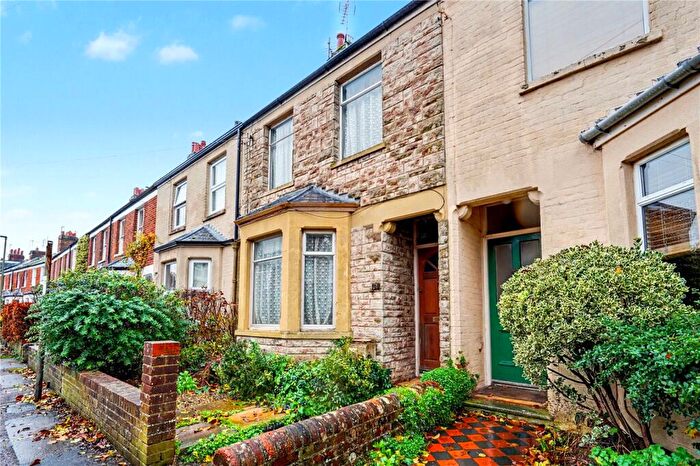
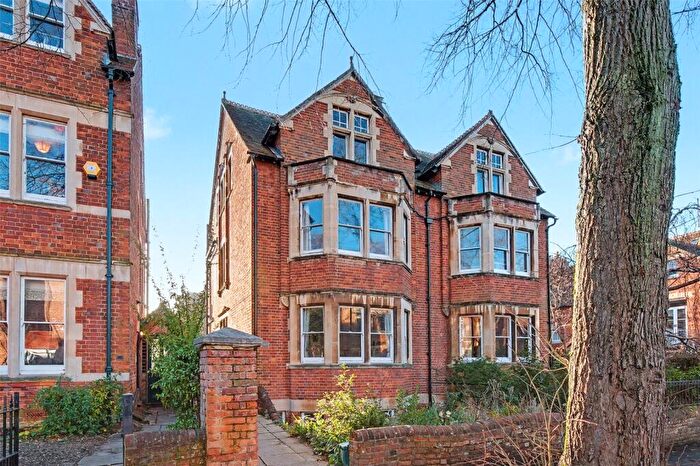
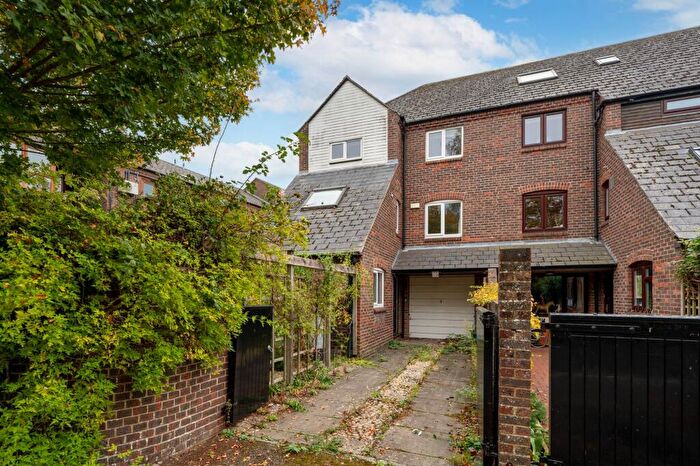
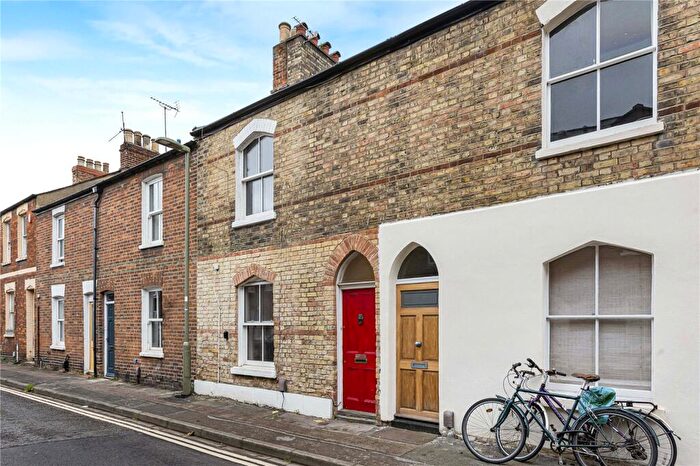
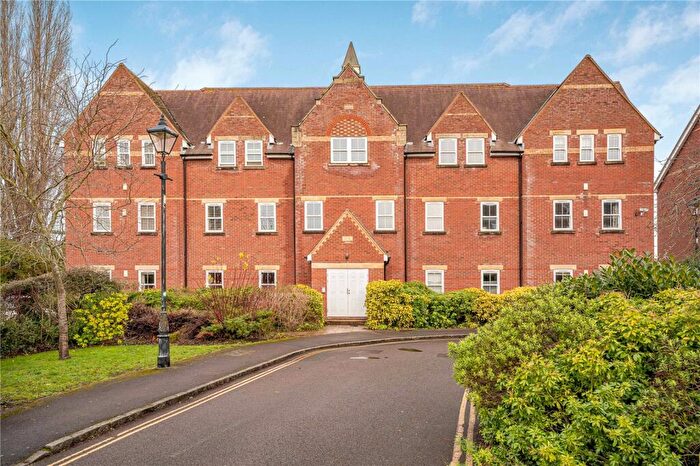
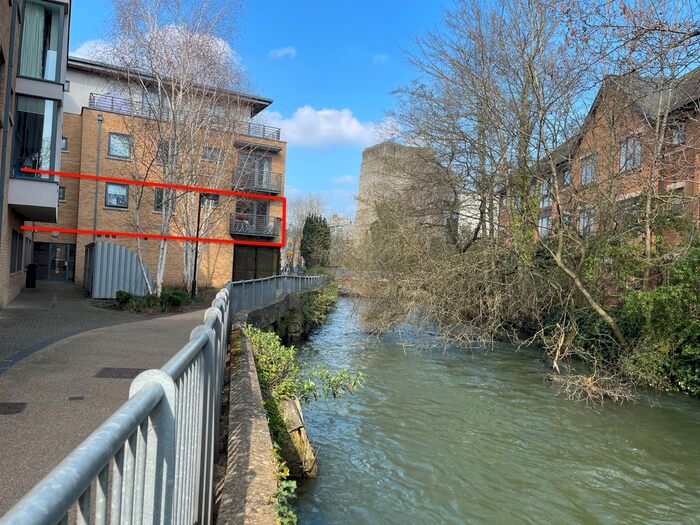
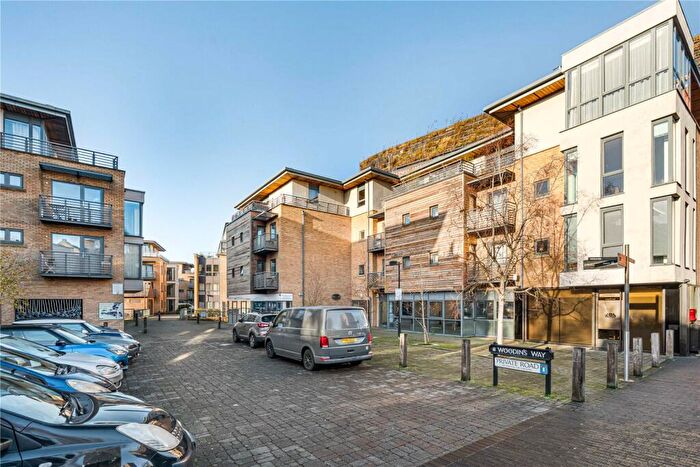
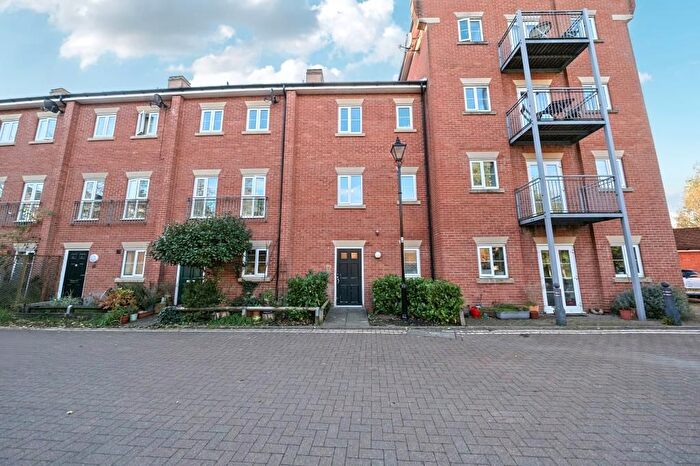
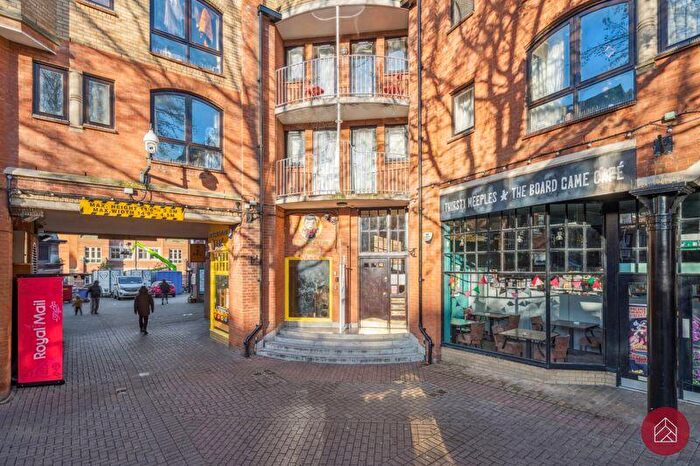
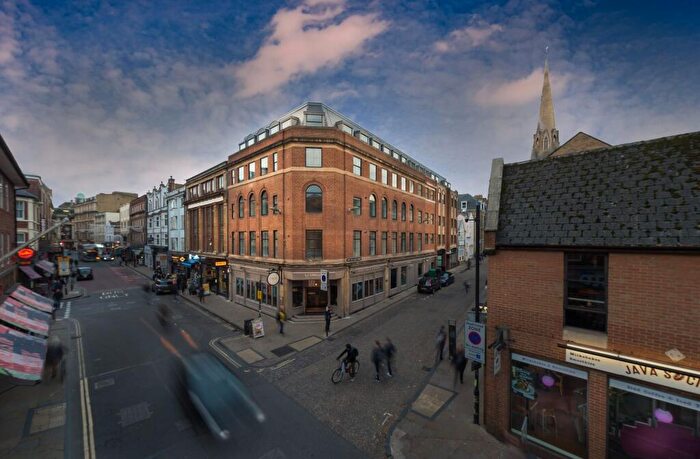
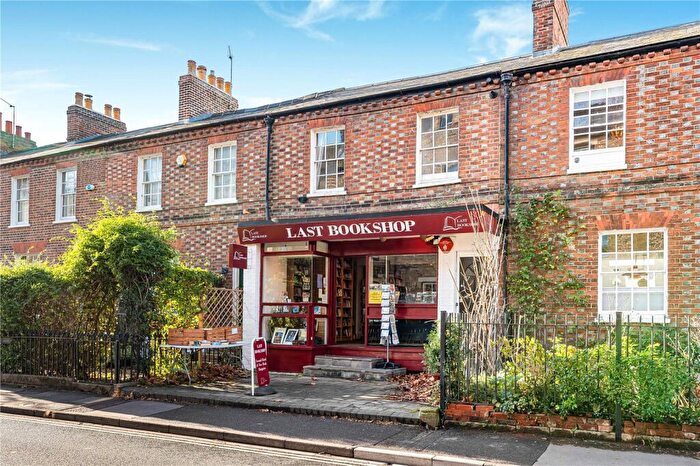
Houses for sale & to rent in Jericho And Osney, Oxford
House Prices in Jericho And Osney
Properties in Jericho And Osney have an average house price of £583,522.00 and had 193 Property Transactions within the last 3 years¹.
Jericho And Osney is an area in Oxford, Oxfordshire with 2,292 households², where the most expensive property was sold for £2,500,000.00.
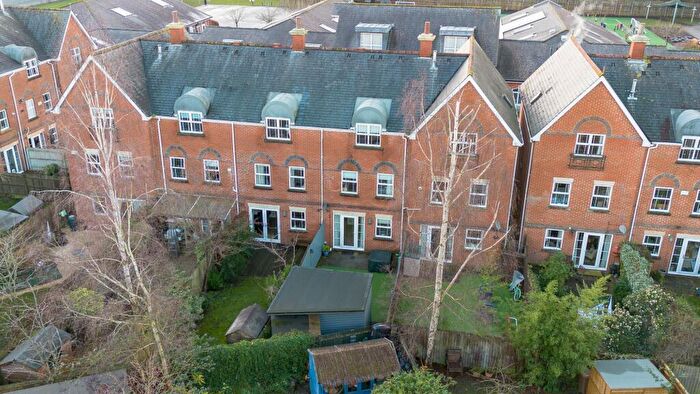
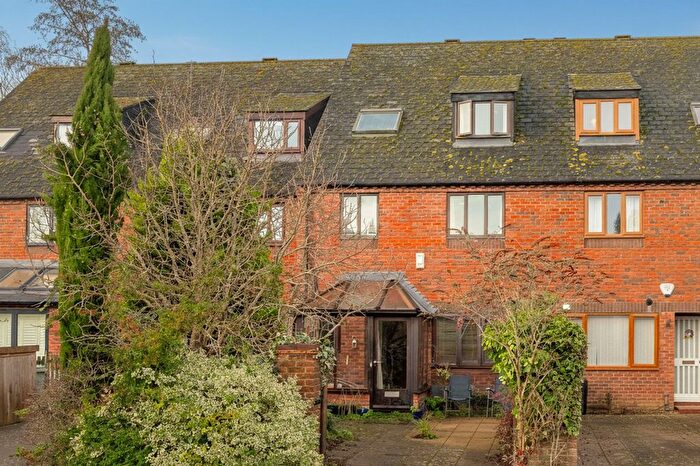
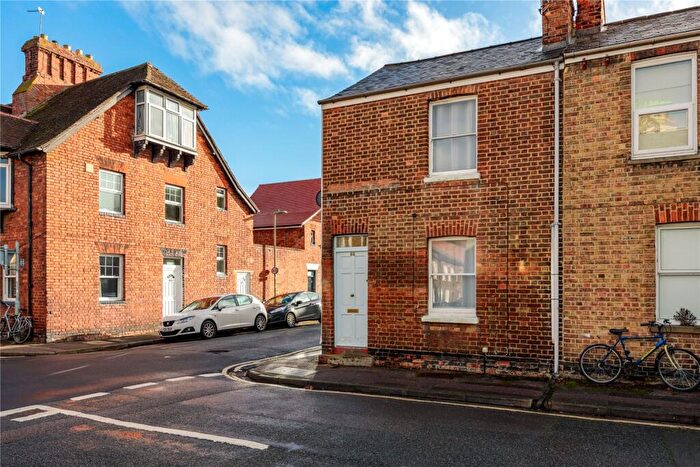
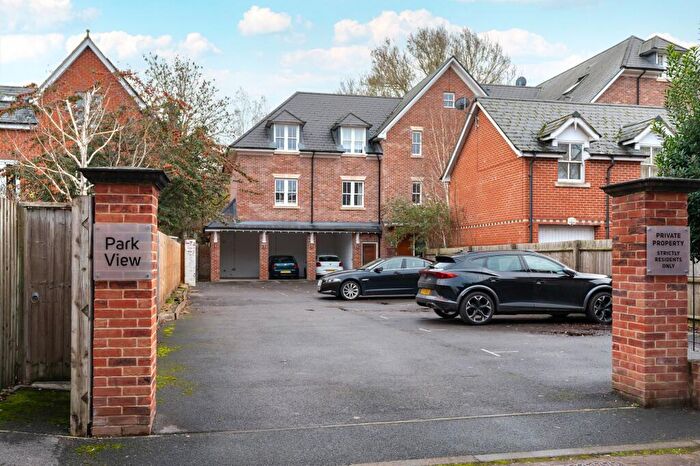
Properties for sale in Jericho And Osney
Roads and Postcodes in Jericho And Osney
Navigate through our locations to find the location of your next house in Jericho And Osney, Oxford for sale or to rent.
| Streets | Postcodes |
|---|---|
| Abbey Road | OX2 0AD OX2 0AE OX2 0AG |
| Abbey Walk | OX1 1NN |
| Albert Street | OX2 6AY OX2 6AZ |
| Alexandra Road | OX2 0DB OX2 0DD |
| Allam Street | OX2 6DQ |
| Arthur Street | OX2 0AS |
| Barrett Street | OX2 0AT |
| Binsey Lane | OX2 0EX OX2 0QJ |
| Botley Road | OX2 0AB OX2 0BL OX2 0BN OX2 0BP OX2 0BS OX2 0BT OX2 0BU OX2 0BW OX2 0BX OX2 0EZ OX2 0HD OX2 0HG OX2 0HH OX2 0HW |
| Bridge Street | OX2 0BA OX2 0BB OX2 0BD OX2 0DH |
| Brock Grove | OX2 0FD |
| Bullstake Close | OX2 0HN |
| Canal Street | OX2 6BH OX2 6BQ |
| Cardigan Street | OX2 6BP OX2 6BS OX2 6BW |
| Combe Road | OX2 6BL |
| Cranham Street | OX2 6DD OX2 6DE |
| Cranham Terrace | OX2 6DG |
| Cripley Road | OX2 0AH |
| Doyley Road | OX2 0BG |
| Duke Street | OX2 0HX |
| Earl Street | OX2 0JA |
| East Street | OX2 0AU |
| Ferry Hinksey Road | OX2 0BY OX2 0DP |
| Great Clarendon Street | OX2 6AT OX2 6AU OX2 6AX |
| Great Mead | OX1 2RB |
| Harley Road | OX2 0HR OX2 0HS |
| Hart Street | OX2 6BN |
| Helen Road | OX2 0DE OX2 0DF |
| Henry Road | OX2 0DG OX2 0PE OX2 0PF |
| Hill View Road | OX2 0BZ OX2 0DA |
| Hythe Bridge Street | OX1 2EP |
| Jericho Street | OX2 6BU |
| King Street | OX2 6DB OX2 6DF |
| Lamarsh Road | OX2 0LD |
| Marlborough Court | OX2 0QT |
| Mill Street | OX2 0AJ OX2 0AL OX2 0HJ |
| Mount Street | OX2 6DH |
| Nelson Street | OX2 6BD OX2 6BE |
| North Street | OX2 0AY |
| Oatlands Road | OX2 0ET OX2 0EU |
| Osney Mead | OX2 0ES |
| Prestwich Place | OX2 0ED |
| Rewley Road | OX1 2RA OX1 2RD OX1 2RG OX1 2RQ |
| Richmond Road | OX1 2JJ OX1 2JL |
| Rickyard Close | OX1 2RE |
| Riverside Road | OX2 0HT OX2 0HU |
| Russell Street | OX2 0AR |
| South Street | OX2 0BE |
| St Barnabas Street | OX2 6BG |
| Stable Close | OX1 2RF |
| Swan Street | OX2 0BJ |
| Upper Fisher Row | OX1 2EZ |
| Venables Close | OX2 6DS |
| Venneit Close | OX1 1HY OX1 1HZ |
| Victor Street | OX2 6BT |
| Walton Crescent | OX1 2JG |
| Walton Lane | OX1 2JN |
| Walton Street | OX1 2HG OX2 6AE OX2 6AG OX2 6ER |
| Wellington Street | OX2 6BB |
| West Street | OX2 0BH OX2 0BQ OX2 0NP |
| Whitworth Place | OX2 6BZ |
| Worcester Place | OX1 2JW |
| OX2 0NQ |
Transport near Jericho And Osney
- FAQ
- Price Paid By Year
- Property Type Price
Frequently asked questions about Jericho And Osney
What is the average price for a property for sale in Jericho And Osney?
The average price for a property for sale in Jericho And Osney is £583,522. This amount is 2% higher than the average price in Oxford. There are 706 property listings for sale in Jericho And Osney.
What streets have the most expensive properties for sale in Jericho And Osney?
The streets with the most expensive properties for sale in Jericho And Osney are Allam Street at an average of £1,750,000, Richmond Road at an average of £1,366,857 and Nelson Street at an average of £1,142,500.
What streets have the most affordable properties for sale in Jericho And Osney?
The streets with the most affordable properties for sale in Jericho And Osney are Henry Road at an average of £296,286, Brock Grove at an average of £301,666 and Russell Street at an average of £333,000.
Which train stations are available in or near Jericho And Osney?
Some of the train stations available in or near Jericho And Osney are Oxford, Oxford Parkway and Radley.
Property Price Paid in Jericho And Osney by Year
The average sold property price by year was:
| Year | Average Sold Price | Price Change |
Sold Properties
|
|---|---|---|---|
| 2025 | £538,285 | -20% |
45 Properties |
| 2024 | £643,343 | 18% |
88 Properties |
| 2023 | £529,712 | -16% |
60 Properties |
| 2022 | £616,789 | 13% |
69 Properties |
| 2021 | £539,485 | 5% |
78 Properties |
| 2020 | £512,904 | 5% |
50 Properties |
| 2019 | £488,216 | -16% |
56 Properties |
| 2018 | £567,633 | 14% |
67 Properties |
| 2017 | £488,356 | -8% |
72 Properties |
| 2016 | £525,750 | 13% |
72 Properties |
| 2015 | £457,931 | 5% |
79 Properties |
| 2014 | £434,738 | 10% |
81 Properties |
| 2013 | £392,850 | 8% |
105 Properties |
| 2012 | £360,887 | 9% |
70 Properties |
| 2011 | £328,228 | -5% |
87 Properties |
| 2010 | £345,337 | 7% |
106 Properties |
| 2009 | £322,113 | -5% |
78 Properties |
| 2008 | £337,063 | 1% |
65 Properties |
| 2007 | £332,302 | 12% |
100 Properties |
| 2006 | £292,552 | 6% |
144 Properties |
| 2005 | £274,210 | 6% |
104 Properties |
| 2004 | £258,954 | 2% |
135 Properties |
| 2003 | £253,249 | 16% |
131 Properties |
| 2002 | £212,145 | 11% |
182 Properties |
| 2001 | £189,862 | -2% |
211 Properties |
| 2000 | £193,461 | 17% |
105 Properties |
| 1999 | £161,118 | 15% |
175 Properties |
| 1998 | £137,101 | 18% |
176 Properties |
| 1997 | £112,776 | 18% |
175 Properties |
| 1996 | £92,526 | 5% |
117 Properties |
| 1995 | £88,019 | - |
77 Properties |
Property Price per Property Type in Jericho And Osney
Here you can find historic sold price data in order to help with your property search.
The average Property Paid Price for specific property types in the last three years are:
| Property Type | Average Sold Price | Sold Properties |
|---|---|---|
| Semi Detached House | £713,472.00 | 25 Semi Detached Houses |
| Detached House | £648,571.00 | 7 Detached Houses |
| Terraced House | £636,195.00 | 120 Terraced Houses |
| Flat | £339,012.00 | 41 Flats |

