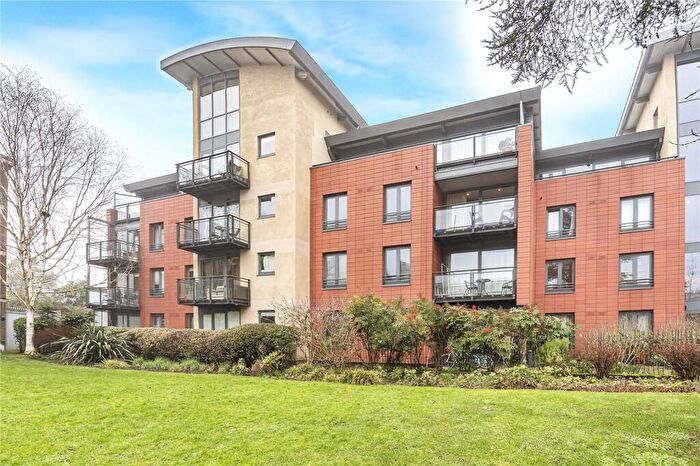
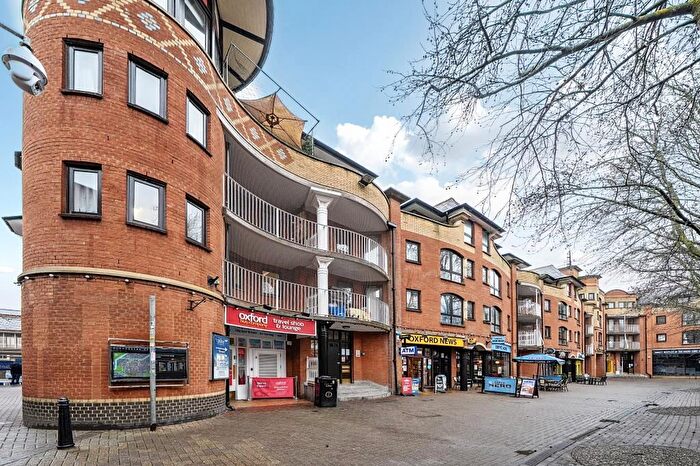
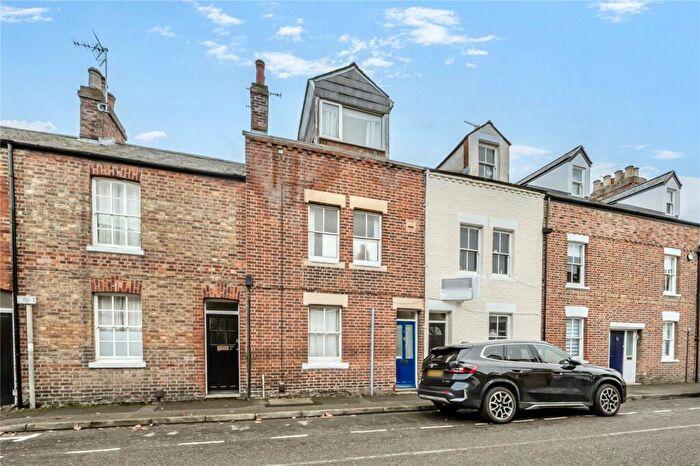
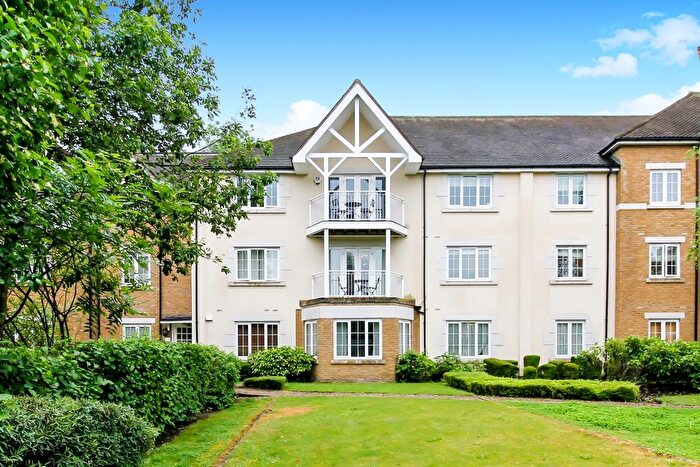
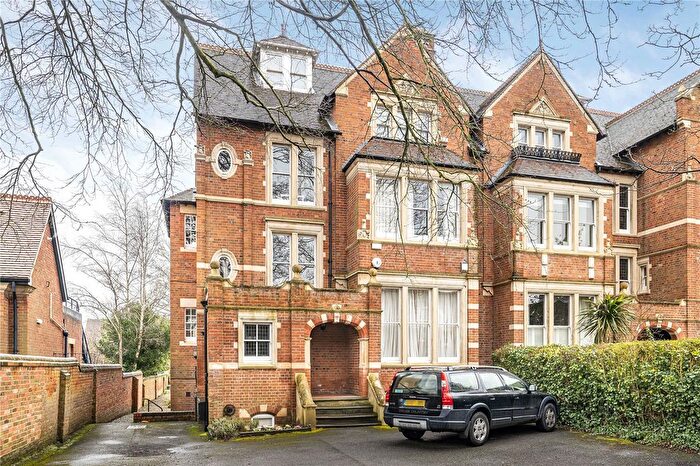
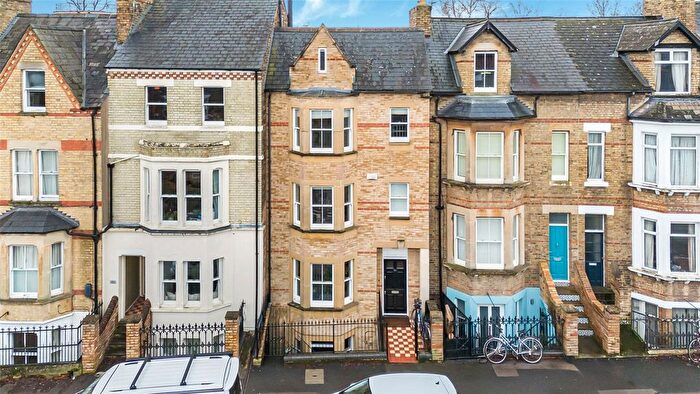
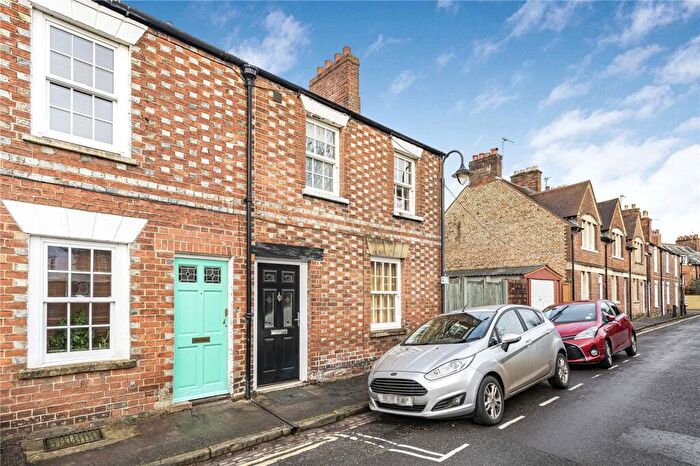
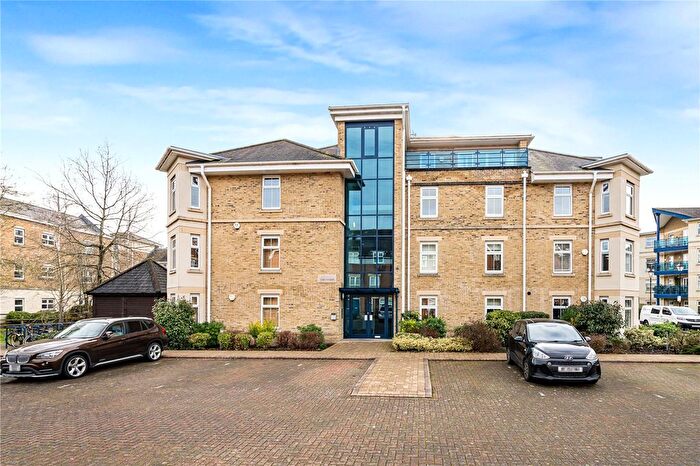
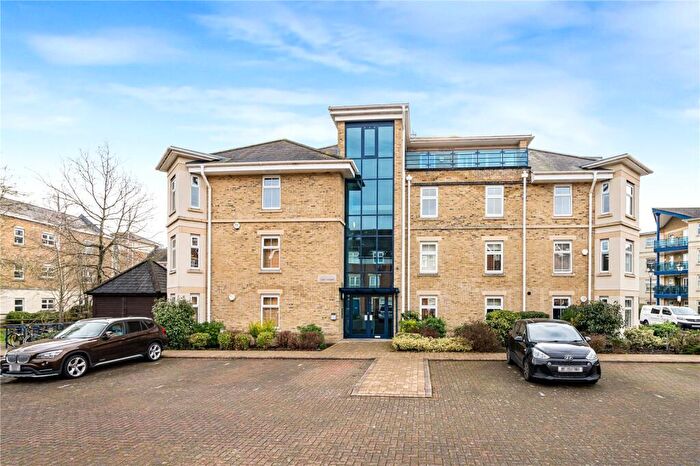
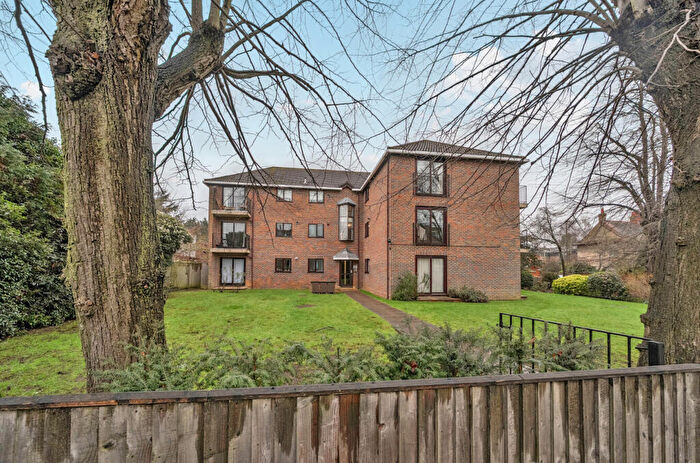
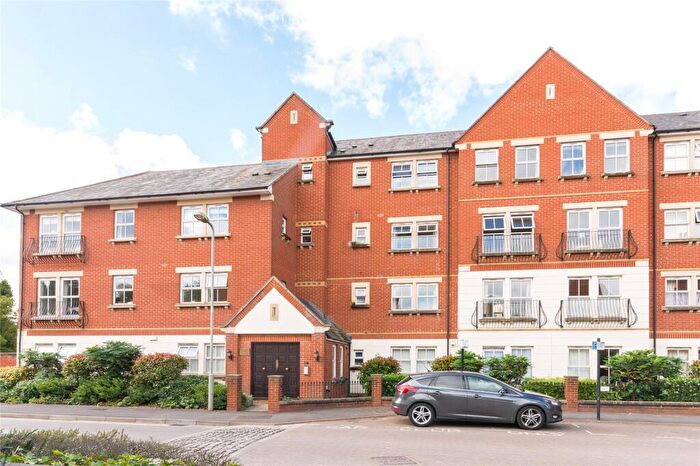
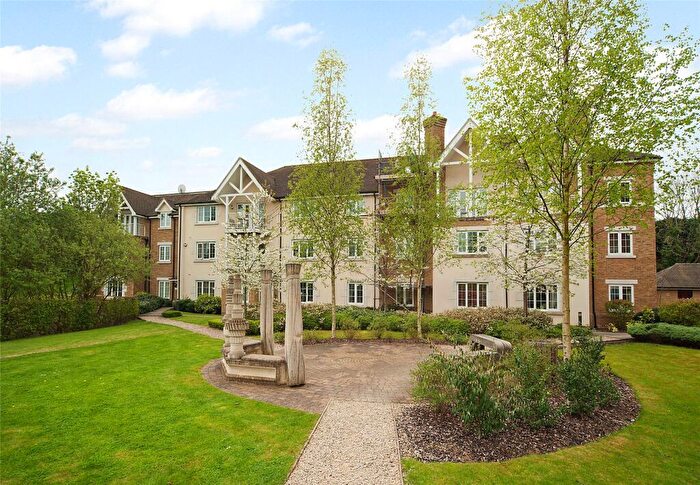
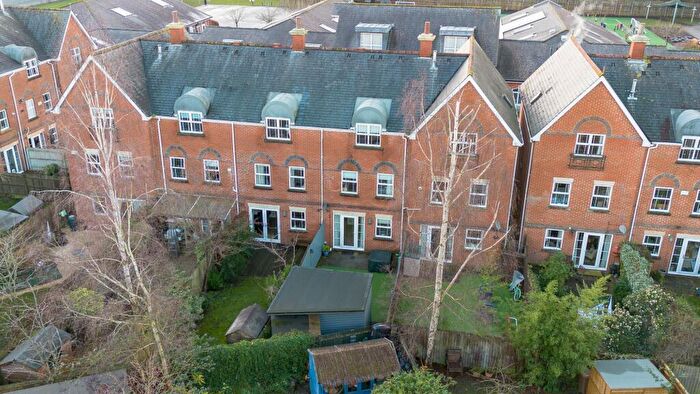
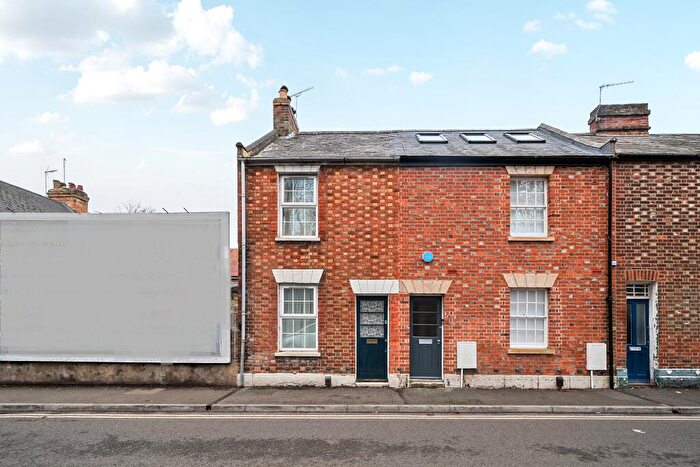
Houses for sale & to rent in North, Oxford
House Prices in North
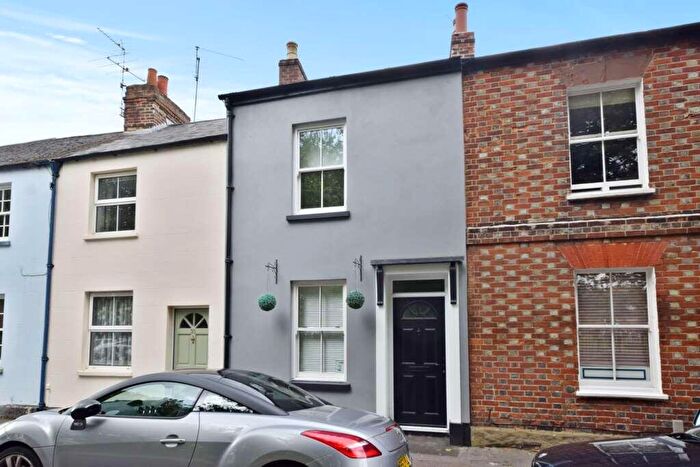
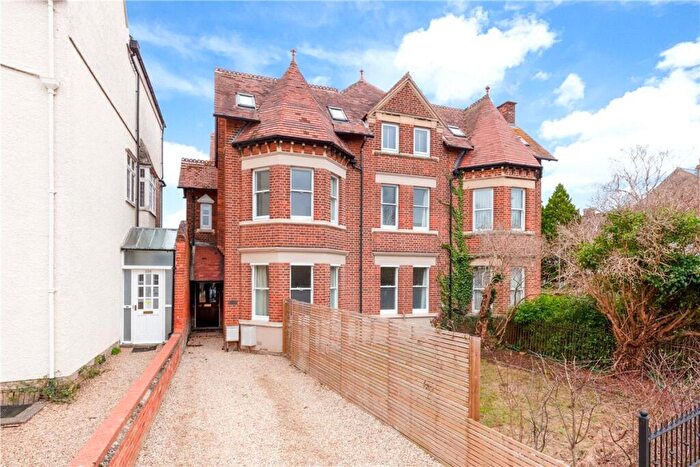
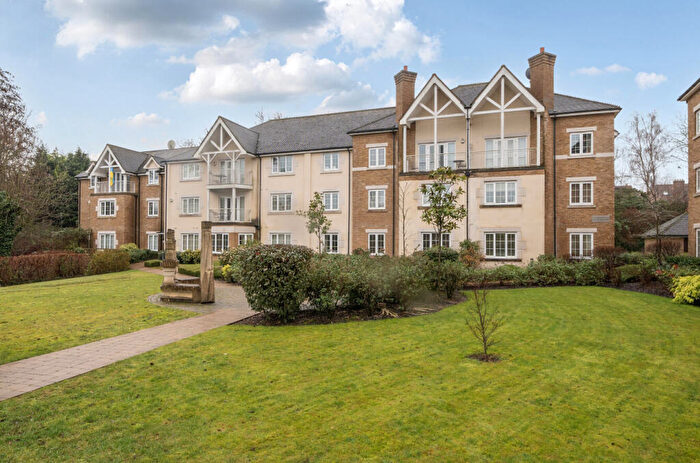
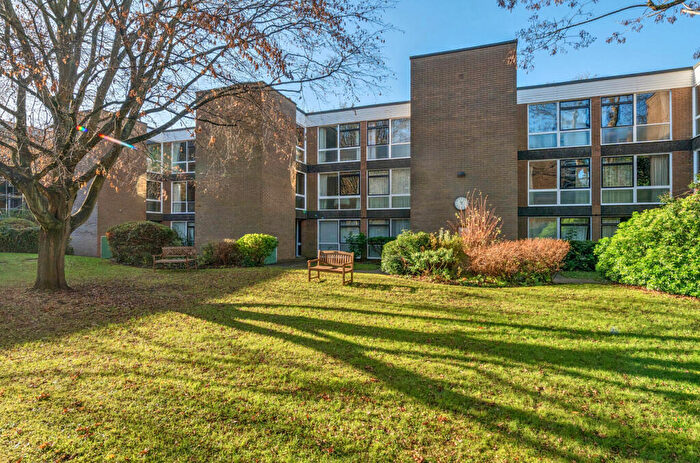
Properties in North have an average house price of £1,250,010.00 and had 131 Property Transactions within the last 3 years¹.
North is an area in Oxford, Oxfordshire with 1,624 households², where the most expensive property was sold for £6,168,400.00.
Properties for sale in North
Roads and Postcodes in North
Navigate through our locations to find the location of your next house in North, Oxford for sale or to rent.
| Streets | Postcodes |
|---|---|
| Adelaide Street | OX2 6EN |
| Aristotle Lane | OX2 6UA |
| Arthur Garrard Close | OX2 6EU |
| Banbury Road | OX2 6LF |
| Benson Place | OX2 6QH |
| Bradmore Road | OX2 6QP |
| Butler Close | OX2 6JG OX2 6JQ |
| Canterbury Road | OX2 6LU |
| Crick Road | OX2 6QJ OX2 6QL |
| Farndon Road | OX2 6RS OX2 6RT |
| Fyfield Road | OX2 6QE |
| Kingston Road | OX2 6EF OX2 6EG OX2 6RH OX2 6RJ OX2 6RN OX2 6RP OX2 6RQ OX2 6RW |
| Leckford Place | OX2 6JB |
| Leckford Road | OX2 6HX OX2 6HY |
| Longworth Road | OX2 6RA |
| Merrivale Square | OX2 6QX |
| Norham Gardens | OX2 6PS OX2 6QB OX2 6QD |
| Norham Road | OX2 6SF OX2 6SG OX2 6SQ |
| North Parade Avenue | OX2 6LX |
| Observatory Street | OX2 6EP OX2 6EW |
| Park Town | OX2 6SH OX2 6SJ OX2 6SL OX2 6SN |
| Plantation Road | OX2 6JD OX2 6JE |
| Plater Drive | OX2 6QT OX2 6QU |
| Rutherway | OX2 6QZ |
| Southmoor Road | OX2 6RB OX2 6RD OX2 6RE OX2 6RF |
| St Bernards Road | OX2 6EH OX2 6EJ |
| Tackley Place | OX2 6RR |
| The Villas | OX2 6QY |
| Walton Street | OX2 6EA OX2 6EB OX2 6ES |
| Walton Well Road | OX2 6AQ OX2 6ED OX2 6GF |
| Warnborough Road | OX2 6HZ OX2 6JA |
| William Lucy Way | OX2 6EQ |
| Winchester Road | OX2 6NA |
| Woodstock Road | OX2 6EY OX2 6HL OX2 6HQ OX2 6HT |
Transport near North
- FAQ
- Price Paid By Year
- Property Type Price
Frequently asked questions about North
What is the average price for a property for sale in North?
The average price for a property for sale in North is £1,250,010. This amount is 119% higher than the average price in Oxford. There are 812 property listings for sale in North.
What streets have the most expensive properties for sale in North?
The streets with the most expensive properties for sale in North are Fyfield Road at an average of £3,412,500, Park Town at an average of £3,009,156 and Warnborough Road at an average of £2,900,000.
What streets have the most affordable properties for sale in North?
The streets with the most affordable properties for sale in North are Butler Close at an average of £376,150, Adelaide Street at an average of £655,583 and St Bernards Road at an average of £704,166.
Which train stations are available in or near North?
Some of the train stations available in or near North are Oxford, Oxford Parkway and Islip.
Property Price Paid in North by Year
The average sold property price by year was:
| Year | Average Sold Price | Price Change |
Sold Properties
|
|---|---|---|---|
| 2025 | £1,082,852 | -17% |
31 Properties |
| 2024 | £1,267,143 | -7% |
60 Properties |
| 2023 | £1,353,859 | 13% |
40 Properties |
| 2022 | £1,174,245 | -5% |
37 Properties |
| 2021 | £1,231,728 | 1% |
68 Properties |
| 2020 | £1,218,103 | 7% |
41 Properties |
| 2019 | £1,135,402 | 17% |
36 Properties |
| 2018 | £942,782 | -67% |
49 Properties |
| 2017 | £1,569,867 | 33% |
39 Properties |
| 2016 | £1,053,444 | -17% |
42 Properties |
| 2015 | £1,232,392 | -9% |
51 Properties |
| 2014 | £1,346,461 | 28% |
46 Properties |
| 2013 | £976,092 | 1% |
63 Properties |
| 2012 | £965,817 | 10% |
61 Properties |
| 2011 | £865,674 | 25% |
66 Properties |
| 2010 | £647,479 | 11% |
85 Properties |
| 2009 | £578,955 | 5% |
40 Properties |
| 2008 | £547,939 | 16% |
94 Properties |
| 2007 | £459,405 | -18% |
86 Properties |
| 2006 | £541,073 | -1% |
94 Properties |
| 2005 | £549,089 | -1% |
69 Properties |
| 2004 | £553,248 | 25% |
72 Properties |
| 2003 | £417,670 | 6% |
74 Properties |
| 2002 | £390,910 | -4% |
70 Properties |
| 2001 | £405,758 | 29% |
91 Properties |
| 2000 | £286,888 | 15% |
53 Properties |
| 1999 | £243,348 | 12% |
102 Properties |
| 1998 | £215,041 | 1% |
147 Properties |
| 1997 | £211,947 | 18% |
119 Properties |
| 1996 | £172,775 | -1% |
48 Properties |
| 1995 | £174,026 | - |
45 Properties |
Property Price per Property Type in North
Here you can find historic sold price data in order to help with your property search.
The average Property Paid Price for specific property types in the last three years are:
| Property Type | Average Sold Price | Sold Properties |
|---|---|---|
| Semi Detached House | £2,338,071.00 | 25 Semi Detached Houses |
| Detached House | £1,614,642.00 | 7 Detached Houses |
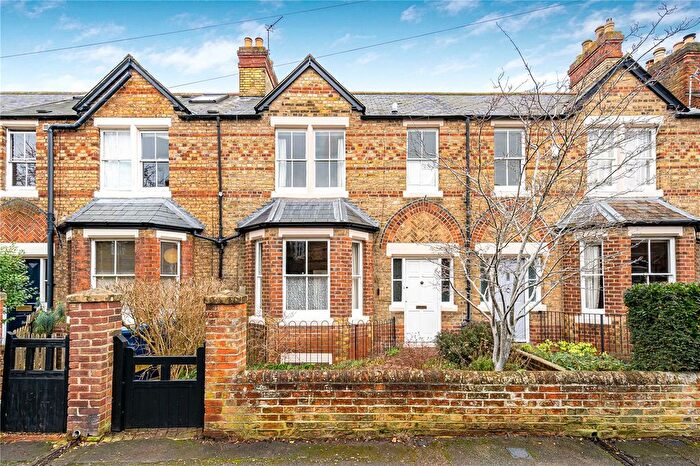
| Terraced House | £1,133,825.00 | 63 Terraced Houses |
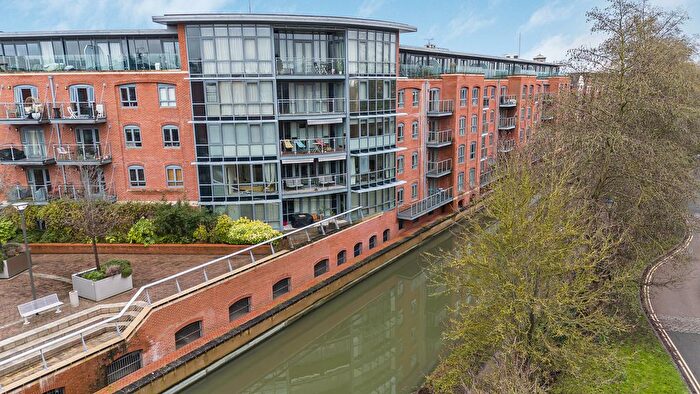
| Flat | £626,835.00 | 36 Flats |

