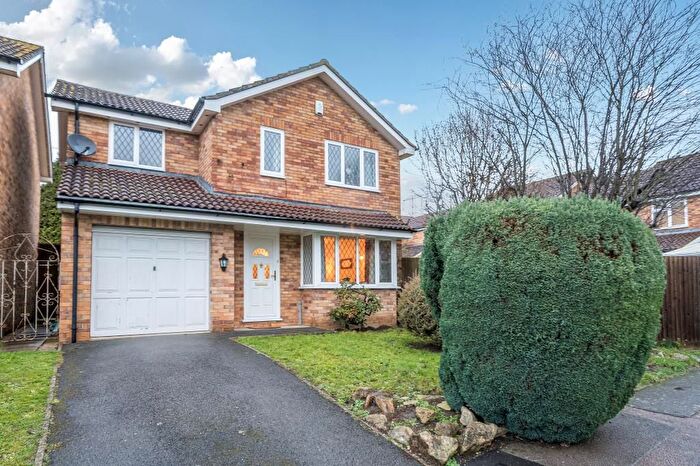
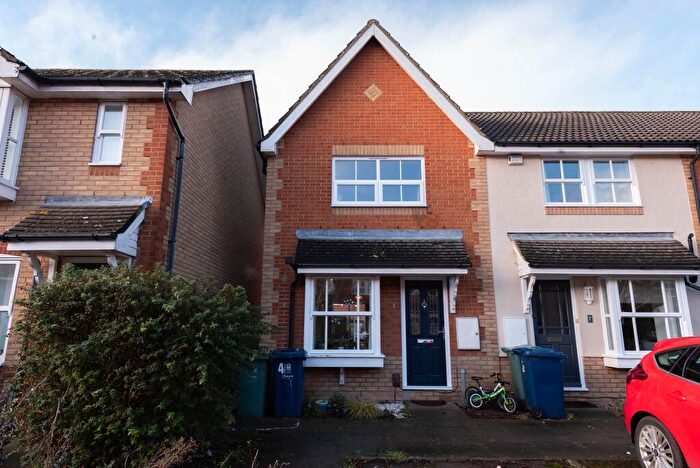
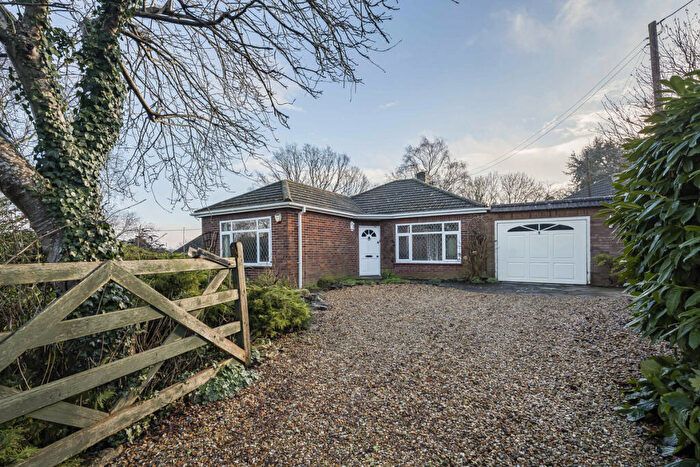
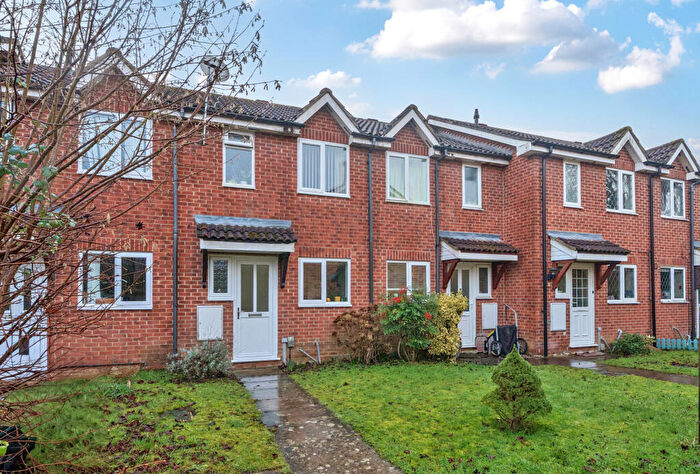
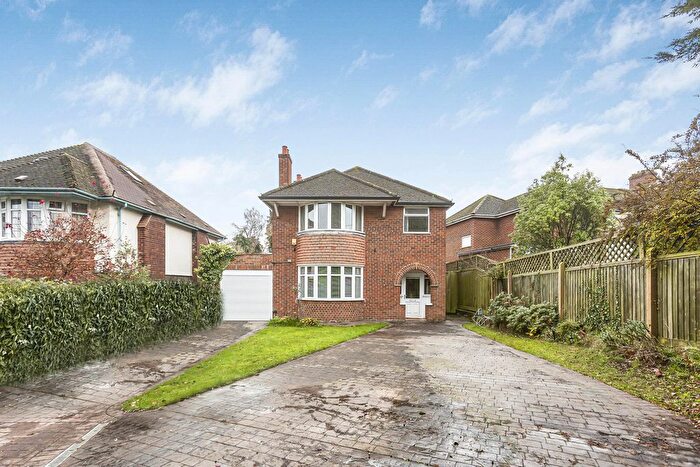
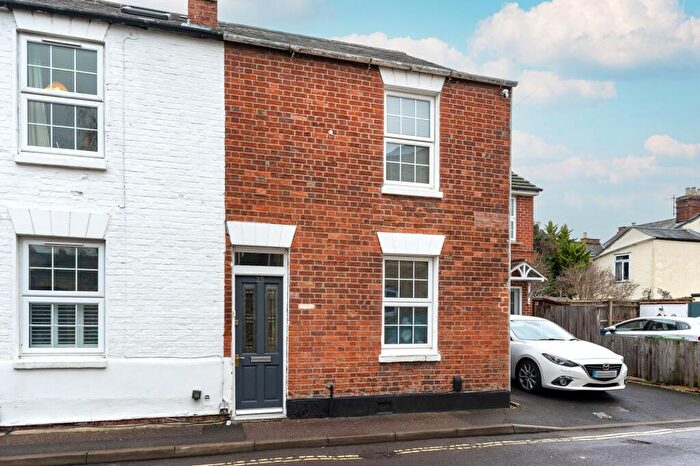
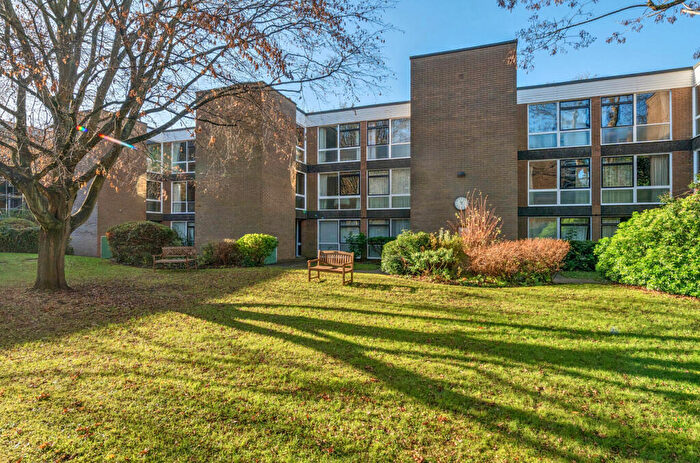
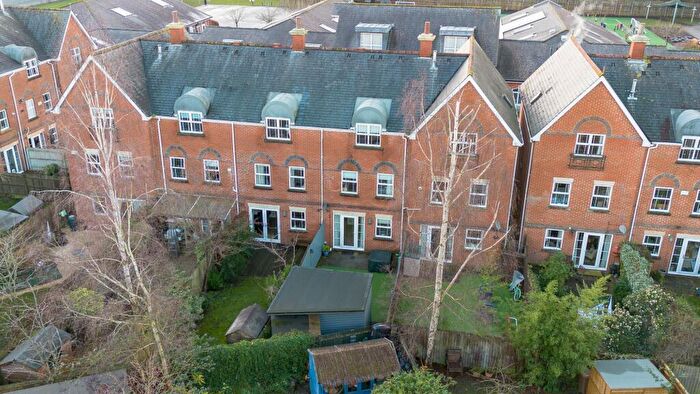
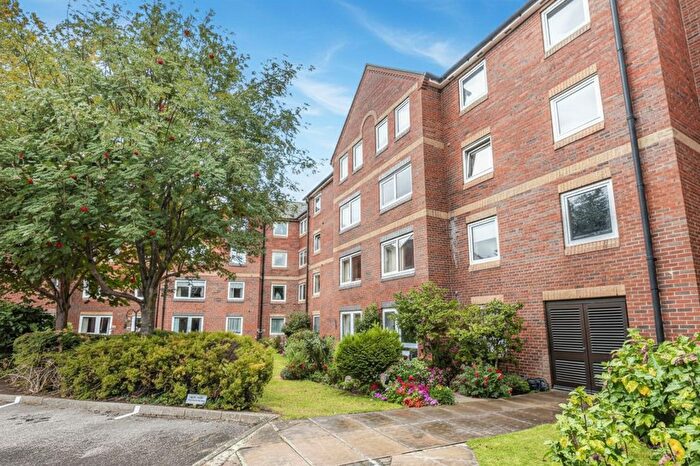
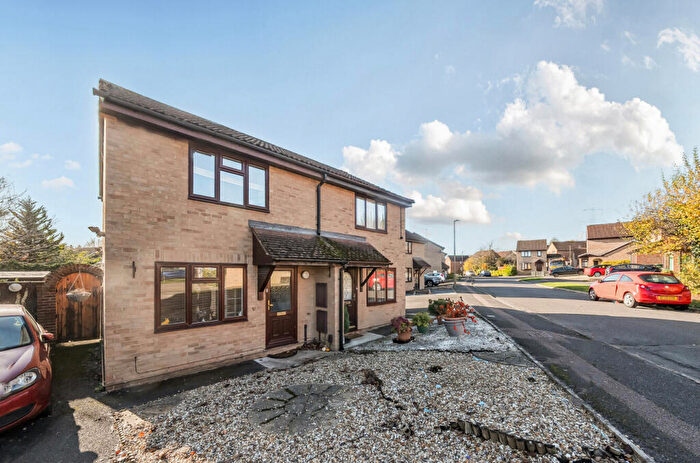
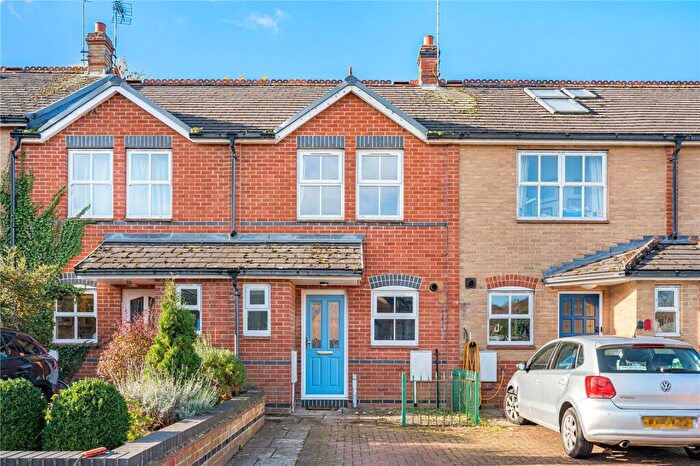
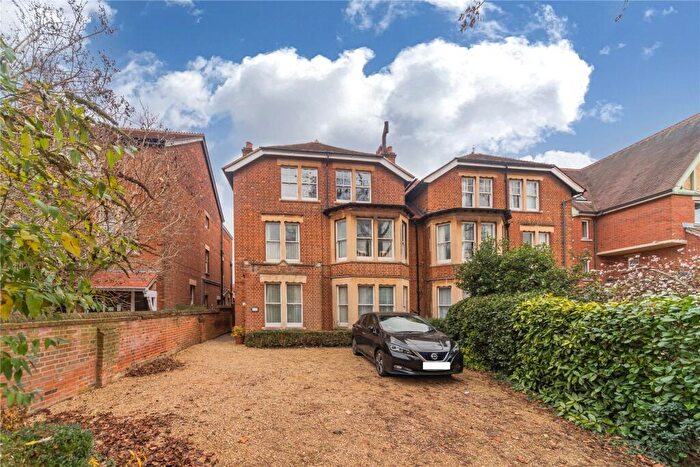
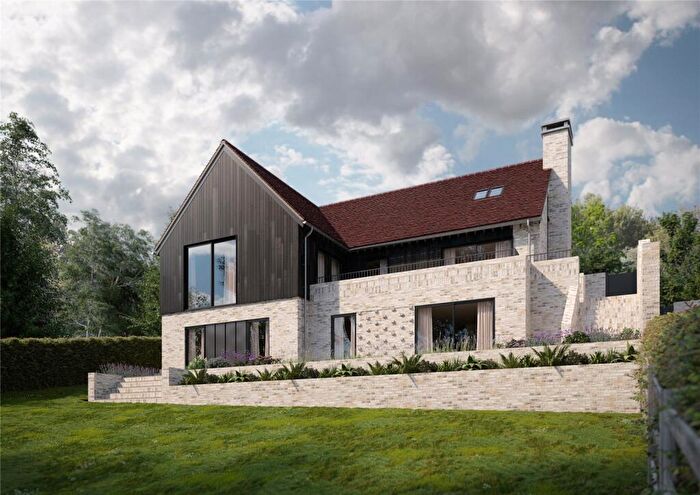
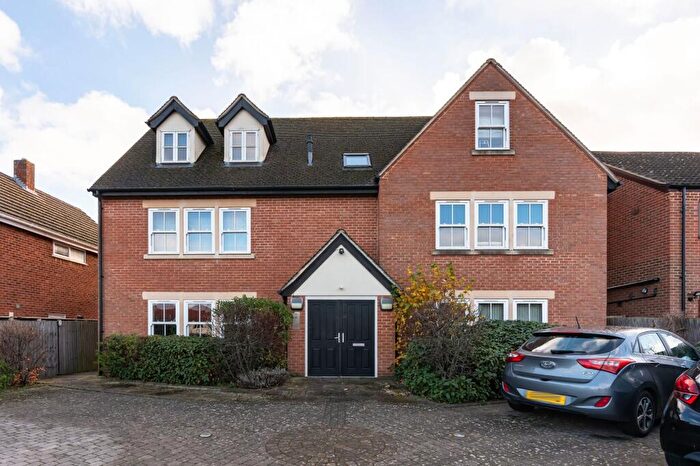
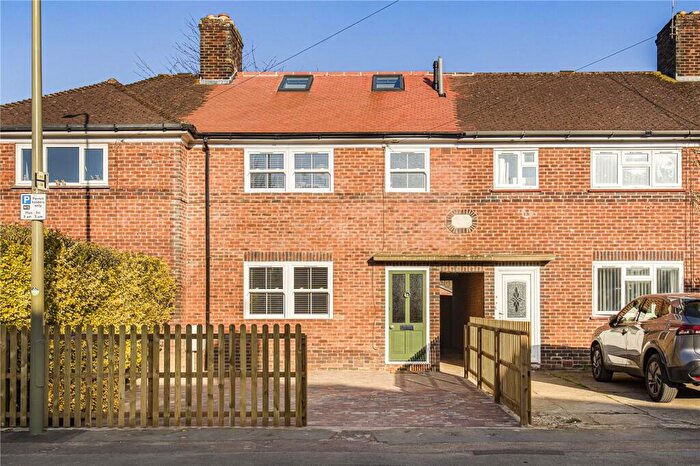
Houses for sale & to rent in Botley & Sunningwell, Oxford
House Prices in Botley & Sunningwell
Properties in Botley & Sunningwell have an average house price of £429,370.00 and had 38 Property Transactions within the last 3 years¹.
Botley & Sunningwell is an area in Oxford, Oxfordshire with 199 households², where the most expensive property was sold for £760,000.00.
Properties for sale in Botley & Sunningwell
Roads and Postcodes in Botley & Sunningwell
Navigate through our locations to find the location of your next house in Botley & Sunningwell, Oxford for sale or to rent.
| Streets | Postcodes |
|---|---|
| Berkeley Road | OX1 5ET |
| Chapel Way | OX2 9LS |
| Church Way | OX2 9SX OX2 9TH |
| Dunstead Lane | OX2 8QL |
| Elms Court | OX2 9LP |
| Elms Parade | OX2 9JW OX2 9LG |
| Elms Road | OX2 9JS OX2 9TB |
| Eynsham Road | OX2 9GT |
| Foxcombe Drive | OX1 5AF |
| Halliday Lane | OX2 0FG |
| Harcourt Hill | OX2 9AT OX2 9GJ OX2 9GL OX2 9GN OX2 9GP OX2 9GQ OX2 9GR |
| Heatley Way | OX2 9SL |
| Hinksey Business Centre | OX2 0NR |
| Hinksey Hill | OX1 5BS |
| Laburnum Road | OX2 9TL |
| Lime Road | OX2 9EH |
| Millais Close | OX2 9GW |
| Murdoch Place | OX2 9SR |
| North Hinksey Lane | OX2 0JN OX2 0JT OX2 0NB OX2 0QS |
| Red Bridge Hollow | OX1 4XS |
| Ruskin Close | OX2 9FU |
| Seacourt Road | OX2 9LN |
| Southern-by-pass | OX1 5AA |
| The Square | OX2 9LH OX2 9LJ |
| Tilbury Lane | OX2 9ND |
| Turner Drive | OX2 9GX OX2 9GY |
| West Way | OX2 0FB OX2 0FH OX2 0JB OX2 0JJ OX2 0PH OX2 0PL OX2 0QH OX2 0QL OX2 9JN OX2 9LZ OX2 0FL |
| Wytham View | OX2 9SP |
| OX2 0FJ OX2 0JW OX2 8PY OX2 8QA OX2 8QB OX2 8QH OX2 8QJ OX2 8QN OX2 8QP OX2 8QQ OX2 9BQ OX2 9TD OX2 9TE OX2 9TF OX2 9TG OX2 9TJ |
Transport near Botley & Sunningwell
-
Oxford Station
-
Oxford Parkway Station
-
Radley Station
-
Islip Station
-
Hanborough Station
-
Combe Station
-
Culham Station
-
Appleford Station
-
Tackley Station
- FAQ
- Price Paid By Year
- Property Type Price
Frequently asked questions about Botley & Sunningwell
What is the average price for a property for sale in Botley & Sunningwell?
The average price for a property for sale in Botley & Sunningwell is £429,370. This amount is 25% lower than the average price in Oxford. There are 3,724 property listings for sale in Botley & Sunningwell.
What streets have the most expensive properties for sale in Botley & Sunningwell?
The streets with the most expensive properties for sale in Botley & Sunningwell are Murdoch Place at an average of £668,500, Heatley Way at an average of £502,000 and Turner Drive at an average of £417,267.
What streets have the most affordable properties for sale in Botley & Sunningwell?
The streets with the most affordable properties for sale in Botley & Sunningwell are West Way at an average of £323,500, Wytham View at an average of £331,250 and Elms Road at an average of £372,250.
Which train stations are available in or near Botley & Sunningwell?
Some of the train stations available in or near Botley & Sunningwell are Oxford, Oxford Parkway and Radley.
Property Price Paid in Botley & Sunningwell by Year
The average sold property price by year was:
| Year | Average Sold Price | Price Change |
Sold Properties
|
|---|---|---|---|
| 2025 | £424,111 | -2% |
9 Properties |
| 2024 | £434,666 | 3% |
11 Properties |
| 2023 | £423,500 | -2% |
4 Properties |
| 2022 | £430,267 | 1% |
14 Properties |
| 2021 | £425,294 | 15% |
17 Properties |
| 2020 | £361,150 | -17% |
10 Properties |
| 2019 | £422,940 | -13% |
25 Properties |
| 2018 | £479,666 | 8% |
6 Properties |
| 2017 | £441,307 | -7% |
14 Properties |
| 2016 | £470,614 | 14% |
34 Properties |
| 2015 | £406,186 | 21% |
47 Properties |
| 2014 | £319,876 | - |
38 Properties |
Property Price per Property Type in Botley & Sunningwell
Here you can find historic sold price data in order to help with your property search.
The average Property Paid Price for specific property types in the last three years are:
| Property Type | Average Sold Price | Sold Properties |
|---|---|---|
| Detached House | £633,857.00 | 7 Detached Houses |
| Terraced House | £452,645.00 | 12 Terraced Houses |
| Semi Detached House | £457,500.00 | 4 Semi Detached Houses |
| Flat | £307,821.00 | 15 Flats |

