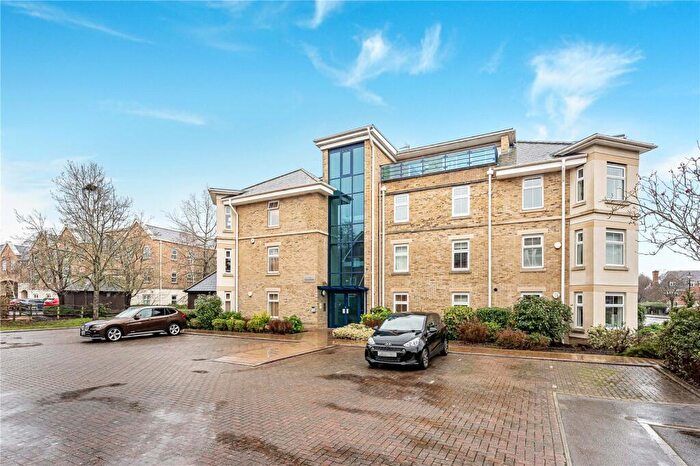
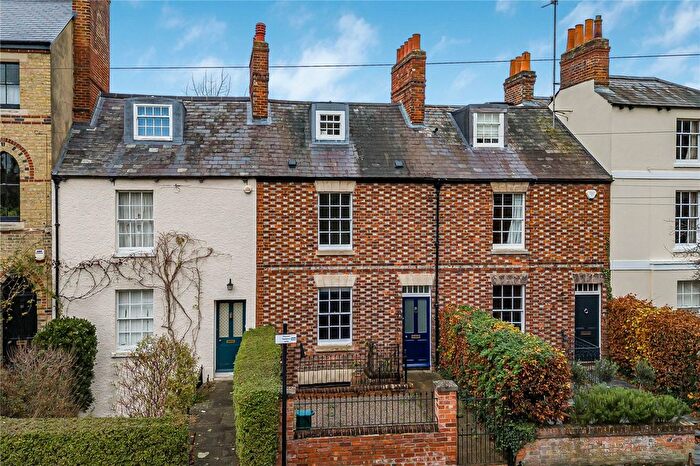
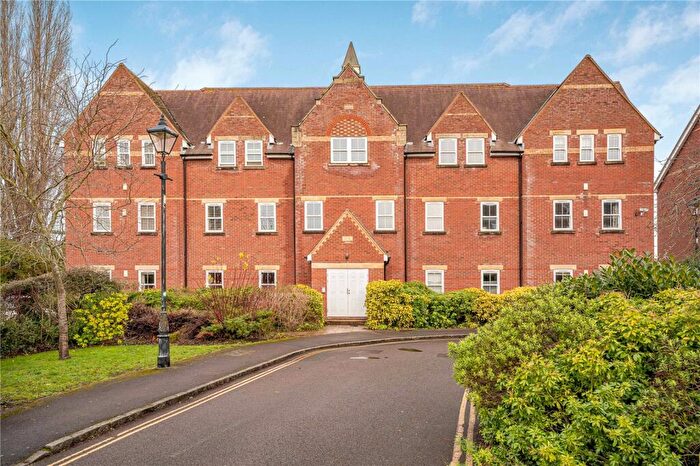
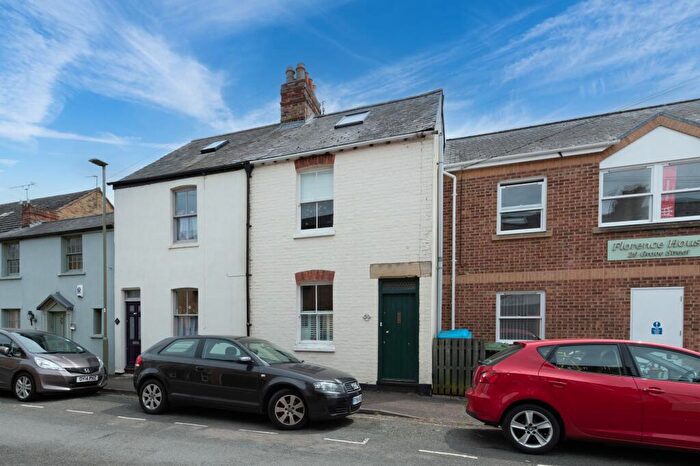
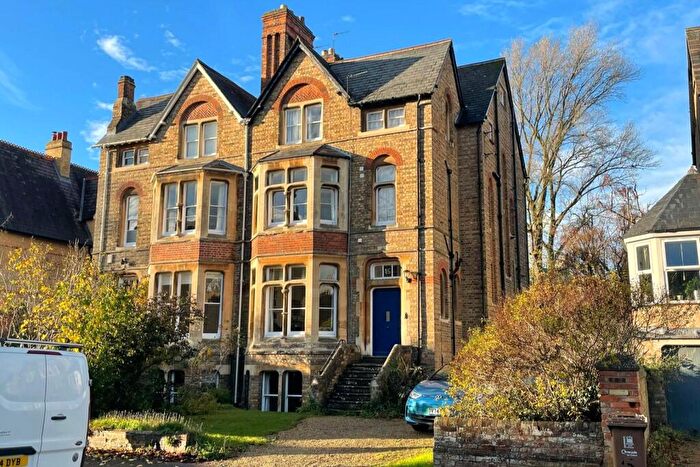
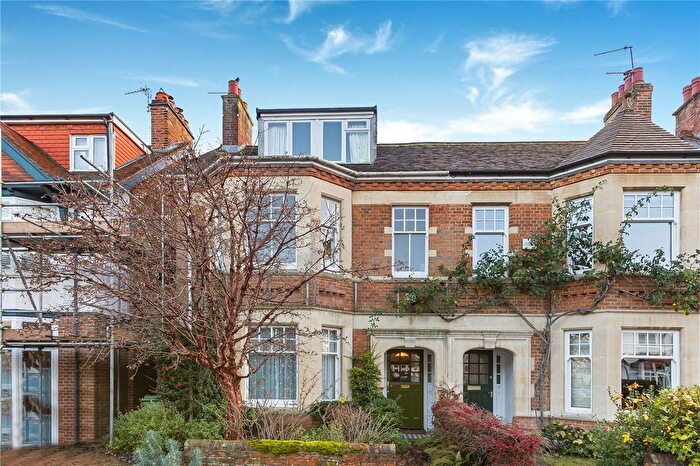
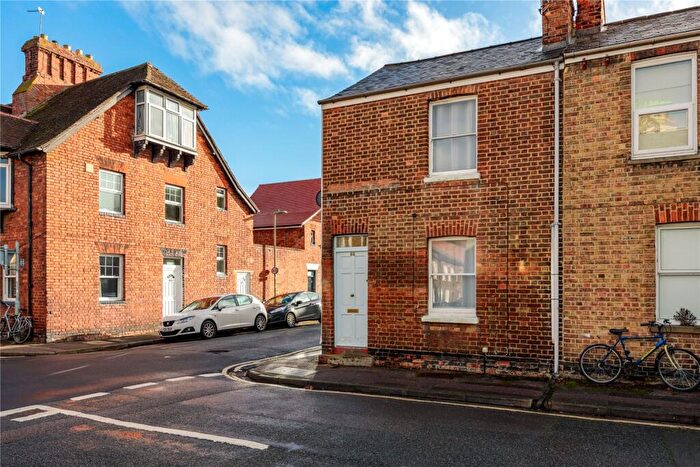
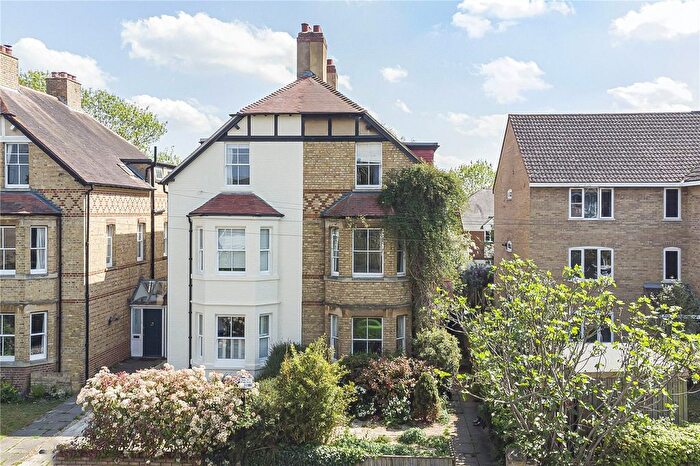
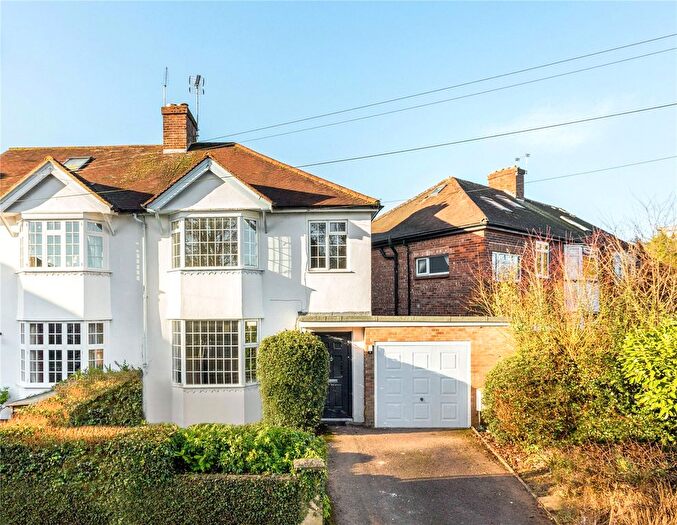
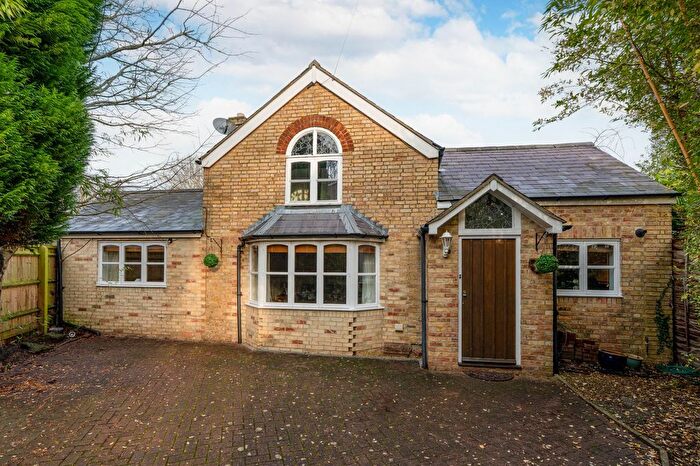
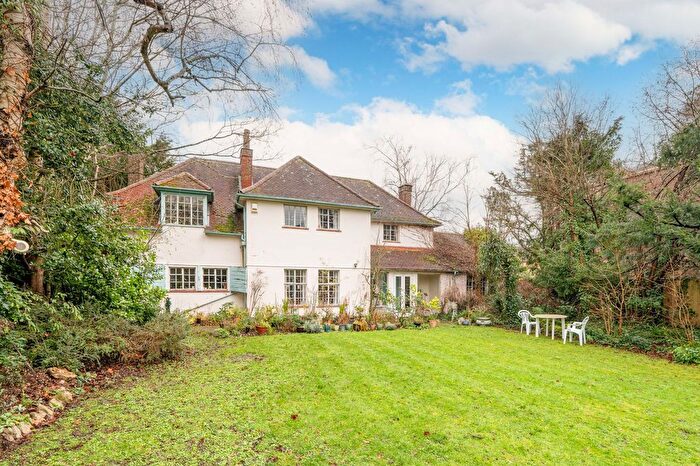
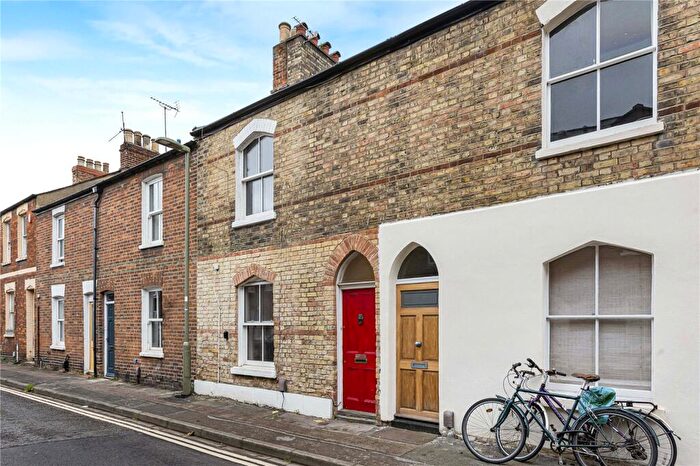
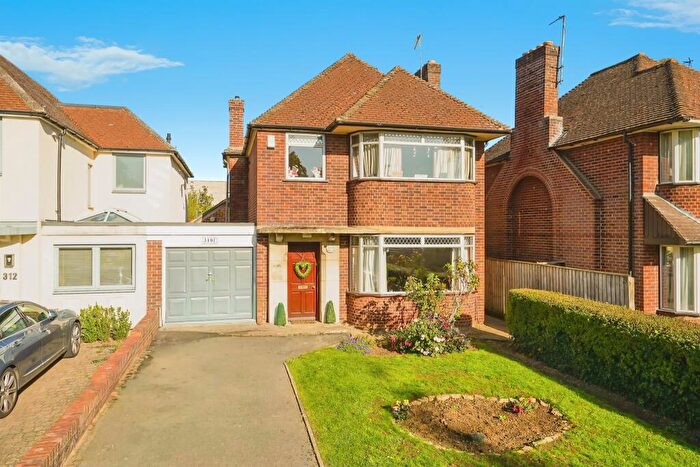
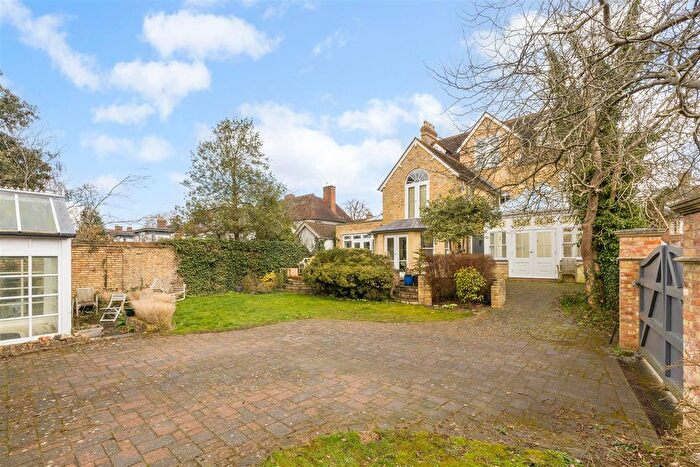
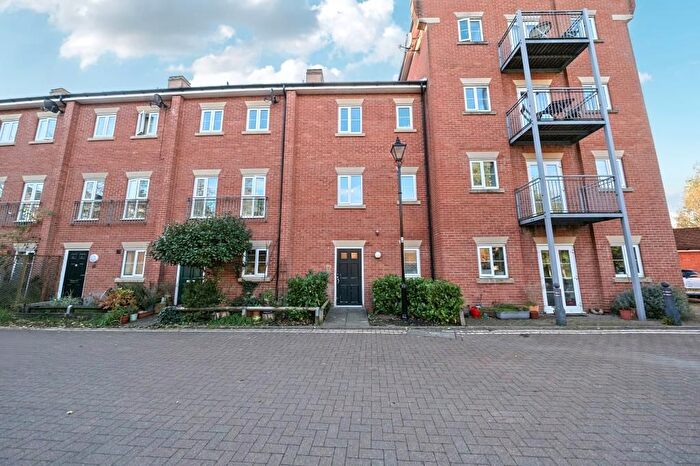
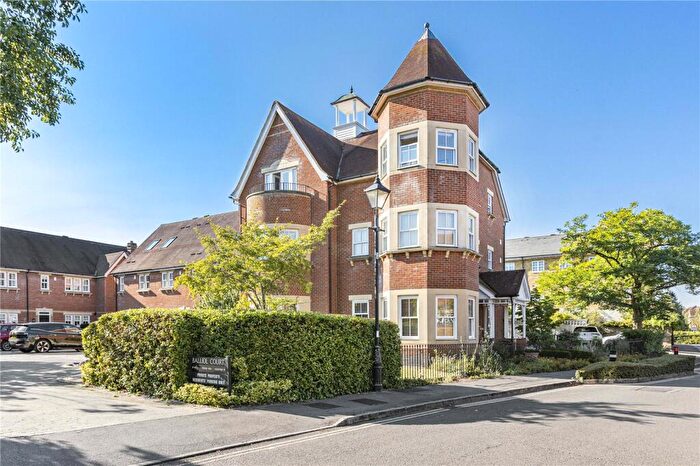
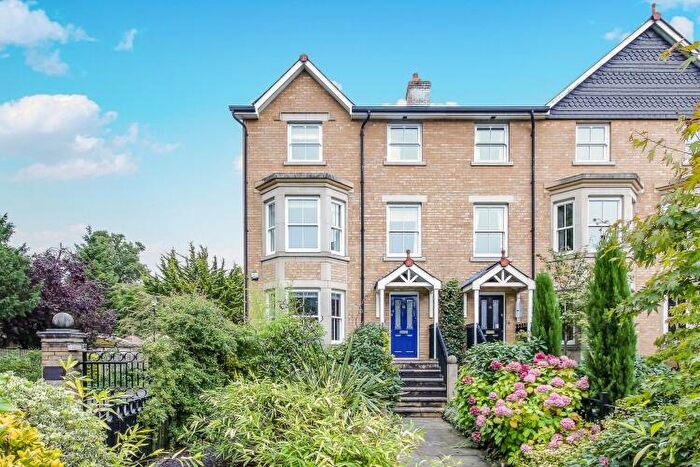
Houses for sale & to rent in St Margarets, Oxford
House Prices in St Margarets
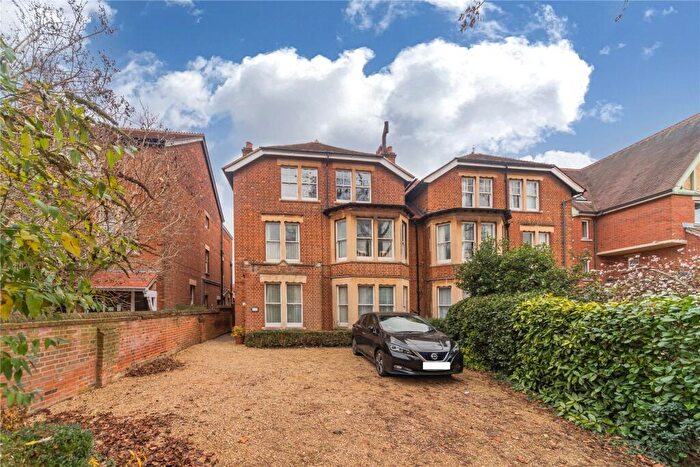
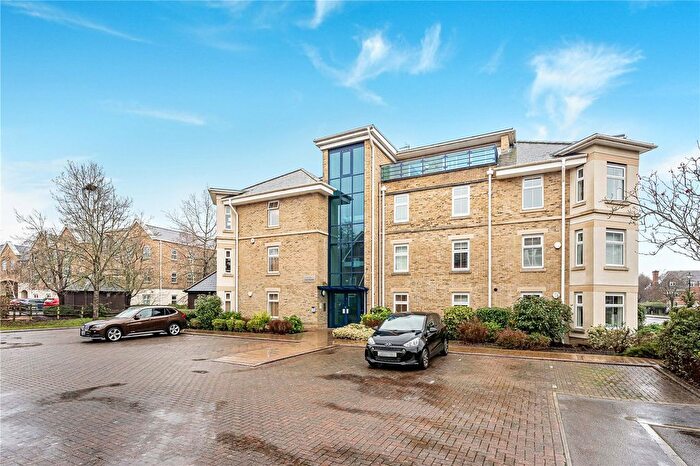
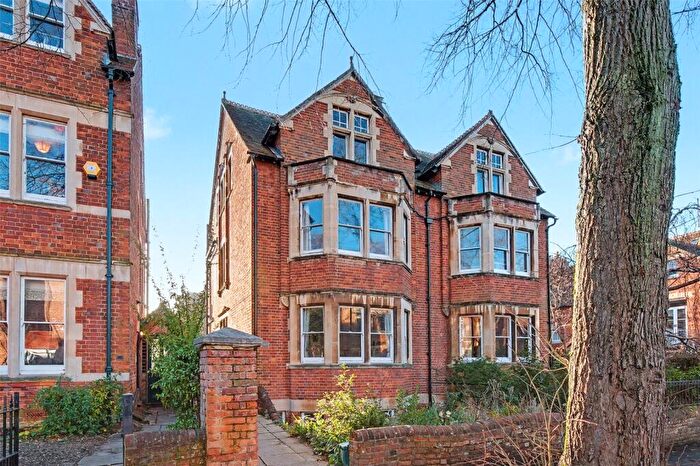
Properties in St Margarets have an average house price of £1,149,935.00 and had 249 Property Transactions within the last 3 years¹.
St Margarets is an area in Oxford, Oxfordshire with 1,860 households², where the most expensive property was sold for £6,750,000.00.
Properties for sale in St Margarets
Roads and Postcodes in St Margarets
Navigate through our locations to find the location of your next house in St Margarets, Oxford for sale or to rent.
| Streets | Postcodes |
|---|---|
| Bainton Road | OX2 7AF OX2 7AG OX2 7AQ OX2 7BH |
| Banbury Road | OX2 6JT OX2 6JU OX2 6JX OX2 6LQ OX2 7AA OX2 7AJ OX2 7AN OX2 7AW OX2 7BP OX2 7BT OX2 7BY |
| Bardwell Road | OX2 6SR OX2 6ST OX2 6SU OX2 6SW |
| Belbroughton Road | OX2 6UZ |
| Brindley Close | OX2 6XN |
| Burgess Mead | OX2 6XP |
| Chadlington Road | OX2 6SY |
| Chalfont Road | OX2 6TH OX2 6TJ OX2 6TL |
| Charlbury Road | OX2 6UT OX2 6UU OX2 6UX |
| Clear Water Place | OX2 7NL |
| Complins Close | OX2 6PZ |
| Coxs Ground | OX2 6PX |
| Cunliffe Close | OX2 7BJ OX2 7BL |
| Diamond Cottages | OX2 7EQ |
| Elizabeth Jennings Way | OX2 7BN OX2 7BW OX2 7EJ |
| Ferry Pool Road | OX2 7DT |
| Frenchay Road | OX2 6TE OX2 6TF OX2 6TG |
| Garford Road | OX2 6UY |
| Hayfield Road | OX2 6TT OX2 6TU OX2 6TX |
| Kingston Road | OX2 6RL |
| Lark Hill | OX2 7DR |
| Lathbury Road | OX2 7AT OX2 7AU |
| Linton Road | OX2 6UG OX2 6UH OX2 6UL |
| Marston Ferry Road | OX2 7EA OX2 7EE OX2 7EF OX2 7XH |
| Moreton Road | OX2 7AX |
| Navigation Way | OX2 6XW |
| Northmoor Place | OX2 6XB |
| Northmoor Road | OX2 6UP OX2 6UR OX2 6UW |
| Polstead Road | OX2 6TN OX2 6TW |
| Rackham Place | OX2 7DJ |
| Rawlinson Road | OX2 6UE |
| Russell Court | OX2 6JH |
| Scholars Mews | OX2 7GY |
| St Margarets Road | OX2 6LD OX2 6RU OX2 6RX |
| Staverton Road | OX2 6XH OX2 6XJ |
| Stone Meadow | OX2 6TD OX2 6TQ |
| Thackley End | OX2 6LB |
| Woodstock Road | OX2 7AB OX2 7AD OX2 7AE OX2 7NA OX2 7NB OX2 7ND OX2 7NE OX2 7NF OX2 7NG OX2 7NQ OX2 7PF |
Transport near St Margarets
- FAQ
- Price Paid By Year
- Property Type Price
Frequently asked questions about St Margarets
What is the average price for a property for sale in St Margarets?
The average price for a property for sale in St Margarets is £1,149,935. This amount is 101% higher than the average price in Oxford. There are 642 property listings for sale in St Margarets.
What streets have the most expensive properties for sale in St Margarets?
The streets with the most expensive properties for sale in St Margarets are Chadlington Road at an average of £6,675,000, Belbroughton Road at an average of £3,572,100 and Garford Road at an average of £3,000,000.
What streets have the most affordable properties for sale in St Margarets?
The streets with the most affordable properties for sale in St Margarets are Rackham Place at an average of £192,250, Thackley End at an average of £395,000 and Ferry Pool Road at an average of £420,000.
Which train stations are available in or near St Margarets?
Some of the train stations available in or near St Margarets are Oxford, Oxford Parkway and Islip.
Property Price Paid in St Margarets by Year
The average sold property price by year was:
| Year | Average Sold Price | Price Change |
Sold Properties
|
|---|---|---|---|
| 2025 | £1,003,130 | -18% |
43 Properties |
| 2024 | £1,188,701 | -7% |
64 Properties |
| 2023 | £1,277,821 | 14% |
63 Properties |
| 2022 | £1,096,452 | -19% |
79 Properties |
| 2021 | £1,309,862 | 4% |
85 Properties |
| 2020 | £1,263,822 | -4% |
56 Properties |
| 2019 | £1,314,838 | 12% |
59 Properties |
| 2018 | £1,152,423 | 26% |
66 Properties |
| 2017 | £849,219 | -9% |
76 Properties |
| 2016 | £927,225 | -36% |
71 Properties |
| 2015 | £1,264,200 | 17% |
61 Properties |
| 2014 | £1,047,935 | 25% |
75 Properties |
| 2013 | £786,843 | -2% |
80 Properties |
| 2012 | £800,689 | -8% |
78 Properties |
| 2011 | £865,145 | 26% |
91 Properties |
| 2010 | £636,138 | 7% |
99 Properties |
| 2009 | £593,319 | -13% |
81 Properties |
| 2008 | £667,707 | 24% |
59 Properties |
| 2007 | £504,280 | 9% |
105 Properties |
| 2006 | £458,994 | -3% |
144 Properties |
| 2005 | £471,915 | 7% |
140 Properties |
| 2004 | £438,688 | -3% |
175 Properties |
| 2003 | £450,311 | 12% |
120 Properties |
| 2002 | £396,418 | 10% |
190 Properties |
| 2001 | £357,284 | 11% |
171 Properties |
| 2000 | £318,092 | 7% |
95 Properties |
| 1999 | £294,823 | 11% |
58 Properties |
| 1998 | £262,933 | 20% |
64 Properties |
| 1997 | £210,276 | 21% |
63 Properties |
| 1996 | £166,816 | 1% |
69 Properties |
| 1995 | £164,928 | - |
55 Properties |
Property Price per Property Type in St Margarets
Here you can find historic sold price data in order to help with your property search.
The average Property Paid Price for specific property types in the last three years are:
| Property Type | Average Sold Price | Sold Properties |
|---|---|---|
| Semi Detached House | £1,851,682.00 | 44 Semi Detached Houses |
| Detached House | £3,406,431.00 | 29 Detached Houses |
| Terraced House | £959,563.00 | 36 Terraced Houses |
| Flat | £510,922.00 | 140 Flats |

