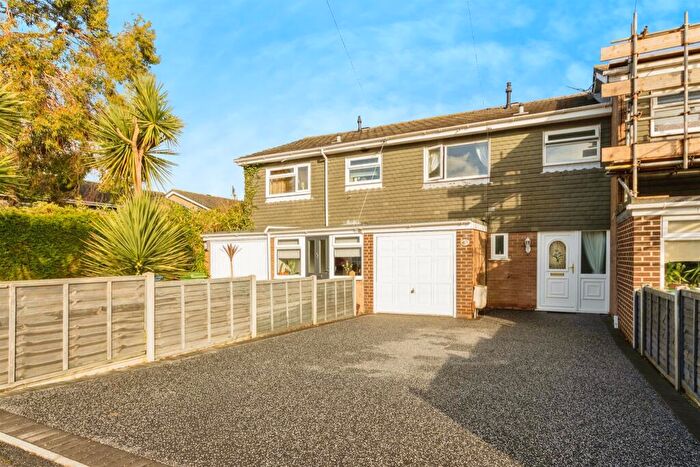
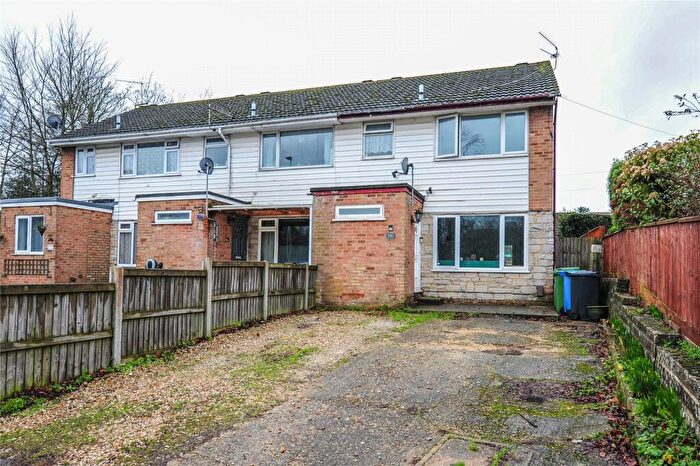
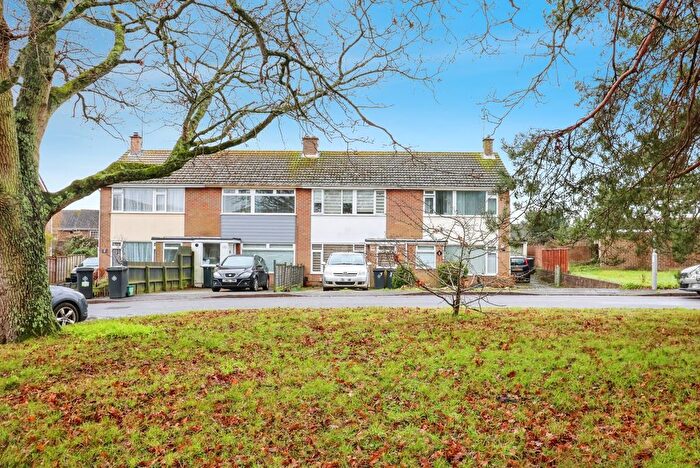
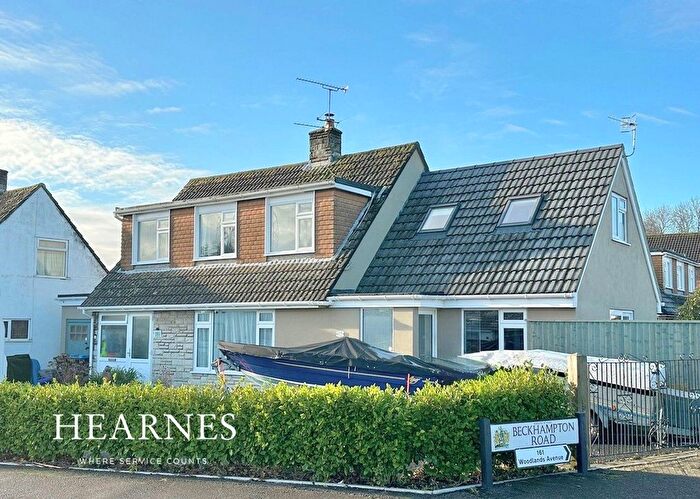
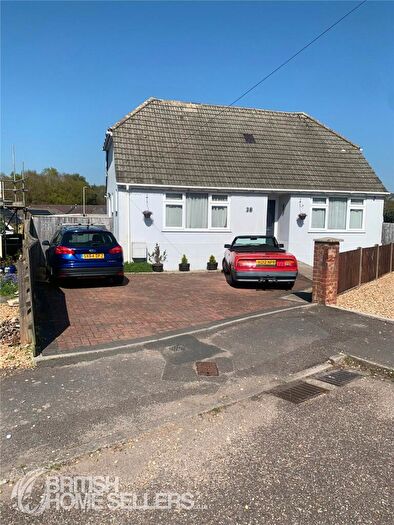
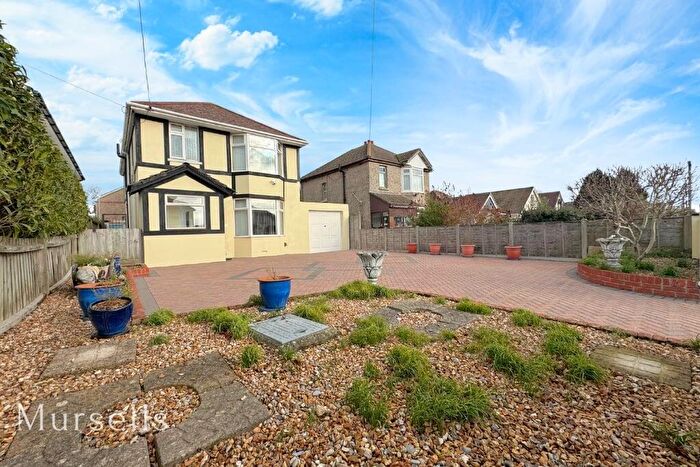
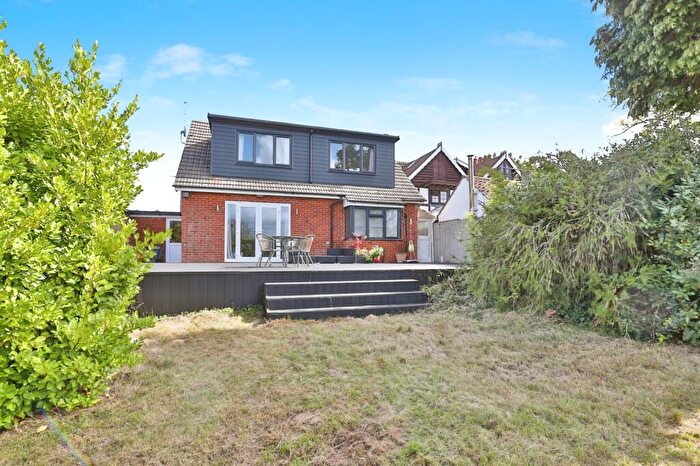
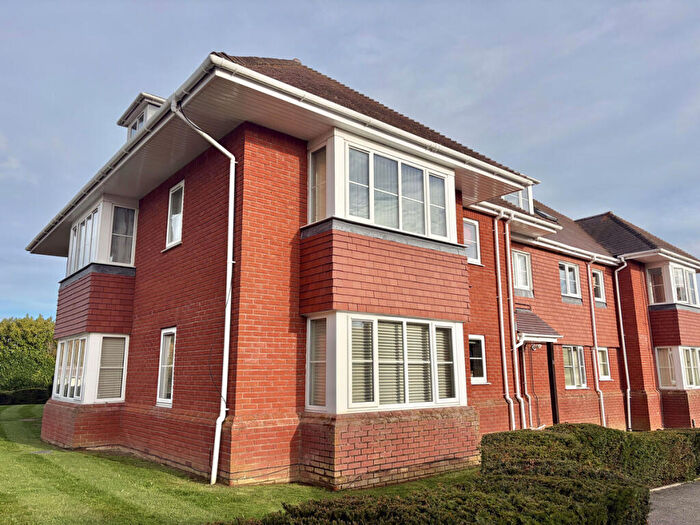
Houses for sale & to rent in Hamworthy West, Poole
House Prices in Hamworthy West
Properties in Hamworthy West have an average house price of £335,244.00 and had 243 Property Transactions within the last 3 years¹.
Hamworthy West is an area in Poole, Poole with 2,626 households², where the most expensive property was sold for £1,750,000.00.
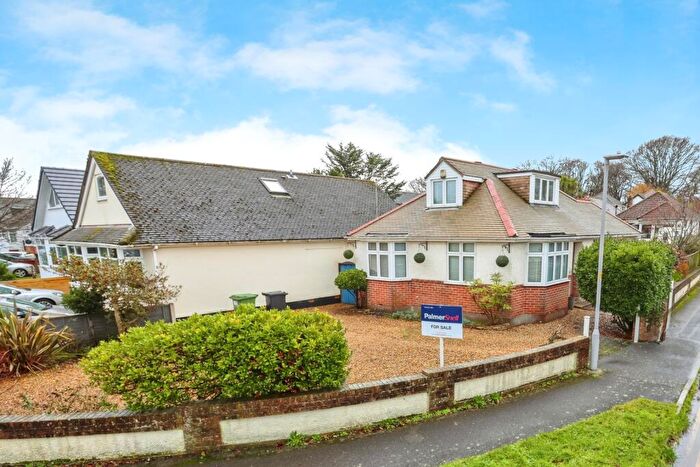
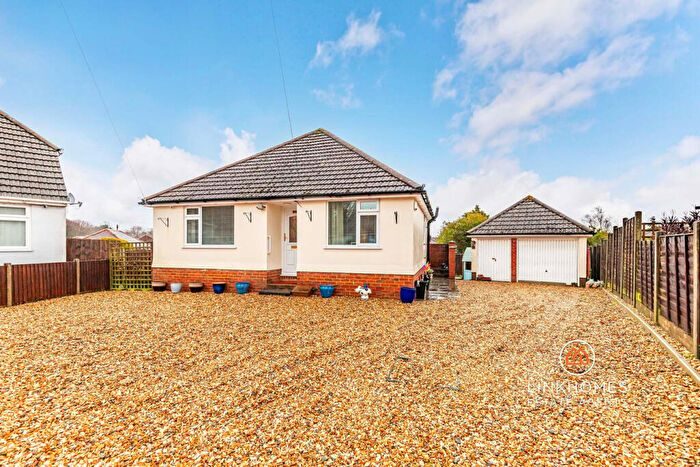
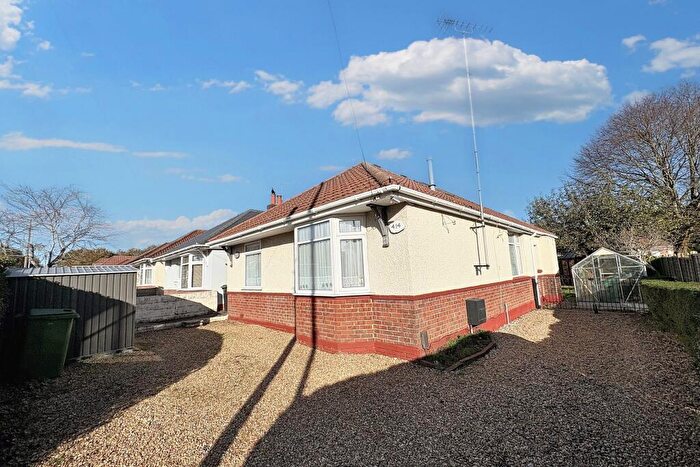
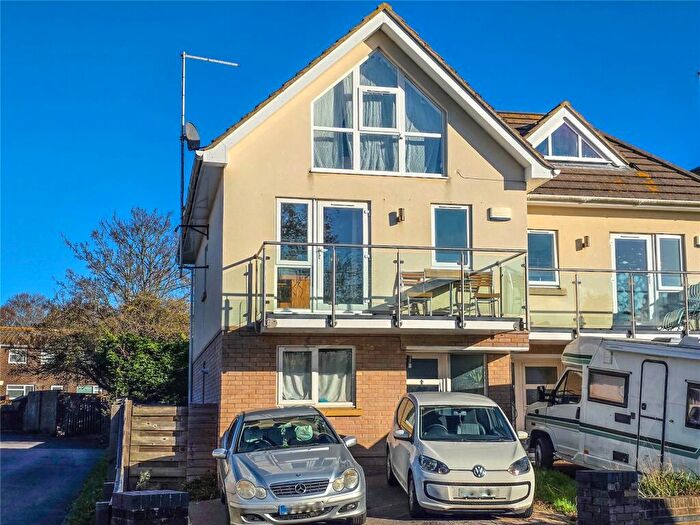
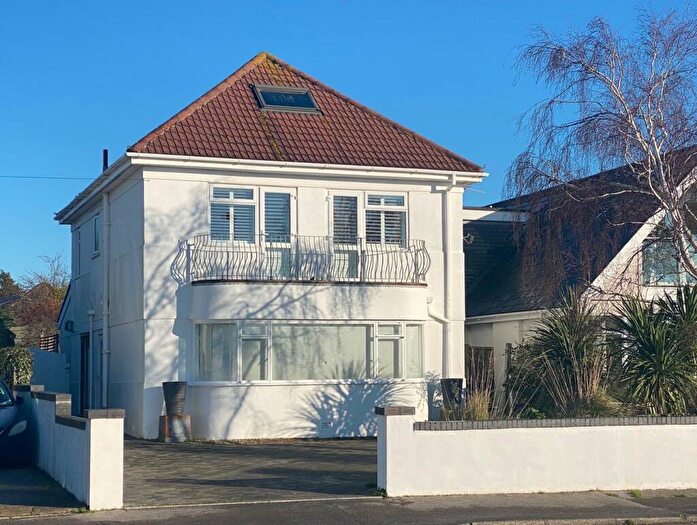
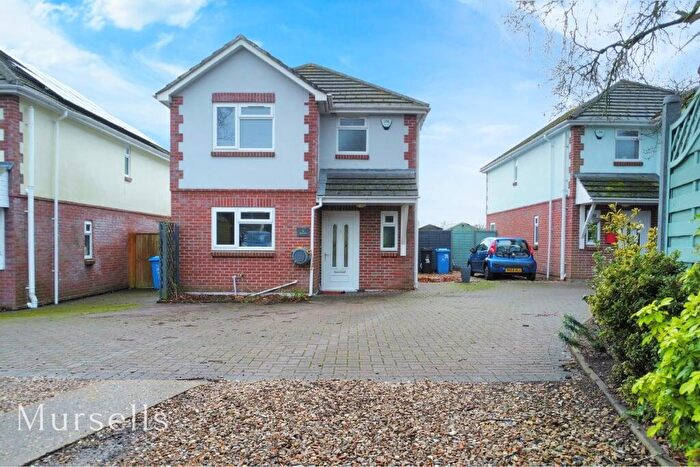
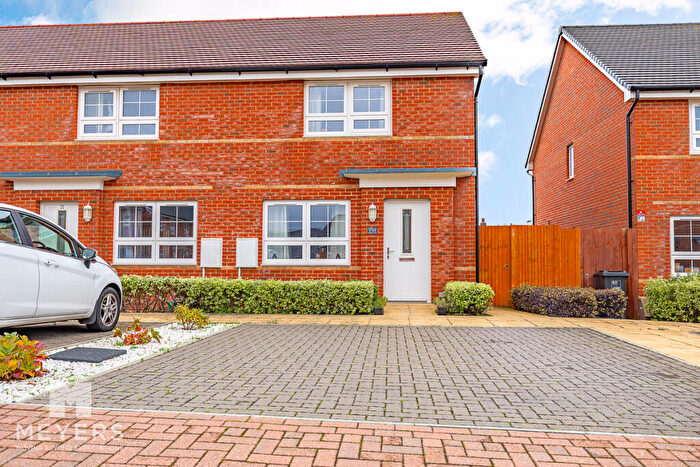
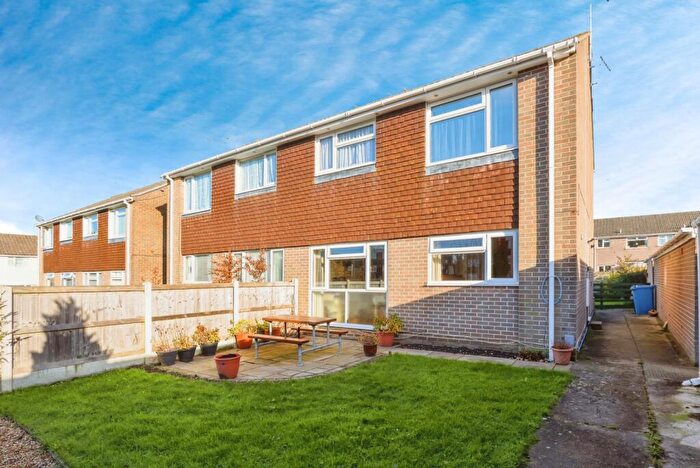
Properties for sale in Hamworthy West
Roads and Postcodes in Hamworthy West
Navigate through our locations to find the location of your next house in Hamworthy West, Poole for sale or to rent.
| Streets | Postcodes |
|---|---|
| Allens Road | BH16 5BU BH16 5BX BH16 5BY |
| Almer Road | BH15 4JR |
| Annet Close | BH15 4NW |
| Benjamin Road | BH15 4QU |
| Blandford Road | BH15 4JL BH15 4JN BH16 5BL BH16 5BN BH16 5BW BH16 5EB BH16 5EG |
| Border Road | BH16 5EE |
| Branksea Avenue | BH15 4DP BH15 4DW |
| Branksea Close | BH15 4DR |
| Carisbrooke Crescent | BH15 4LA BH15 4LB BH15 4LD |
| Carmel Close | BH15 4RD |
| Carters Avenue | BH15 4JT BH15 4JU |
| David Way | BH15 4QX |
| Dawkins Road | BH15 4JD BH15 4JW |
| Delilah Road | BH15 4NR |
| Egmont Road | BH16 5AJ BH16 5AL BH16 5AN BH16 5AP BH16 5AR BH16 5AW BH16 5BZ |
| Elijah Close | BH15 4QY |
| Factory Road | BH16 5SN |
| Fitzworth Avenue | BH16 5AY BH16 5AZ BH16 5BA |
| Foreland Road | BH16 5AT |
| Freshwater Drive | BH15 4HG BH15 4JE BH15 4JF BH15 4JG |
| Galloway Road | BH15 4JS BH15 4JX |
| Goathorn Close | BH16 5AD |
| Goliath Road | BH15 4NS |
| Hercules Road | BH15 4JA |
| Hoyal Road | BH15 4HY BH15 4HZ |
| Jacobs Road | BH15 4QZ |
| Joshua Close | BH15 4QW |
| Junction Road | BH16 5AB BH16 5DB BH16 5DD |
| Kangaw Place | BH15 4NH |
| Keysworth Road | BH16 5BH |
| Lake Avenue | BH15 4QP BH15 4QS |
| Lake Drive | BH15 4LP BH15 4LR BH15 4LS BH15 4LT BH15 4LU |
| Lake Road | BH15 4HD BH15 4LH BH15 4LL BH15 4LN BH15 4LQ BH15 4LW |
| Lulworth Crescent | BH15 4DL |
| Maryland Road | BH16 5BQ |
| Middlebere Crescent | BH16 5BG |
| Napier Road | BH15 4LX BH15 4NA |
| Nathan Gardens | BH15 4JZ |
| Old Kiln Road | BH16 5SH |
| Olivia Close | BH16 5DE |
| Patchins Road | BH16 5AS |
| Peverell Road | BH16 5AX |
| Purbeck Avenue | BH15 4DN |
| Redhorn Close | BH16 5BE |
| Reuben Drive | BH15 4RA |
| Ridgemount Gardens | BH15 4HE |
| Russell Gardens | BH16 5BF BH16 5DL |
| Samson Road | BH15 4NL BH15 4NN |
| Sandy Lane | BH16 5EH |
| Shipstal Close | BH16 5AU |
| Solomon Way | BH15 4RB |
| South Haven Close | BH16 5BJ |
| Turlin Road | BH16 5AE BH16 5AF BH16 5AG BH16 5AH BH16 5AQ |
| Upwey Avenue | BH15 4HU |
| Willow Close | BH16 5BS |
| Winspit Close | BH15 4HX |
Transport near Hamworthy West
- FAQ
- Price Paid By Year
- Property Type Price
Frequently asked questions about Hamworthy West
What is the average price for a property for sale in Hamworthy West?
The average price for a property for sale in Hamworthy West is £335,244. This amount is 22% lower than the average price in Poole. There are 1,481 property listings for sale in Hamworthy West.
What streets have the most expensive properties for sale in Hamworthy West?
The streets with the most expensive properties for sale in Hamworthy West are Branksea Avenue at an average of £858,666, Napier Road at an average of £552,142 and Lake Avenue at an average of £517,222.
What streets have the most affordable properties for sale in Hamworthy West?
The streets with the most affordable properties for sale in Hamworthy West are Dawkins Road at an average of £178,863, Kangaw Place at an average of £184,500 and Freshwater Drive at an average of £207,200.
Which train stations are available in or near Hamworthy West?
Some of the train stations available in or near Hamworthy West are Hamworthy, Poole and Holton Heath.
Property Price Paid in Hamworthy West by Year
The average sold property price by year was:
| Year | Average Sold Price | Price Change |
Sold Properties
|
|---|---|---|---|
| 2025 | £328,218 | -5% |
74 Properties |
| 2024 | £343,893 | 4% |
100 Properties |
| 2023 | £330,245 | -5% |
69 Properties |
| 2022 | £346,686 | -3% |
96 Properties |
| 2021 | £358,191 | 16% |
138 Properties |
| 2020 | £299,741 | 11% |
78 Properties |
| 2019 | £266,933 | -9% |
112 Properties |
| 2018 | £289,824 | 3% |
93 Properties |
| 2017 | £279,813 | -2% |
111 Properties |
| 2016 | £285,880 | 12% |
113 Properties |
| 2015 | £251,811 | 18% |
85 Properties |
| 2014 | £205,927 | 9% |
99 Properties |
| 2013 | £186,520 | 6% |
82 Properties |
| 2012 | £175,635 | -41% |
60 Properties |
| 2011 | £247,718 | 21% |
58 Properties |
| 2010 | £196,569 | -2% |
66 Properties |
| 2009 | £201,395 | 6% |
59 Properties |
| 2008 | £189,096 | -19% |
60 Properties |
| 2007 | £225,323 | 19% |
157 Properties |
| 2006 | £182,194 | -4% |
146 Properties |
| 2005 | £190,117 | 5% |
103 Properties |
| 2004 | £180,424 | 22% |
132 Properties |
| 2003 | £139,854 | 12% |
111 Properties |
| 2002 | £123,572 | 5% |
216 Properties |
| 2001 | £117,745 | 7% |
229 Properties |
| 2000 | £109,308 | 7% |
151 Properties |
| 1999 | £101,173 | 16% |
168 Properties |
| 1998 | £84,861 | -7% |
146 Properties |
| 1997 | £90,903 | 12% |
115 Properties |
| 1996 | £80,006 | 15% |
110 Properties |
| 1995 | £68,183 | - |
92 Properties |
Property Price per Property Type in Hamworthy West
Here you can find historic sold price data in order to help with your property search.
The average Property Paid Price for specific property types in the last three years are:
| Property Type | Average Sold Price | Sold Properties |
|---|---|---|
| Semi Detached House | £312,993.00 | 77 Semi Detached Houses |
| Detached House | £486,888.00 | 62 Detached Houses |
| Terraced House | £279,469.00 | 53 Terraced Houses |
| Flat | £242,450.00 | 51 Flats |

