
Houses for sale in Poole, Poole
House Prices in Poole
Properties in Poole have an average house price of £427k and had 6,199 Property Transactions within the last 3 years.¹
Poole is an area in Poole with 57,180 households², where the most expensive property was sold for £13.5M.
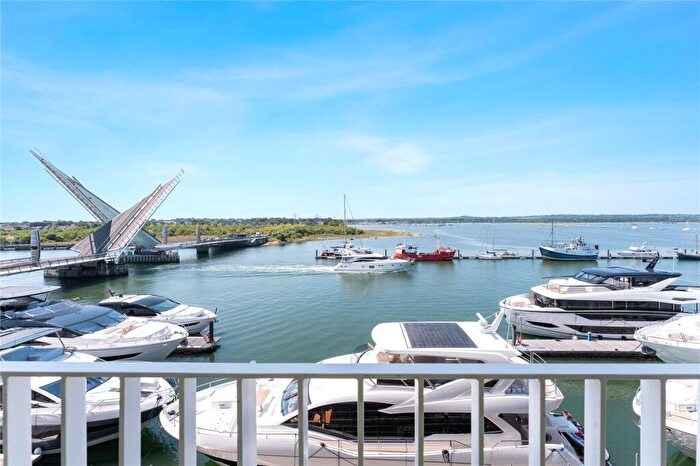
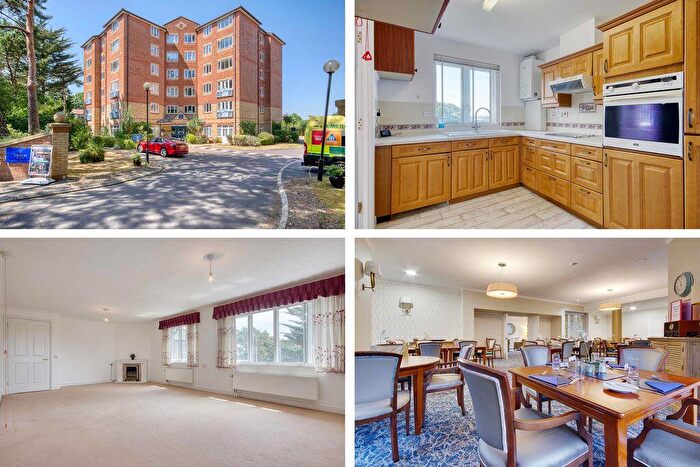
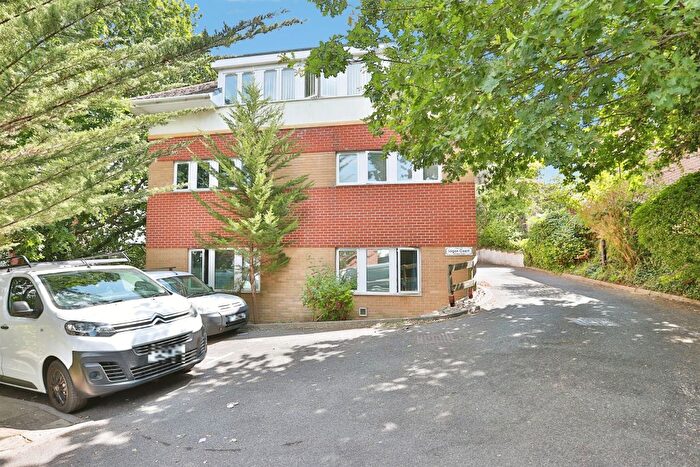
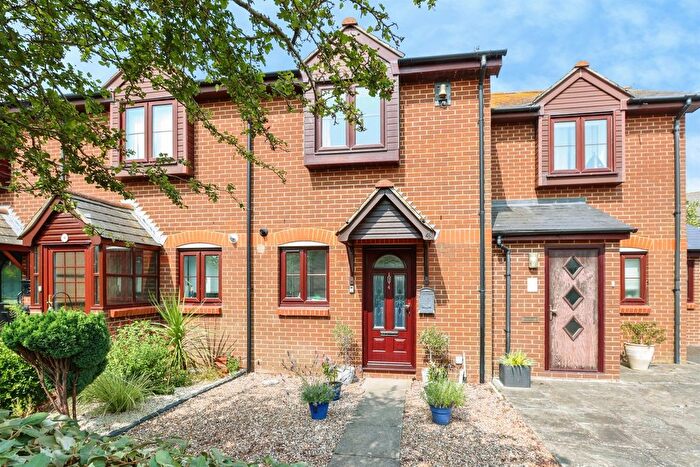
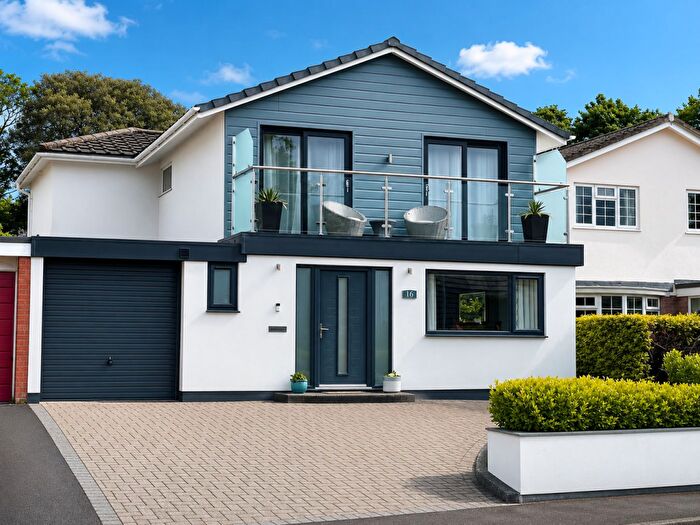
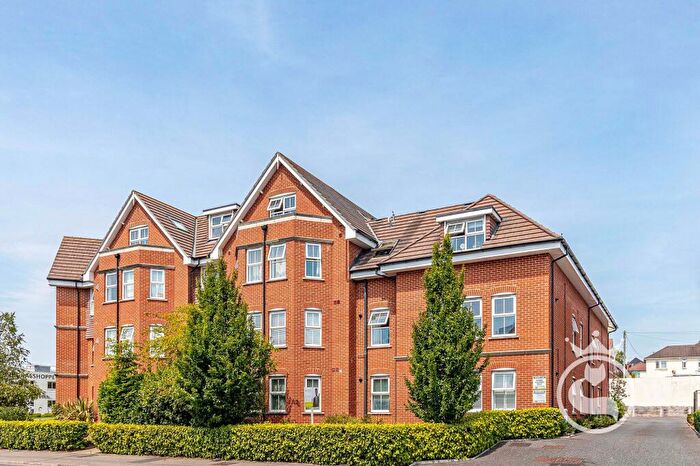
Properties for sale in Poole
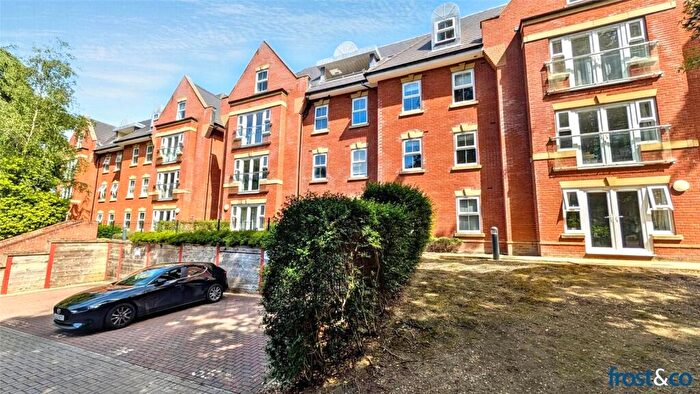
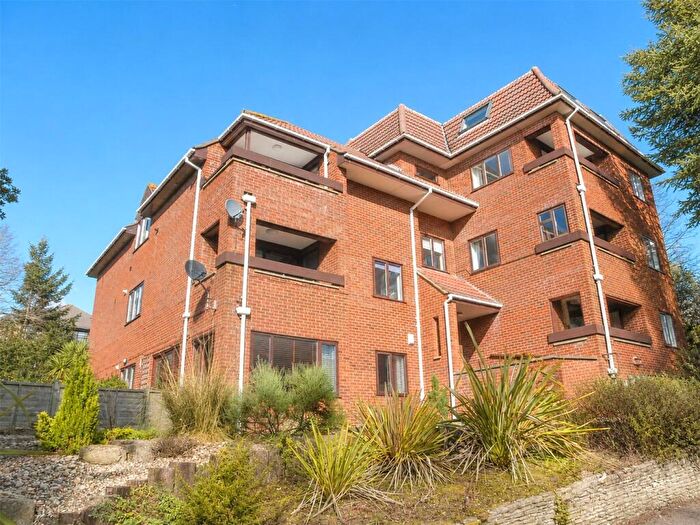
![]()
If you are looking to sell your house, let it out, or receive a property valuation, an expert can help you.
Click the button below to get started.


Neighbourhoods in Poole
Navigate through our locations to find the location of your next house in Poole, Poole for sale or to rent.
- South East Purbeck
- Alderney
- Branksome East
- Branksome West
- Broadstone
- Canford Cliffs
- Canford Heath East
- Canford Heath West
- Creekmoor
- Hamworthy East
- Hamworthy West
- Newtown
- Oakdale
- Parkstone
- Penn Hill
- Poole Town
- Westbourne & West Cliff
- Talbot & Branksome Woods
- Alderney & Bourne Valley
- Newtown & Heatherlands
- Canford Heath
- Hamworthy
- Bearwood & Merley
Property price trends in Poole
According to the latest Land Registry data, the average home in Poole sold for £404,223 in 2026. That figure comes from a substantial record of 89,032 sales logged over the past 31 years.
Prices have fallen back over the last three years. Compared with 2023, when the typical sale came in around £445,624, that's a fall of roughly 9.3%.
Looking back five years, average prices are down about 11.3% since 2021, a drop of around £51,336 in cash terms.
Zoom out to the past decade for the fuller picture. Back in 2016, homes here averaged £339,557, so the typical sold price has climbed about 19% since then, roughly 1.8% a year. Stretch the view to fifteen years and that annual pace edges up closer to 2.4%.
Frequently asked questions about Poole
What is the average price for a property for sale in Poole?
The average price for a property for sale in Poole is £427,412. This amount is 1% lower than the average price in Poole. There are more than 10,000 property listings for sale in Poole.
What locations have the most expensive properties for sale in Poole?
The locations with the most expensive properties for sale in Poole are Canford Cliffs at an average of £844,472, Penn Hill at an average of £674,327 and Parkstone at an average of £464,102.
What locations have the most affordable properties for sale in Poole?
The locations with the most affordable properties for sale in Poole are Hamworthy at an average of £271,313, Poole Town at an average of £275,575 and Canford Heath at an average of £287,898.
Which train stations are available in or near Poole?
Some of the train stations available in or near Poole are Parkstone, Poole and Branksome.
Property Price Paid in Poole by Year
The average sold property price by year was:
| Year | Average Sold Price | Price Change |
Sold Properties
|
|---|---|---|---|
| 2026 | £404,223 | -0,5% |
155 Properties |
| 2025 | £406,200 | -6% |
1,874 Properties |
| 2024 | £430,807 | -3% |
2,200 Properties |
| 2023 | £445,624 | -6% |
1,970 Properties |
| 2022 | £474,103 | 4% |
2,602 Properties |
| 2021 | £455,559 | 9% |
3,423 Properties |
| 2020 | £412,374 | 11% |
2,411 Properties |
| 2019 | £368,940 | 1% |
2,575 Properties |
| 2018 | £366,043 | 4% |
2,652 Properties |
| 2017 | £352,847 | 4% |
3,025 Properties |
Property Price per Property Type in Poole
Here you can find historic sold price data in order to help with your property search.
The average Property Paid Price for specific property types in the last three years are:
| Property Type | Average Sold Price | Sold Properties |
|---|---|---|
| Semi Detached House | £355,984.00 | 1,206 Semi Detached Houses |
| Terraced House | £315,921.00 | 950 Terraced Houses |
| Detached House | £636,962.00 | 2,054 Detached Houses |
| Flat | £307,575.00 | 1,989 Flats |
Transport in Poole
Please see below transportation links in this area:
