
Houses for sale & to rent in Poole Town, Poole
House Prices in Poole Town
Properties in Poole Town have an average house price of £284,908.00 and had 675 Property Transactions within the last 3 years¹.
Poole Town is an area in Poole, Poole with 5,034 households², where the most expensive property was sold for £1,532,075.00.
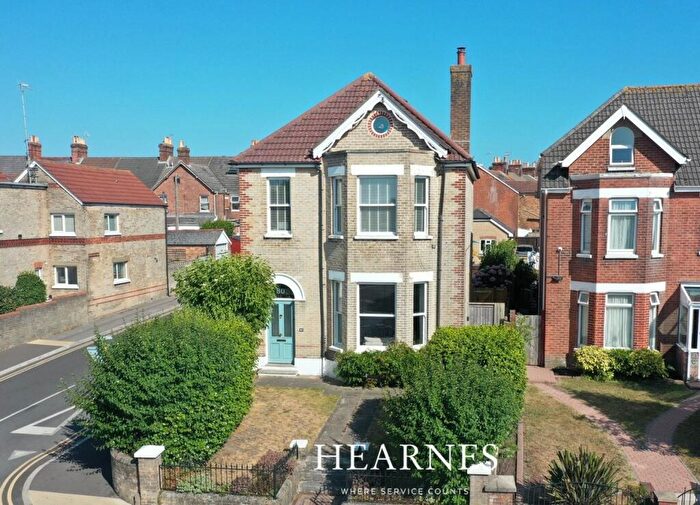
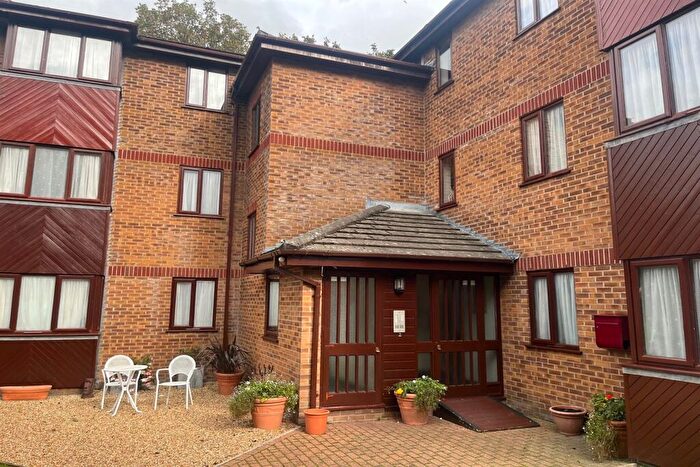
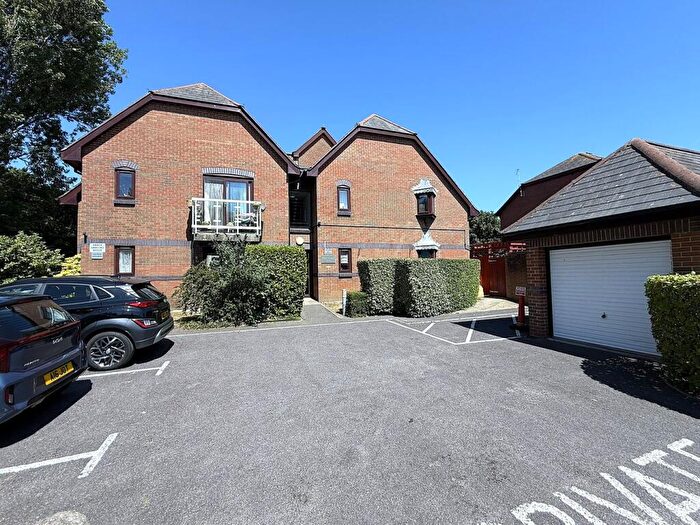
Properties for sale in Poole Town

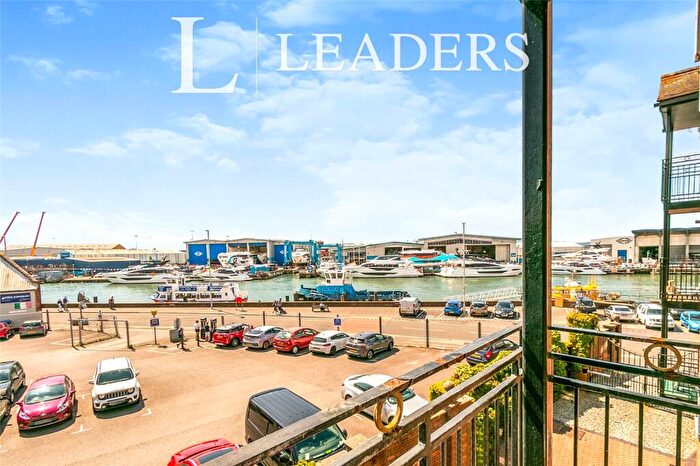


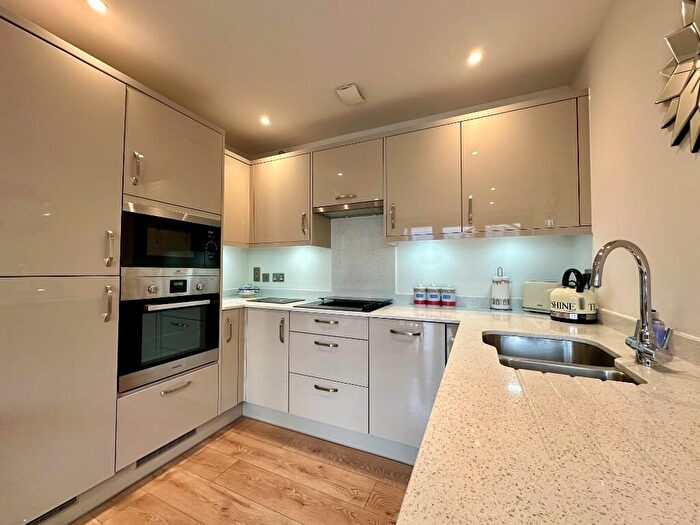
![]()
If you are looking to sell your house, let it out, or receive a property valuation, an expert can help you.
Click the button below to get started.


Roads and Postcodes in Poole Town
Navigate through our locations to find the location of your next house in Poole Town, Poole for sale or to rent.
Transport near Poole Town

- FAQ
- Price Paid By Year
- Property Type Price
Frequently asked questions about Poole Town
What is the average price for a property for sale in Poole Town?
The average price for a property for sale in Poole Town is £284,908. This amount is 37% lower than the average price in Poole. There are 2,323 property listings for sale in Poole Town.
What streets have the most expensive properties for sale in Poole Town?
The streets with the most expensive properties for sale in Poole Town are Kingland Road at an average of £952,415, Parish Road at an average of £646,000 and Churchfield Crescent at an average of £617,500.
What streets have the most affordable properties for sale in Poole Town?
The streets with the most affordable properties for sale in Poole Town are Seldown Road at an average of £103,592, Acorn Avenue at an average of £123,200 and Prosperous Street at an average of £137,500.
Which train stations are available in or near Poole Town?
Some of the train stations available in or near Poole Town are Poole, Parkstone and Hamworthy.
Property Price Paid in Poole Town by Year
The average sold property price by year was:
| Year | Average Sold Price | Price Change |
Sold Properties
|
|---|---|---|---|
| 2025 | £279,792 | 1% |
69 Properties |
| 2024 | £275,710 | -0,3% |
196 Properties |
| 2023 | £276,573 | -9% |
174 Properties |
| 2022 | £300,189 | 7% |
236 Properties |
| 2021 | £280,272 | 5% |
279 Properties |
| 2020 | £266,189 | 7% |
167 Properties |
| 2019 | £248,326 | -4% |
202 Properties |
| 2018 | £258,746 | -3% |
287 Properties |
| 2017 | £265,460 | 13% |
365 Properties |
| 2016 | £230,622 | 5% |
290 Properties |
| 2015 | £220,176 | 7% |
314 Properties |
| 2014 | £205,134 | 7% |
262 Properties |
| 2013 | £191,490 | -8% |
191 Properties |
| 2012 | £206,703 | 3% |
163 Properties |
| 2011 | £201,374 | -1% |
180 Properties |
| 2010 | £203,014 | 6% |
235 Properties |
| 2009 | £189,987 | -20% |
270 Properties |
| 2008 | £227,804 | 7% |
279 Properties |
| 2007 | £211,130 | 1% |
339 Properties |
| 2006 | £208,753 | -0,1% |
352 Properties |
| 2005 | £208,957 | -14% |
256 Properties |
| 2004 | £237,718 | 19% |
287 Properties |
| 2003 | £193,267 | 15% |
265 Properties |
| 2002 | £163,527 | 25% |
260 Properties |
| 2001 | £122,494 | 11% |
284 Properties |
| 2000 | £108,653 | 15% |
205 Properties |
| 1999 | £92,004 | 14% |
278 Properties |
| 1998 | £78,877 | 10% |
267 Properties |
| 1997 | £71,363 | 10% |
294 Properties |
| 1996 | £64,182 | -2% |
266 Properties |
| 1995 | £65,680 | - |
208 Properties |
Property Price per Property Type in Poole Town
Here you can find historic sold price data in order to help with your property search.
The average Property Paid Price for specific property types in the last three years are:
| Property Type | Average Sold Price | Sold Properties |
|---|---|---|
| Semi Detached House | £357,231.00 | 41 Semi Detached Houses |
| Detached House | £507,841.00 | 69 Detached Houses |
| Terraced House | £335,839.00 | 168 Terraced Houses |
| Flat | £217,140.00 | 397 Flats |