
Houses for sale & to rent in Poole, England
House Prices in Poole
Properties in Poole have
an average house price of
£434k
and had 7,347 Property Transactions
within the last 3 years.¹
Poole is a location in
England with
63,302 households², where the most expensive property was sold for £13.5M.
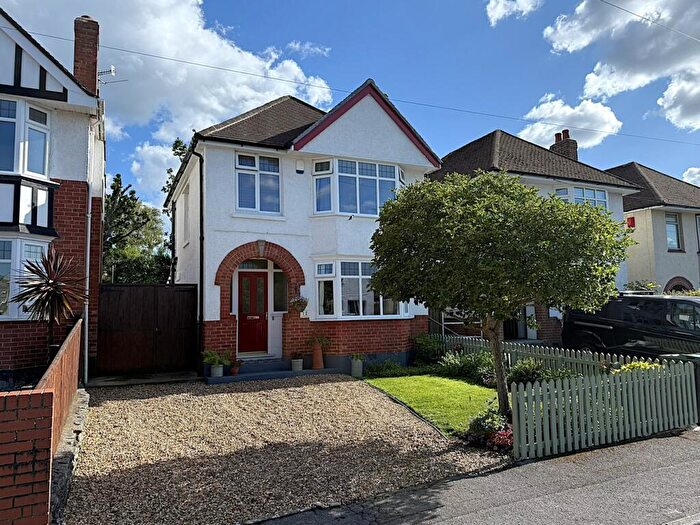
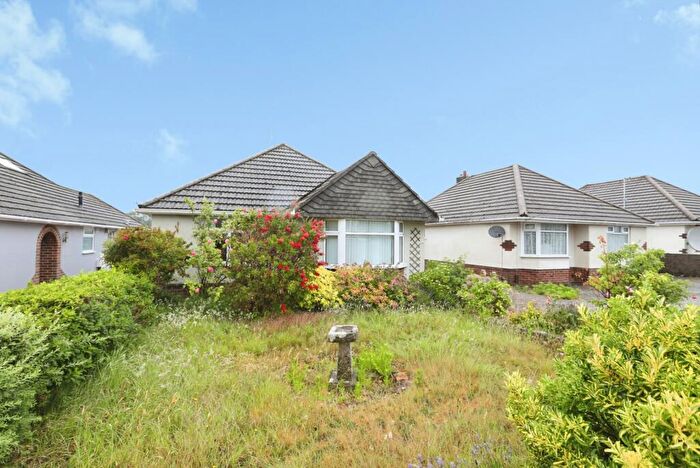
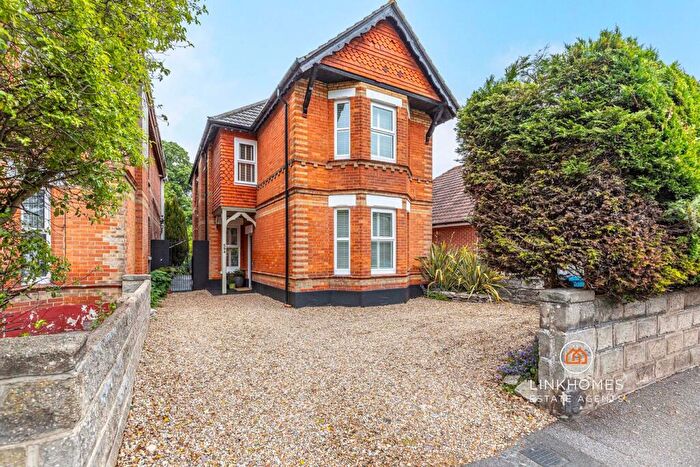
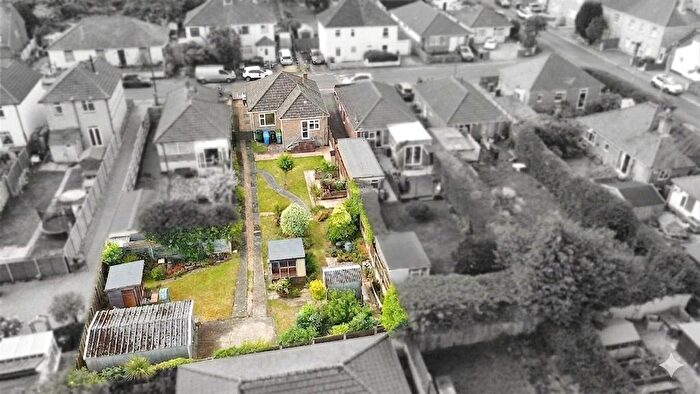
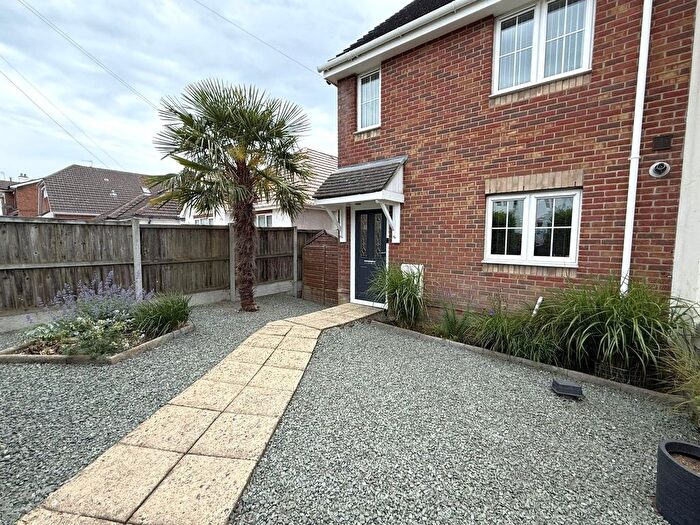
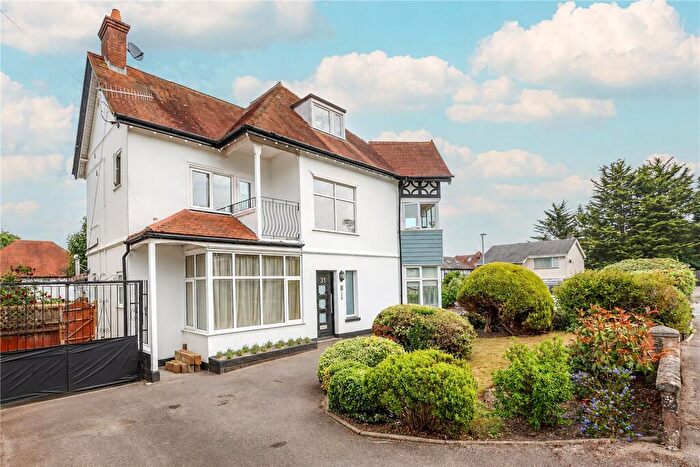
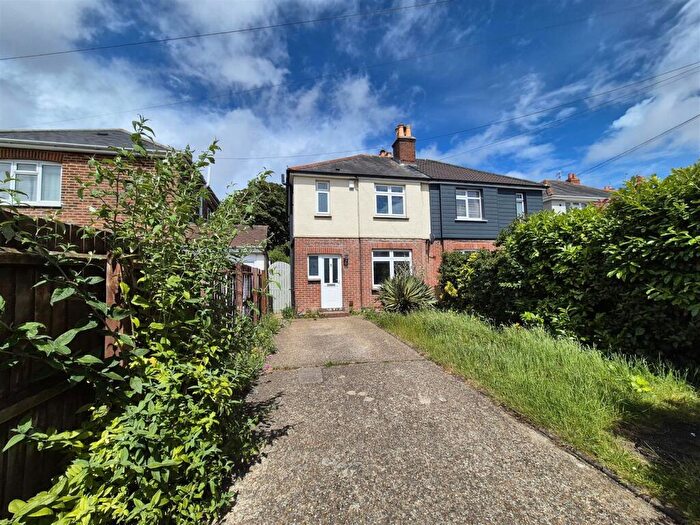
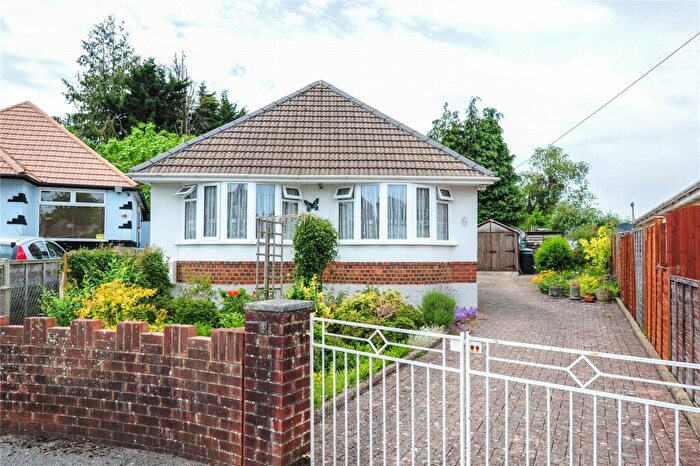
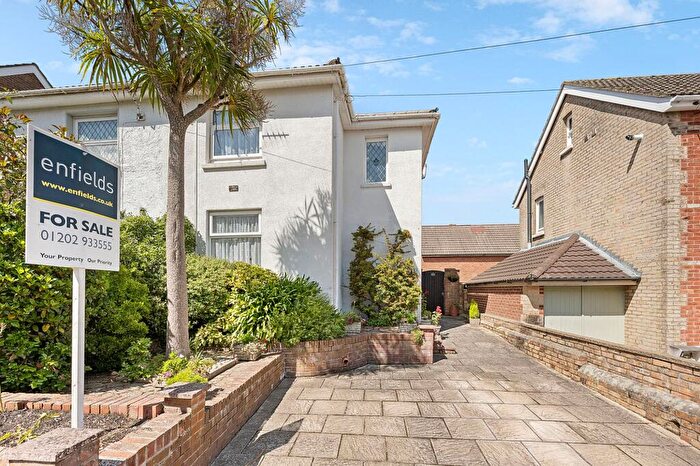
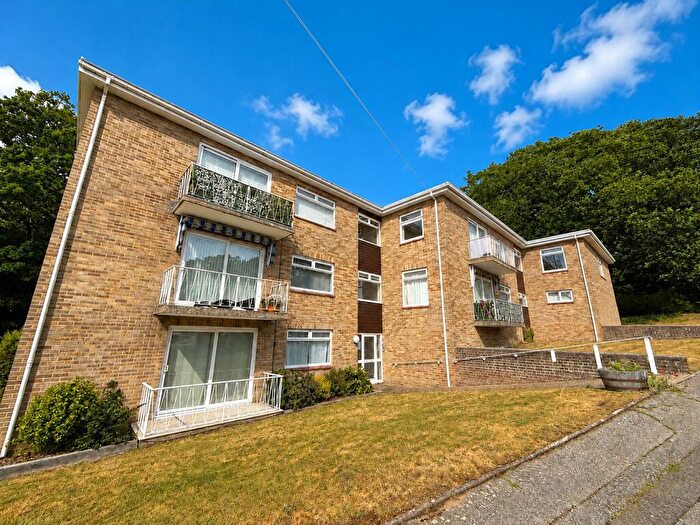
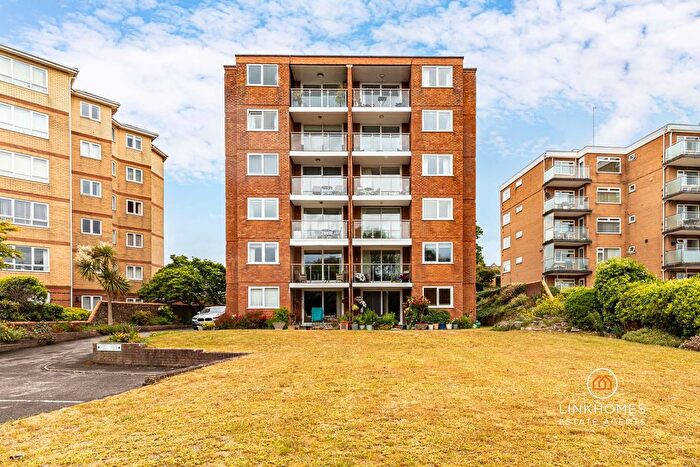
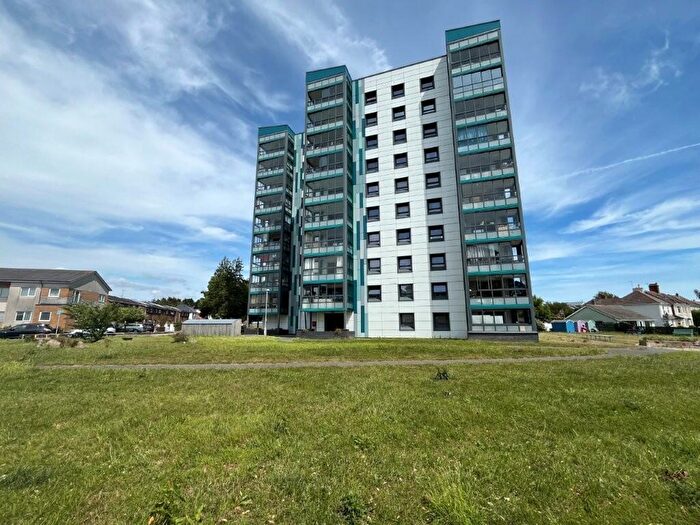
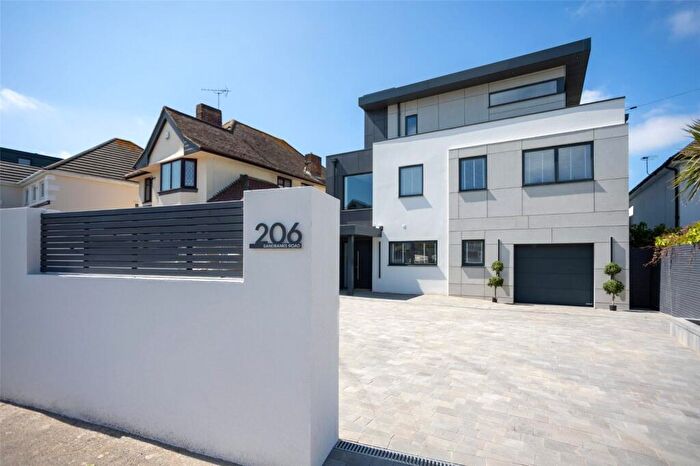
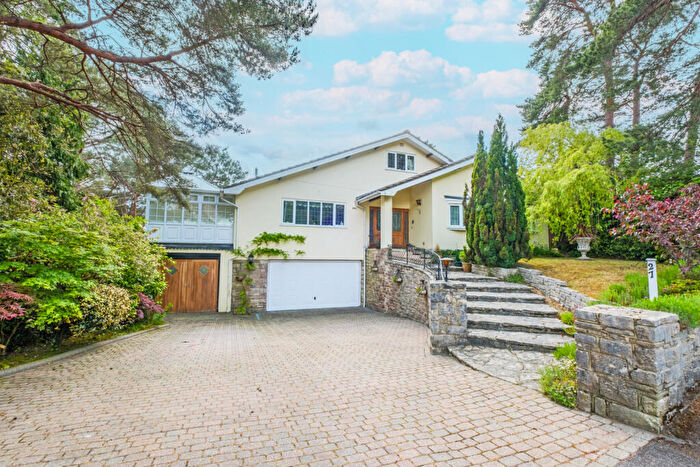
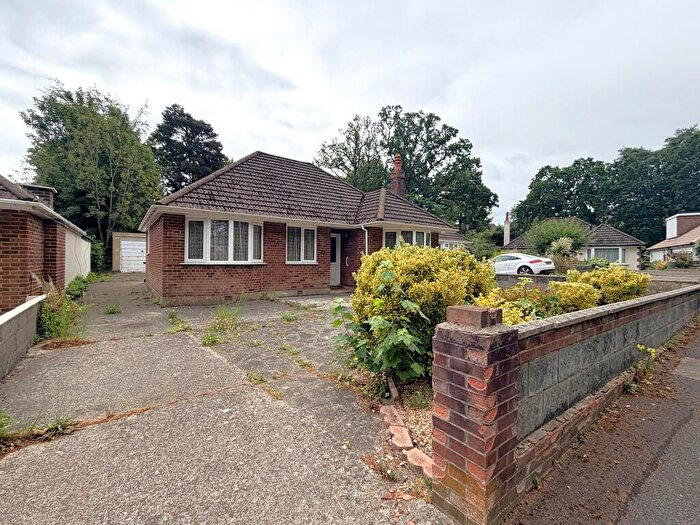
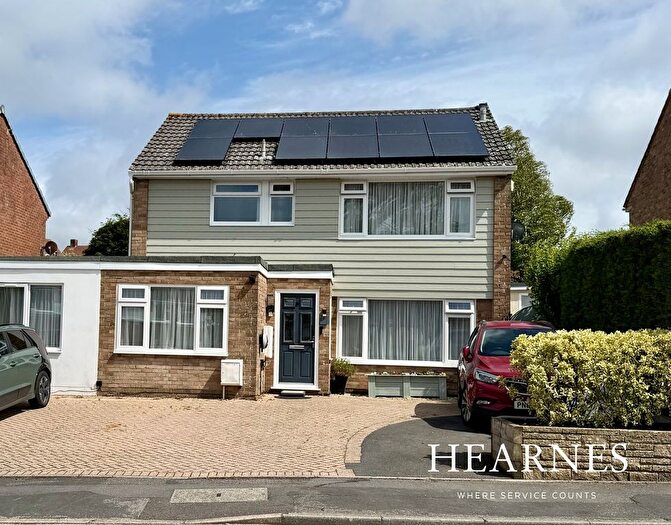
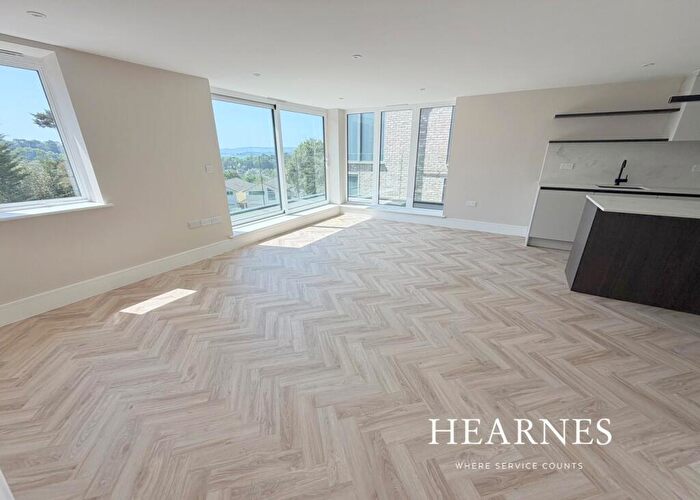
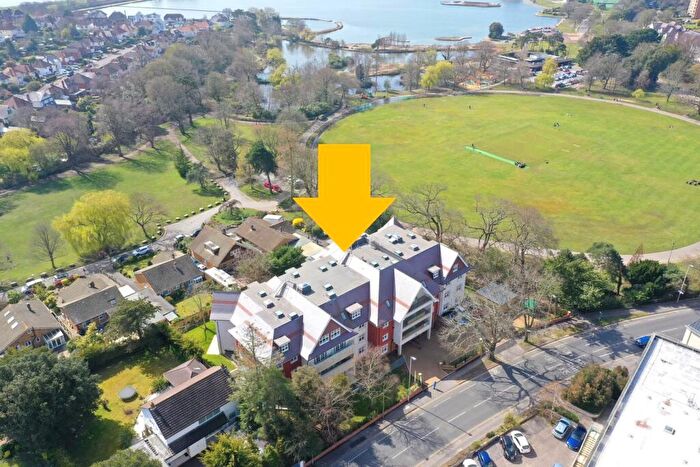
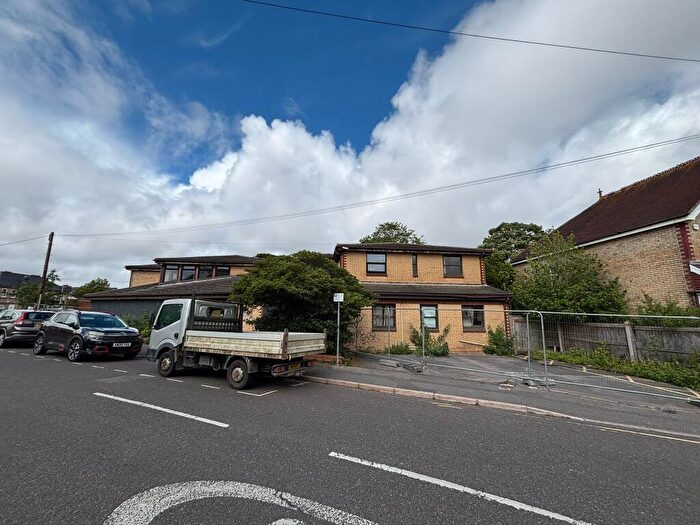
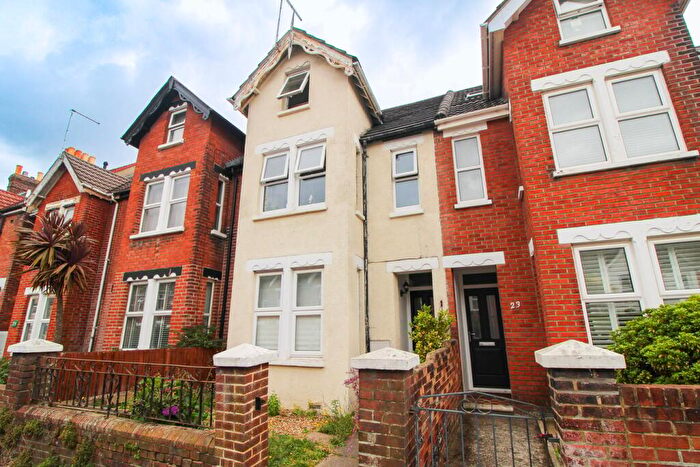
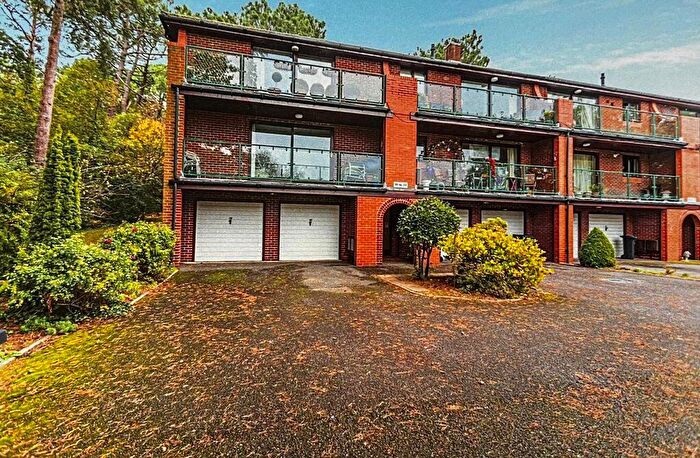
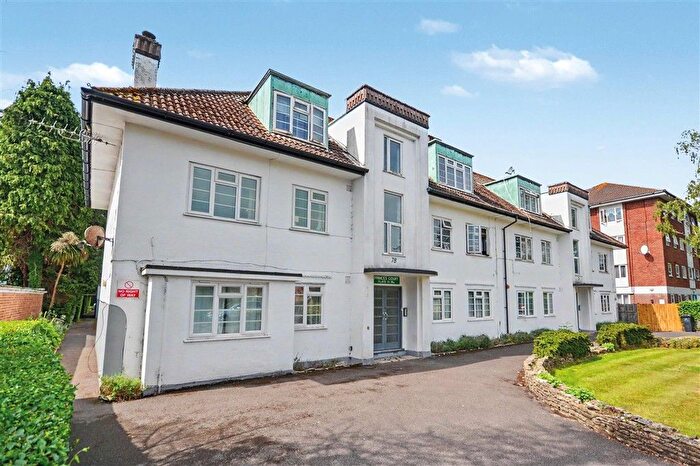
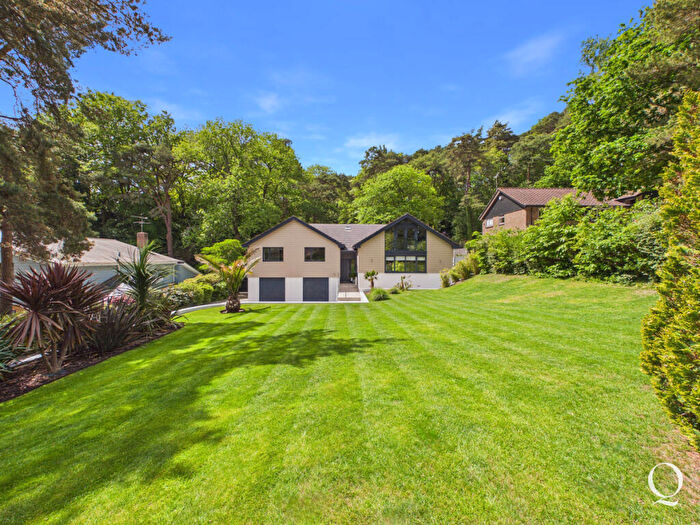
Properties for sale in Poole
![]()
If you are looking to sell your house, let it out, or receive a property valuation, an expert can help you.
Click the button below to get started.

Towns in Poole
Navigate through our locations to find the location of your next house in Poole, England for sale or to rent.
Transport in Poole
Please see below transportation links in this area:

- FAQ
- Price Paid By Year
- Property Type Price
Frequently asked questions about Poole
What is the average price for a property for sale in Poole?
The average price for a property for sale in Poole is £433,791. This amount is 21% higher than the average price in England. There are more than 10,000 property listings for sale in Poole.
What locations have the most expensive properties for sale in Poole?
The locations with the most expensive properties for sale in Poole are Broadstone at an average of £521,109 and Wimborne at an average of £483,700.
What locations have the most affordable properties for sale in Poole?
The locations with the most affordable properties for sale in Poole are Bournemouth at an average of £353,279 and Poole at an average of £427,412.
Which train stations are available in or near Poole?
Some of the train stations available in or near Poole are Parkstone, Poole and Branksome.
Property Price Paid in Poole by Year
The average sold property price by year was:
| Year | Average Sold Price | Price Change |
Sold Properties
|
|---|---|---|---|
| 2026 | £408,697 | -2% |
334 Properties |
| 2025 | £417,770 | -4% |
2,248 Properties |
| 2024 | £434,782 | -4% |
2,515 Properties |
| 2023 | £452,413 | -5% |
2,250 Properties |
| 2022 | £475,462 | 4% |
2,944 Properties |
| 2021 | £454,729 | 9% |
3,850 Properties |
| 2020 | £411,970 | 10% |
2,719 Properties |
| 2019 | £372,050 | 1% |
2,937 Properties |
| 2018 | £369,522 | 4% |
3,038 Properties |
| 2017 | £356,421 | 4% |
3,375 Properties |
| 2016 | £343,280 | 3% |
3,309 Properties |
| 2015 | £332,141 | 6% |
3,291 Properties |
| 2014 | £311,353 | 8% |
3,248 Properties |
| 2013 | £287,837 | 2% |
2,667 Properties |
| 2012 | £283,209 | -0,4% |
2,166 Properties |
| 2011 | £284,276 | 4% |
2,196 Properties |
| 2010 | £273,801 | 2% |
2,317 Properties |
| 2009 | £266,963 | -7% |
2,399 Properties |
| 2008 | £286,496 | -1% |
2,088 Properties |
| 2007 | £288,349 | 8% |
4,228 Properties |
| 2006 | £264,093 | 6% |
4,349 Properties |
| 2005 | £248,392 | 6% |
3,394 Properties |
| 2004 | £232,891 | 9% |
3,830 Properties |
| 2003 | £210,903 | 15% |
3,829 Properties |
| 2002 | £179,656 | 18% |
4,463 Properties |
| 2001 | £146,845 | 5% |
4,488 Properties |
| 2000 | £138,920 | 16% |
3,808 Properties |
| 1999 | £116,298 | 15% |
4,406 Properties |
| 1998 | £99,025 | 9% |
3,859 Properties |
| 1997 | £89,765 | 13% |
4,189 Properties |
| 1996 | £78,493 | 3% |
3,710 Properties |
| 1995 | £75,897 | - |
2,938 Properties |
Property Price per Property Type in Poole
Here you can find historic sold price data in order to help with your property search.
The average Property Paid Price for specific property types in the last three years are:
| Property Type | Average Sold Price | Sold Properties |
|---|---|---|
| Semi Detached House | £357,482.00 | 1,368 Semi Detached Houses |
| Terraced House | £316,337.00 | 1,059 Terraced Houses |
| Detached House | £617,467.00 | 2,764 Detached Houses |
| Flat | £304,427.00 | 2,156 Flats |