
Houses for sale in Oakdale, Poole
House Prices in Oakdale
Properties in Oakdale have an average house price of £366k and had 461 Property Transactions within the last 3 years¹.
Oakdale is an area in Poole, Poole with 4,853 households², where the most expensive property was sold for £750k.
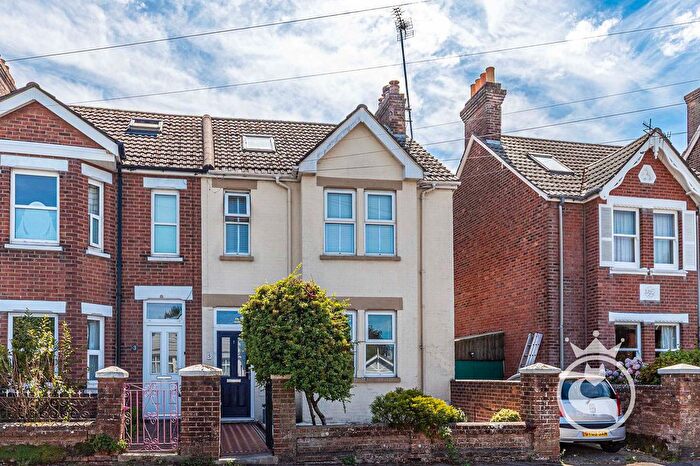
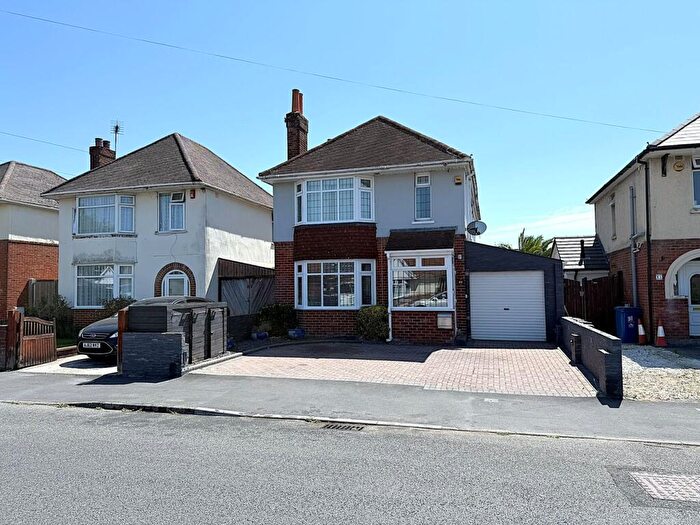
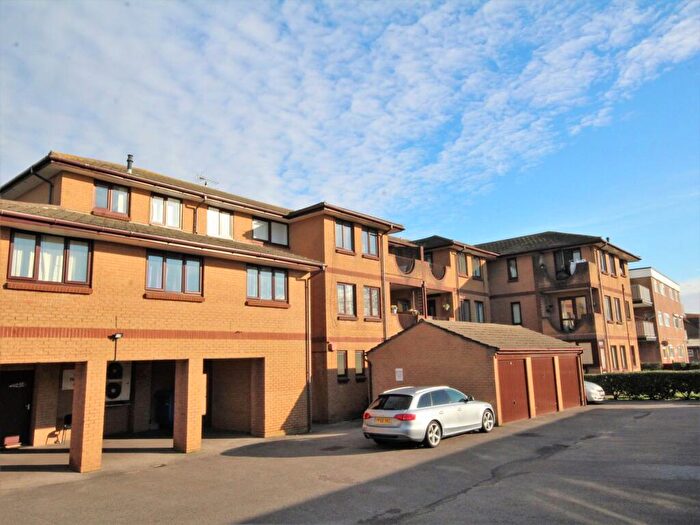
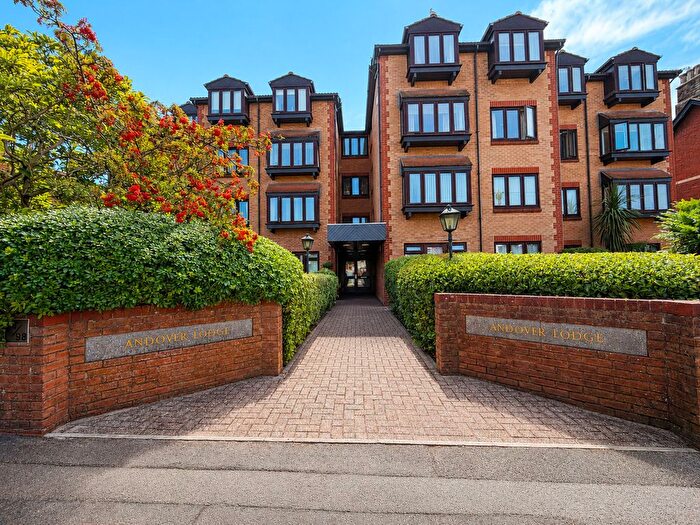
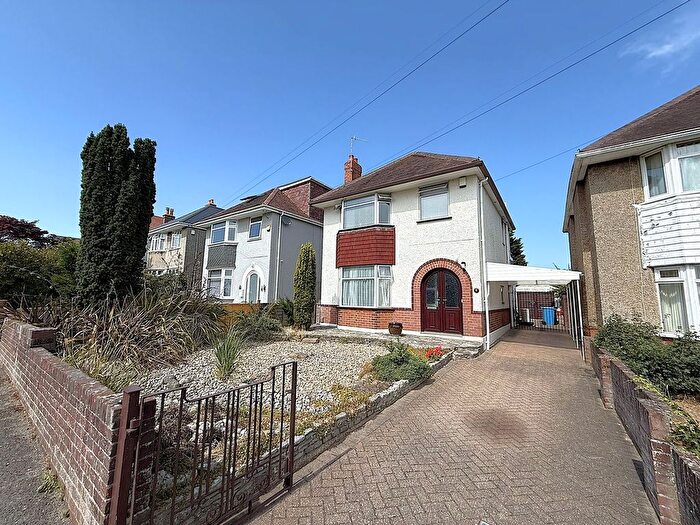
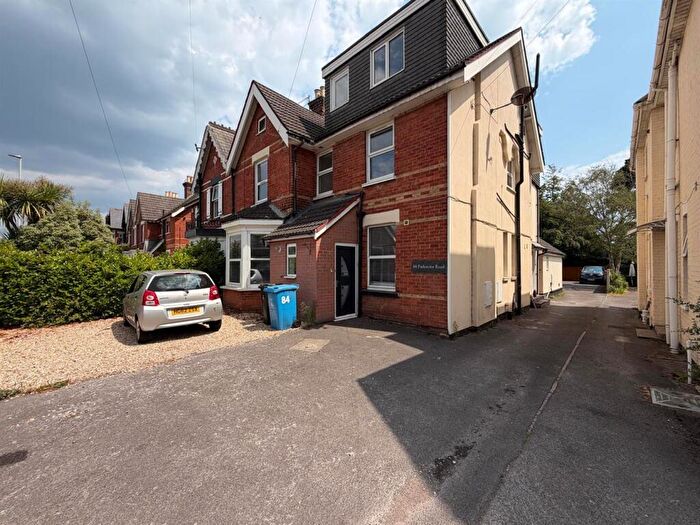
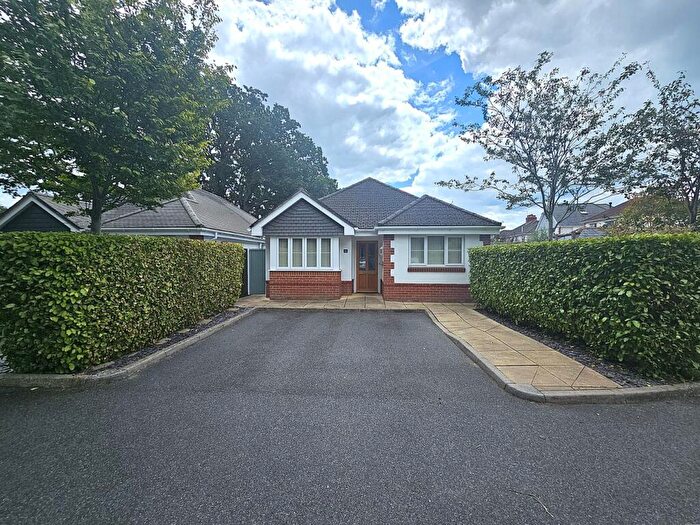
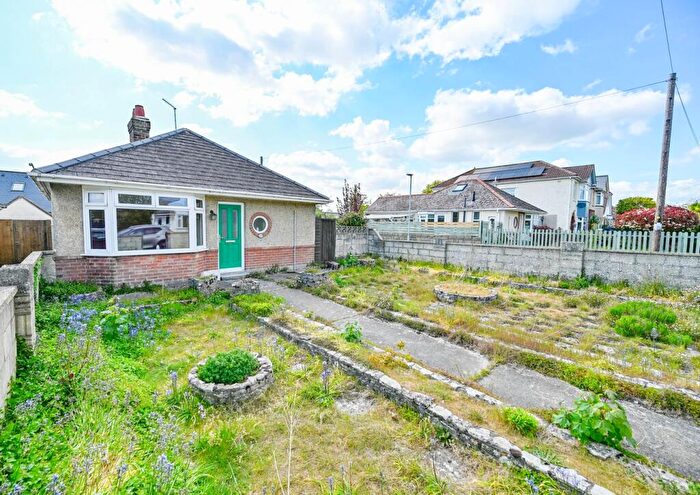
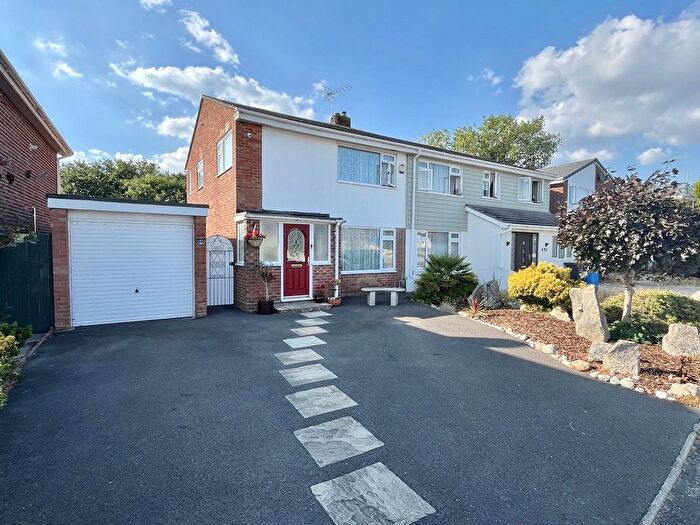
Properties for sale in Oakdale
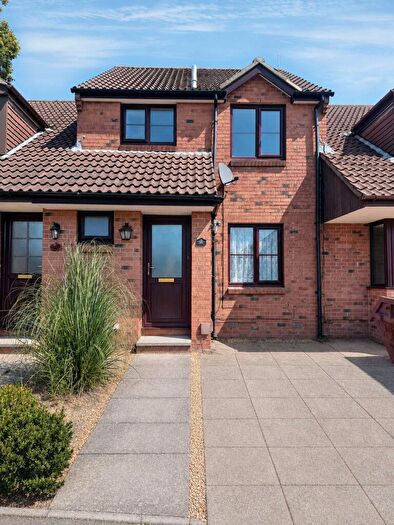
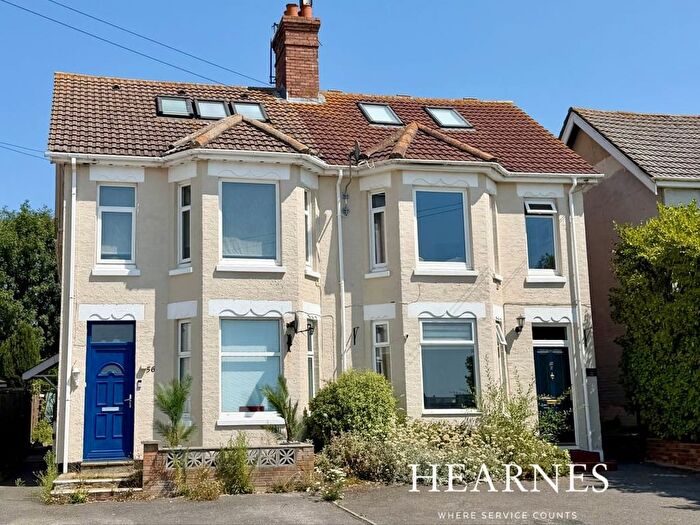
![]()
If you are looking to sell your house, let it out, or receive a property valuation, an expert can help you.
Click the button below to get started.

Roads and Postcodes in Oakdale
Navigate through our locations to find the location of your next house in Oakdale, Poole for sale or to rent.
Property price trends in Oakdale
According to the latest Land Registry data, the average home in Oakdale sold for £388,927 in 2026. That figure comes from a substantial record of 6,209 sales logged over the past 31 years.
Prices have continued to climb over the last three years. Compared with 2023, when the typical sale came in around £354,488, that's a rise of roughly 9.7%.
Looking back five years, average prices are up about 14.3% since 2021, a gain of around £48,713 in cash terms.
Zoom out to the past decade for the fuller picture. Back in 2016, homes here averaged £262,205, so the typical sold price has climbed about 48.3% since then, roughly 4% a year. Stretch the view to fifteen years and that annual pace holds at about 4.2%.
Frequently asked questions about Oakdale
What is the average price for a property for sale in Oakdale?
The average price for a property for sale in Oakdale is £365,617. This amount is 14% lower than the average price in Poole. There are 2,196 property listings for sale in Oakdale.
What streets have the most expensive properties for sale in Oakdale?
The streets with the most expensive properties for sale in Oakdale are Erena Drive at an average of £634,000, Gorsehill Road at an average of £511,490 and Curlieu Road at an average of £493,000.
What streets have the most affordable properties for sale in Oakdale?
The streets with the most affordable properties for sale in Oakdale are Tatnam Crescent at an average of £70,000, Connell Road at an average of £137,500 and Linthorpe Road at an average of £175,000.
Which train stations are available in or near Oakdale?
Some of the train stations available in or near Oakdale are Poole, Parkstone and Hamworthy.
Property Price Paid in Oakdale by Year
The average sold property price by year was:
| Year | Average Sold Price | Price Change |
Sold Properties
|
|---|---|---|---|
| 2026 | £388,927 | 5% |
18 Properties |
| 2025 | £369,736 | 0,3% |
148 Properties |
| 2024 | £368,487 | 4% |
161 Properties |
| 2023 | £354,488 | 1% |
134 Properties |
| 2022 | £350,429 | 3% |
186 Properties |
| 2021 | £340,214 | 10% |
231 Properties |
| 2020 | £307,158 | 0,5% |
182 Properties |
| 2019 | £305,748 | 2% |
214 Properties |
| 2018 | £298,432 | 4% |
186 Properties |
| 2017 | £286,769 | 9% |
214 Properties |
Property Price per Property Type in Oakdale
Here you can find historic sold price data in order to help with your property search.
The average Property Paid Price for specific property types in the last three years are:
| Property Type | Average Sold Price | Sold Properties |
|---|---|---|
| Flat | £187,535.00 | 56 Flats |
| Semi Detached House | £342,692.00 | 113 Semi Detached Houses |
| Detached House | £423,780.00 | 254 Detached Houses |
| Terraced House | £307,450.00 | 38 Terraced Houses |
