Houses for sale & to rent in Roding, London
House Prices in Roding
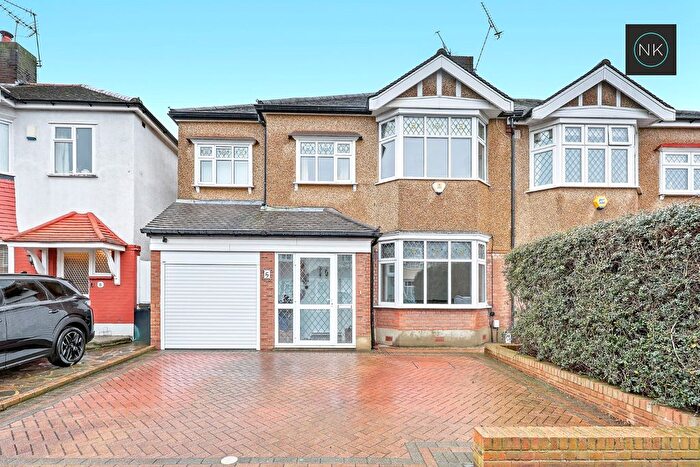
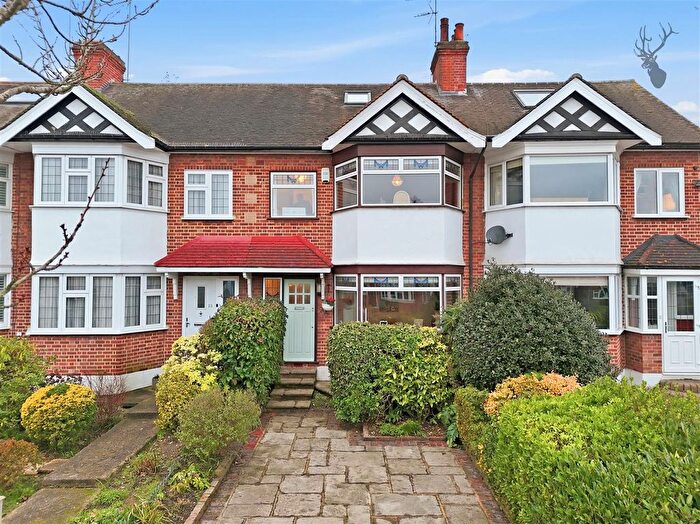
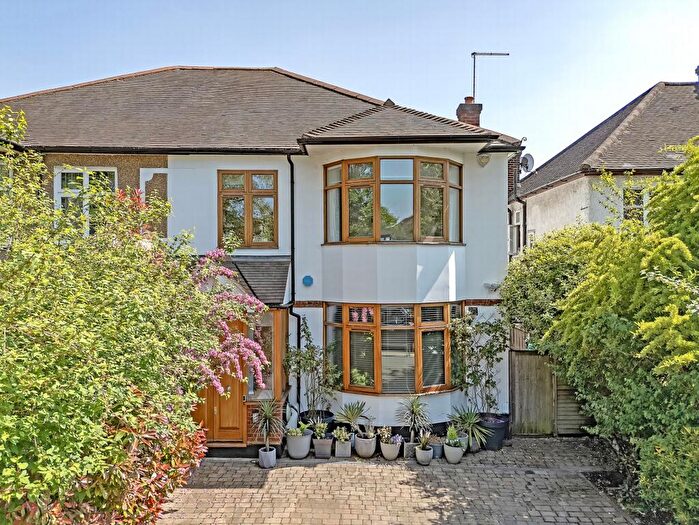
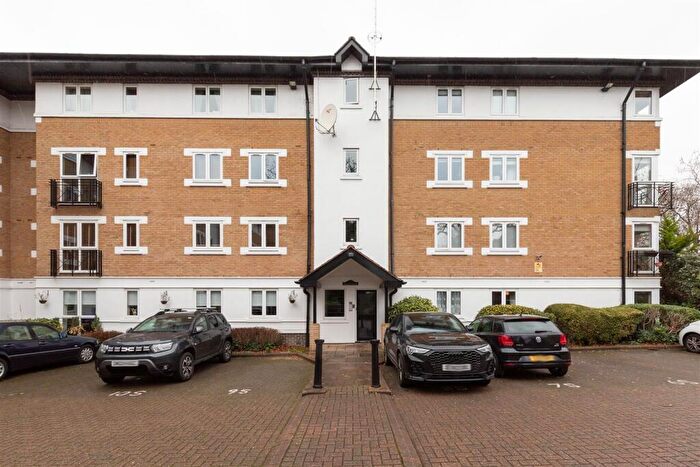
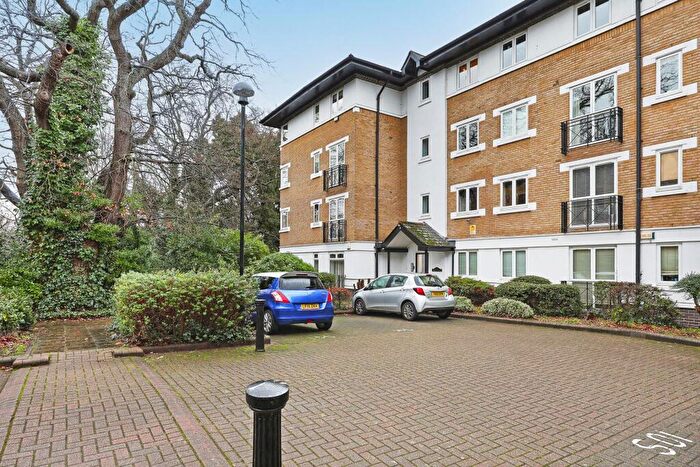
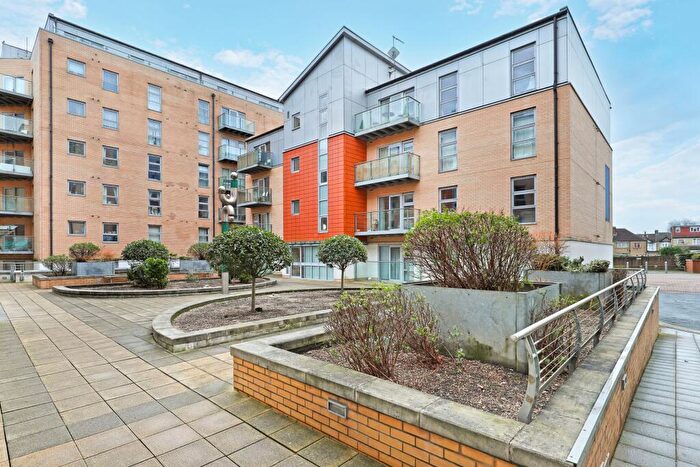
Properties in this part of Roding within London have an average house price of £602,363.00 and had 260 Property Transactions within the last 3 years¹. This area has 2,730 households² , where the most expensive property was sold for £1,382,000.00.
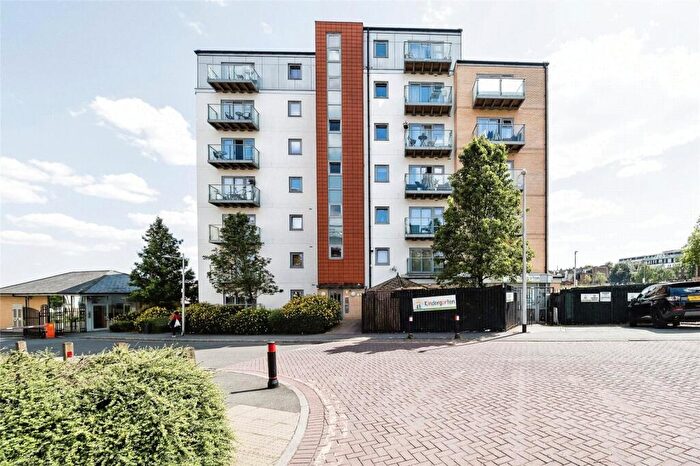
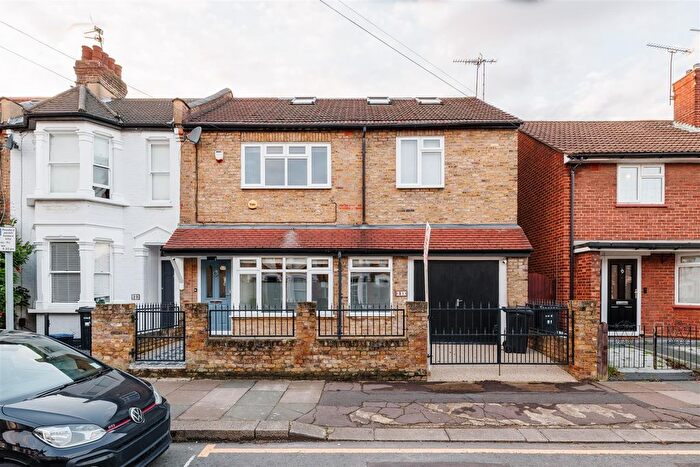
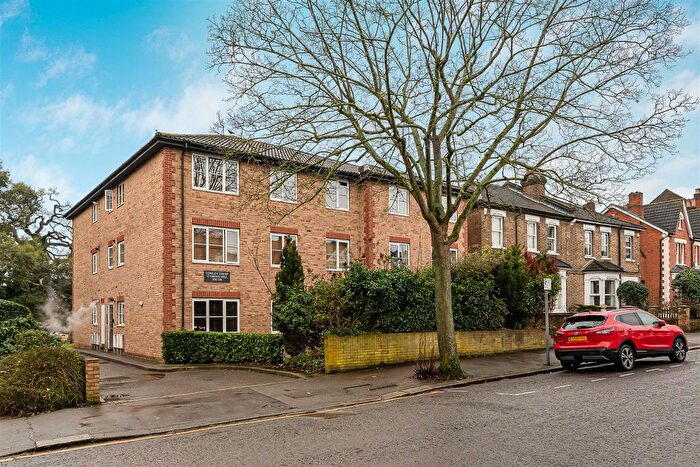
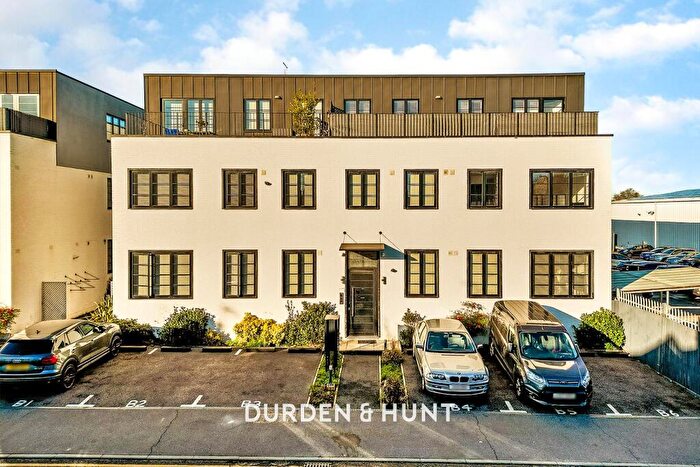
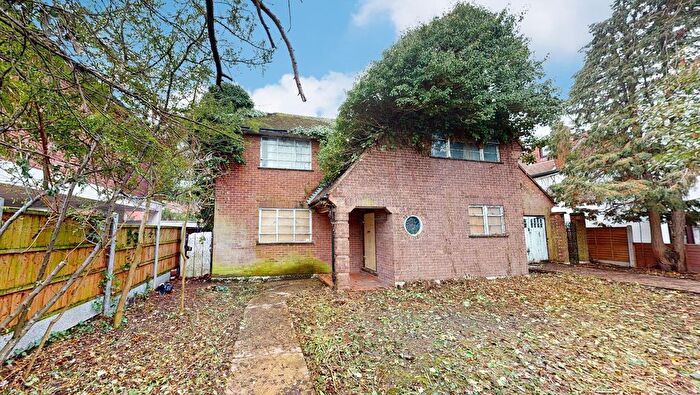
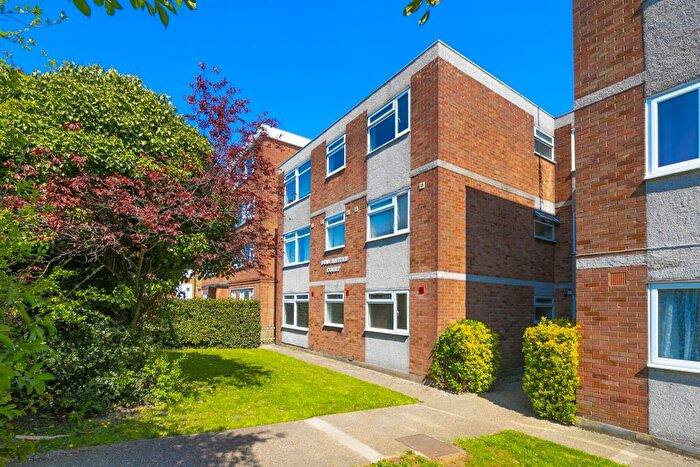
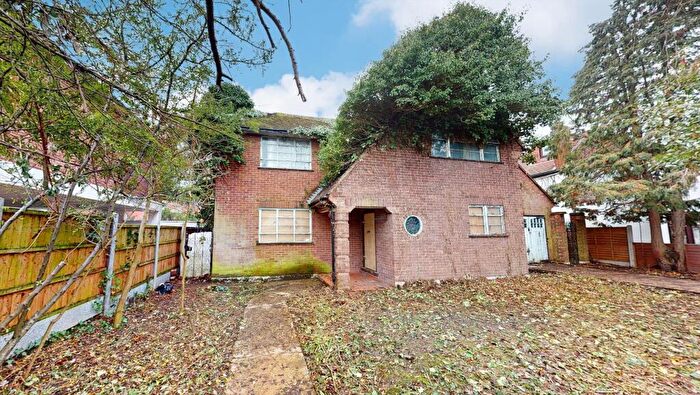
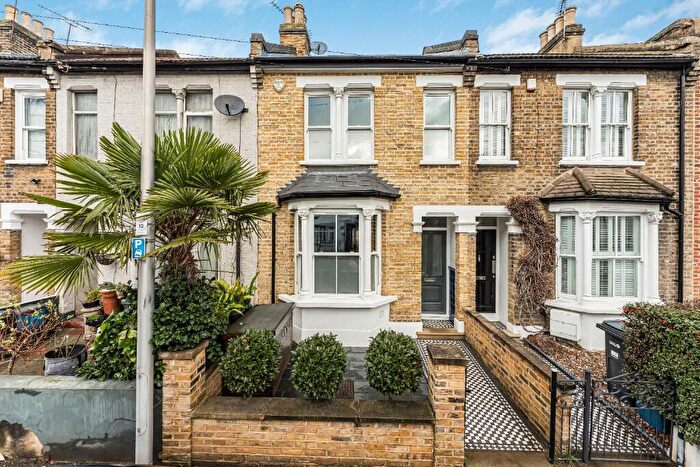
Properties for sale in Roding
Roads and Postcodes in Roding
Navigate through our locations to find the location of your next house in Roding, London for sale or to rent.
| Streets | Postcodes |
|---|---|
| Admirals Close | E18 1PN |
| Albert Road | E18 1LE |
| Alexandra Road | E18 1PZ |
| Ashbourne Avenue | E18 1PH E18 1PJ E18 1PL E18 1PQ |
| Ashford Road | E18 1JZ |
| Beechcroft Road | E18 1LA |
| Broxbourne Avenue | E18 1QG |
| Burton Road | E18 1QA |
| Cadogan Gardens | E18 1LT E18 1LU E18 1LY E18 1LZ |
| Charnwood Drive | E18 1PD E18 1PE E18 1PF E18 1PG |
| Chigwell Road | E18 1FF E18 1HA E18 1LR E18 1LS E18 1NG E18 1NJ E18 1NL E18 1NN E18 1TP |
| Cowslip Road | E18 1JN E18 1JW |
| Crescent Road | E18 1JA E18 1JB |
| Daisy Road | E18 1EA E18 1EH |
| Diana Close | E18 1DH |
| Essex Road | E18 1JS |
| Falcon Court | E18 1HL |
| Fosters Close | E18 1DQ |
| Foxdene Close | E18 1BH |
| George Lane | E18 1JJ E18 1LN E18 1LW |
| Gordon Road | E18 1DN E18 1DR E18 1DS E18 1DT E18 1DU E18 1DW E18 1RE |
| Granville Road | E18 1LD |
| Hermon Hill | E18 1QB E18 1QD E18 1QE E18 1QH E18 1QL E18 1QQ |
| Hurstwood Avenue | E18 1NT |
| Kenwood Gardens | E18 1LP |
| Lancaster Avenue | E18 1QF |
| Latchett Road | E18 1DJ E18 1DL |
| Lime Tree Close | E18 1NW |
| Lynwood Close | E18 1DP |
| Mannock Mews | E18 1DB |
| Maybank Avenue | E18 1JP |
| Maybank Road | E18 1EJ E18 1EL E18 1EN E18 1EP E18 1EQ E18 1ER E18 1EW E18 1JH |
| Monmouth Avenue | E18 1NU |
| Mulberry Way | E18 1EB E18 1ED E18 1EE E18 1EF |
| Oakdale Road | E18 1JX |
| Onslow Gardens | E18 1NA E18 1NB E18 1ND E18 1NE |
| Orford Road | E18 1PY |
| Pelham Road | E18 1PX |
| Primrose Road | E18 1BF E18 1DD E18 1DE E18 1DF E18 1RB |
| Pulteney Gardens | E18 1PU |
| Pulteney Road | E18 1PR E18 1PS |
| Raven Road | E18 1HB |
| Rose Avenue | E18 1JR |
| Roycroft Close | E18 1DZ |
| Sherwood Avenue | E18 1PB |
| South View Drive | E18 1NP E18 1NR E18 1NS E18 1NX |
| Thornwood Close | E18 1RH |
| Trinity Gardens | E18 1PA |
| Victoria Road | E18 1LF E18 1LG E18 1LJ E18 1LL |
| Violet Road | E18 1DG |
| Waverley Close | E18 1HY |
| Waverley Road | E18 1HU E18 1HX |
| Woodville Road | E18 1JT E18 1JU |
| Wynndale Road | E18 1DX E18 1DY |
Transport near Roding
-
South Woodford Station
-
Snaresbrook Station
-
Woodford Station
-
Wanstead Station
-
Redbridge Station
-
Wood Street Station
-
Highams Park Station
-
Gants Hill Station
-
Roding Valley Station
-
Leytonstone Station
- FAQ
- Price Paid By Year
- Property Type Price
Frequently asked questions about Roding
What is the average price for a property for sale in Roding?
The average price for a property for sale in Roding is £602,363. This amount is 9% lower than the average price in London. There are 2,337 property listings for sale in Roding.
What streets have the most expensive properties for sale in Roding?
The streets with the most expensive properties for sale in Roding are Charnwood Drive at an average of £1,056,666, Sherwood Avenue at an average of £1,019,500 and South View Drive at an average of £1,009,400.
What streets have the most affordable properties for sale in Roding?
The streets with the most affordable properties for sale in Roding are Lynwood Close at an average of £266,333, Roycroft Close at an average of £280,000 and Fosters Close at an average of £305,000.
Which train stations are available in or near Roding?
Some of the train stations available in or near Roding are Wood Street and Highams Park.
Which tube stations are available in or near Roding?
Some of the tube stations available in or near Roding are South Woodford, Snaresbrook and Woodford.
Property Price Paid in Roding by Year
The average sold property price by year was:
| Year | Average Sold Price | Price Change |
Sold Properties
|
|---|---|---|---|
| 2025 | £634,351 | 7% |
69 Properties |
| 2024 | £588,318 | -1% |
102 Properties |
| 2023 | £593,658 | -2% |
89 Properties |
| 2022 | £604,674 | 0,5% |
112 Properties |
| 2021 | £601,791 | 10% |
146 Properties |
| 2020 | £539,396 | 10% |
86 Properties |
| 2019 | £483,472 | -7% |
85 Properties |
| 2018 | £515,814 | -5% |
108 Properties |
| 2017 | £540,484 | 5% |
99 Properties |
| 2016 | £513,484 | 15% |
97 Properties |
| 2015 | £437,419 | 21% |
106 Properties |
| 2014 | £344,322 | 6% |
185 Properties |
| 2013 | £323,342 | -7% |
129 Properties |
| 2012 | £345,904 | 6% |
87 Properties |
| 2011 | £324,082 | 2% |
95 Properties |
| 2010 | £317,578 | 13% |
107 Properties |
| 2009 | £277,067 | -8% |
94 Properties |
| 2008 | £298,868 | -3% |
86 Properties |
| 2007 | £308,109 | 18% |
145 Properties |
| 2006 | £252,080 | 2% |
217 Properties |
| 2005 | £247,237 | 6% |
142 Properties |
| 2004 | £232,811 | 6% |
190 Properties |
| 2003 | £217,749 | 9% |
165 Properties |
| 2002 | £198,193 | 15% |
180 Properties |
| 2001 | £167,811 | 21% |
189 Properties |
| 2000 | £131,872 | 16% |
177 Properties |
| 1999 | £110,936 | 18% |
200 Properties |
| 1998 | £90,895 | 8% |
183 Properties |
| 1997 | £83,970 | 8% |
176 Properties |
| 1996 | £77,377 | 6% |
164 Properties |
| 1995 | £72,709 | - |
149 Properties |
Property Price per Property Type in Roding
Here you can find historic sold price data in order to help with your property search.
The average Property Paid Price for specific property types in the last three years are:
| Property Type | Average Sold Price | Sold Properties |
|---|---|---|
| Semi Detached House | £756,905.00 | 46 Semi Detached Houses |
| Detached House | £910,688.00 | 5 Detached Houses |
| Terraced House | £711,631.00 | 119 Terraced Houses |
| Flat | £361,769.00 | 90 Flats |

