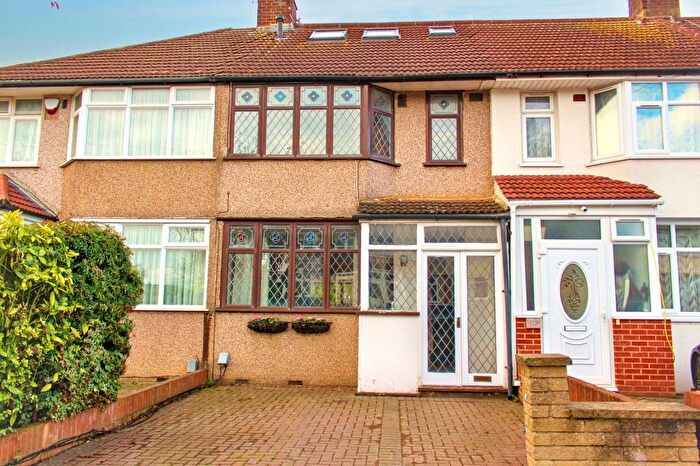
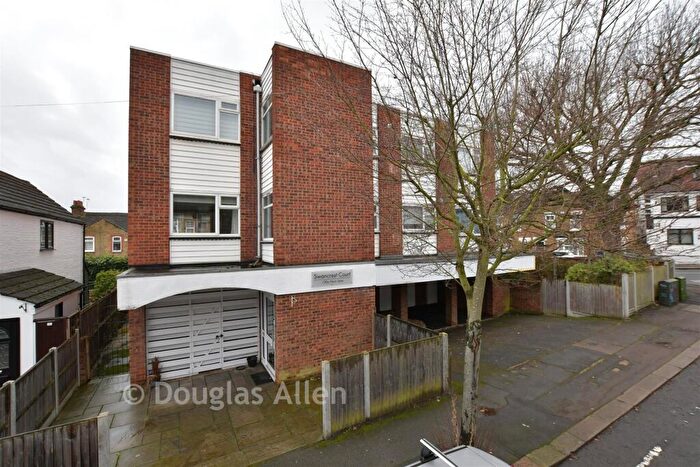
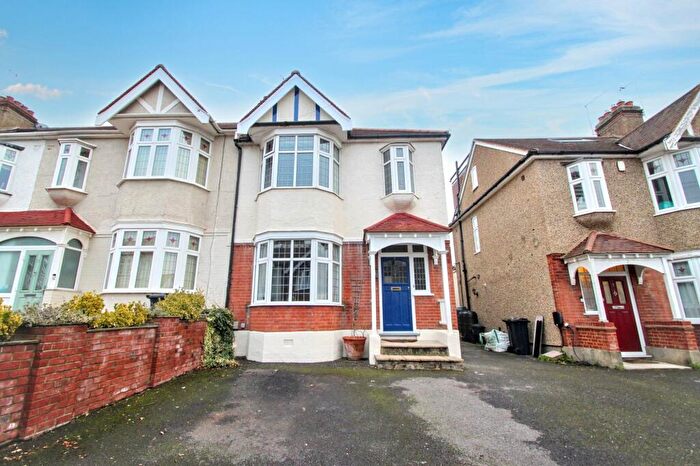
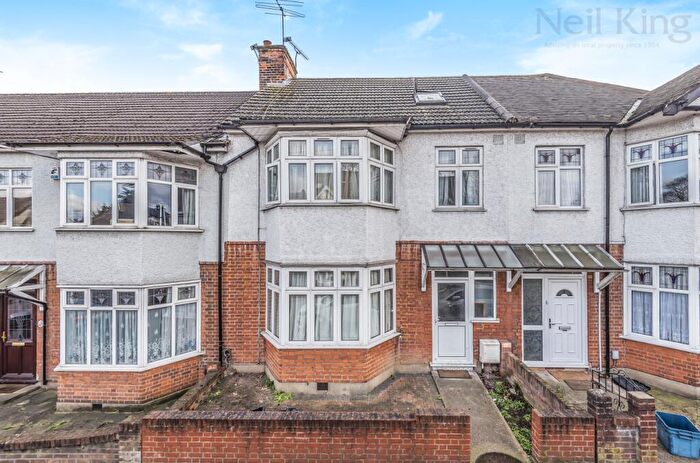
Houses for sale & to rent in Roding, Woodford Green
House Prices in Roding
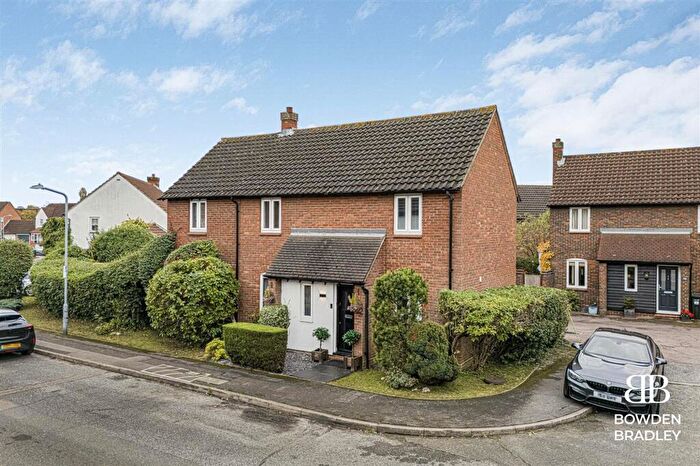
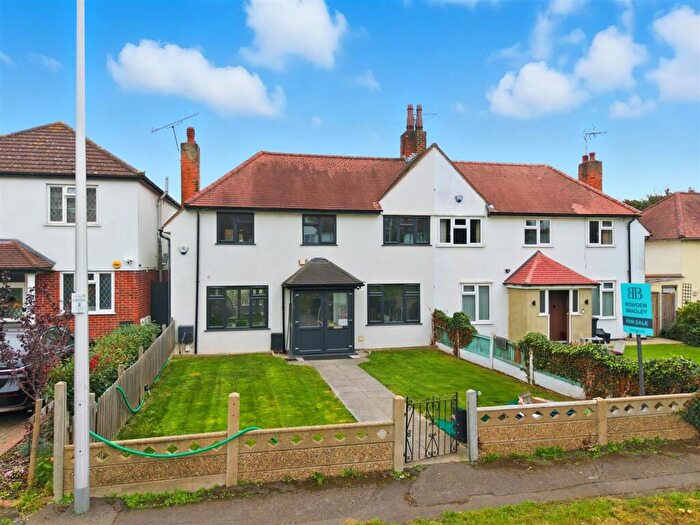
Properties in this part of Roding within Woodford Green have an average house price of £506,954.00 and had 169 Property Transactions within the last 3 years¹. This area has 1,696 households² , where the most expensive property was sold for £925,000.00.
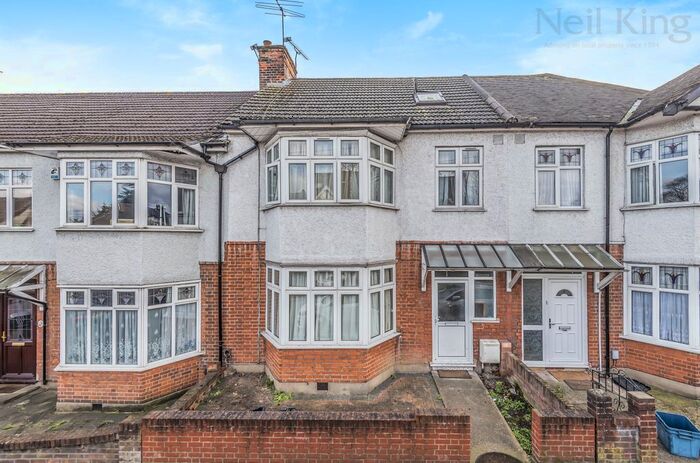
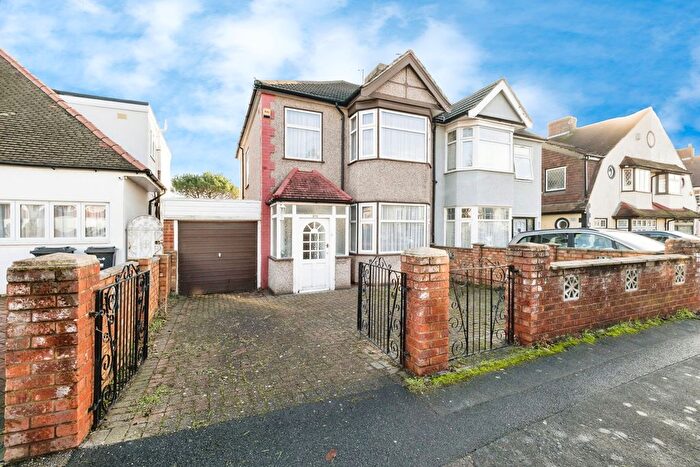
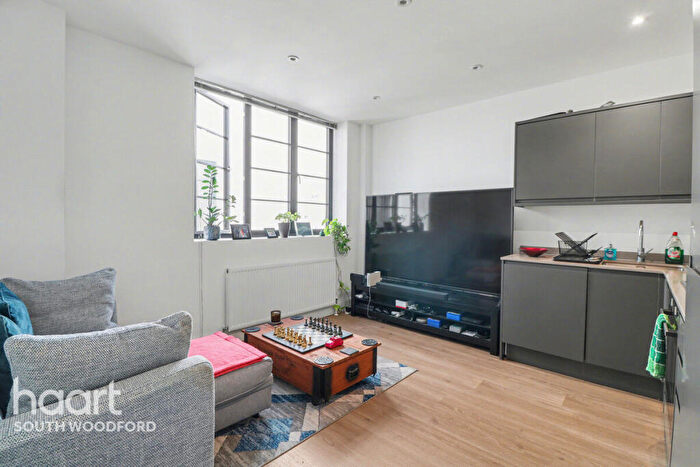
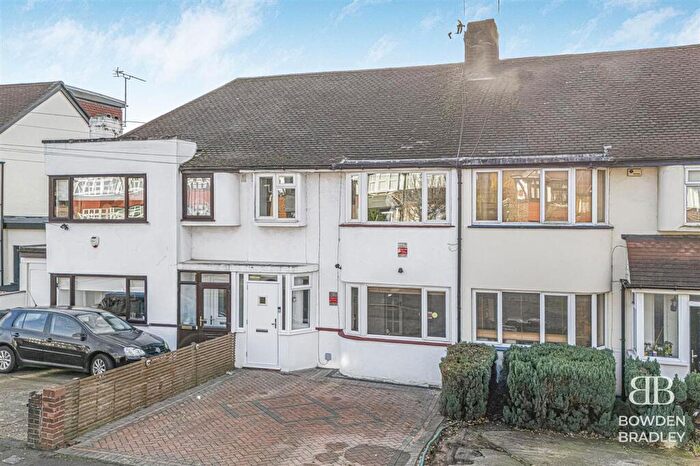
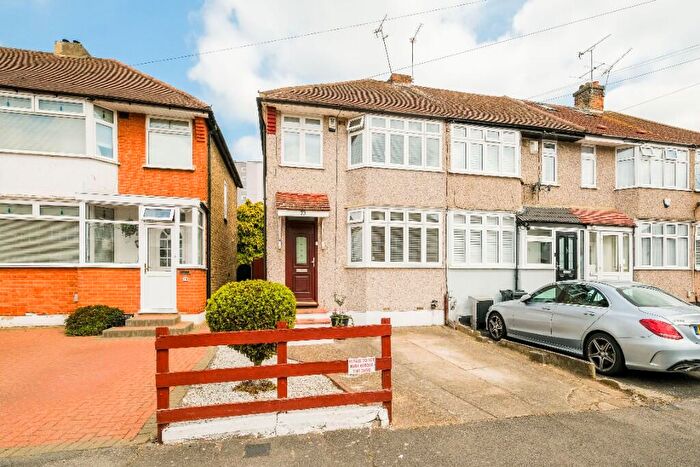
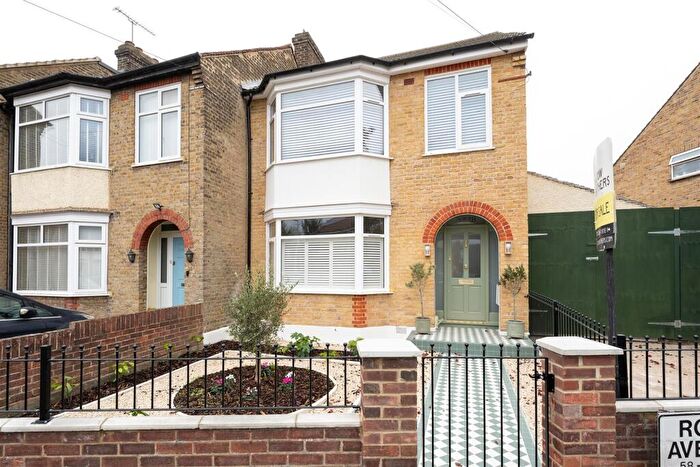
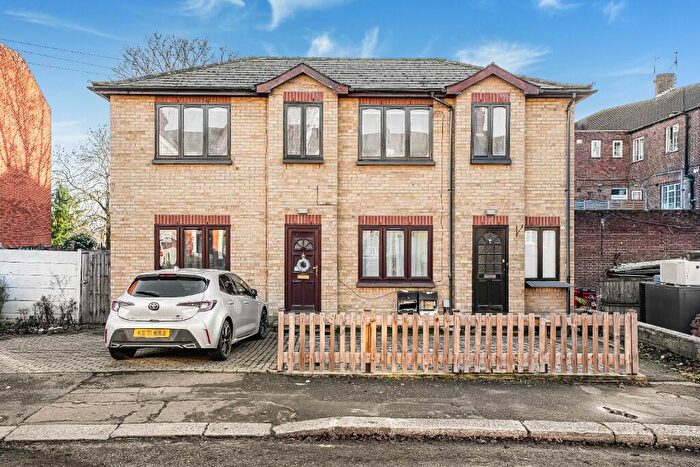
Properties for sale in Roding
Roads and Postcodes in Roding
Navigate through our locations to find the location of your next house in Roding, Woodford Green for sale or to rent.
| Streets | Postcodes |
|---|---|
| Broadmead Road | IG8 7EH IG8 8PF |
| Chalford Walk | IG8 8PH IG8 8PJ |
| Chigwell Road | IG8 8PL IG8 8PP |
| Coopersale Close | IG8 7BQ |
| Cortland Close | IG8 7PJ |
| Fairview Gardens | IG8 7DJ |
| Grenville Gardens | IG8 7AE IG8 7AF IG8 7AG IG8 7AQ |
| Hillington Gardens | IG8 8QS IG8 8QT |
| Kensington Drive | IG8 8LN IG8 8LP IG8 8LR IG8 8LW |
| Lambs Meadow | IG8 8QD |
| Lechmere Approach | IG8 8QE |
| Lechmere Avenue | IG8 8QF IG8 8QG IG8 8QQ |
| Lilian Gardens | IG8 7DN |
| Mallards Road | IG8 7DF |
| Mill Lane | IG8 0AG |
| Navestock Crescent | IG8 7AX IG8 7AY IG8 7AZ IG8 7BB IG8 7BD IG8 7BE IG8 7BG |
| North View Drive | IG8 8QJ |
| Orsett Terrace | IG8 7BA |
| Portman Drive | IG8 8QL IG8 8QN IG8 8QR IG8 8QU |
| Rivington Avenue | IG8 8LS IG8 8LT |
| Roding Lane North | IG8 8LH IG8 8LJ IG8 8LL IG8 8LQ |
| Scoter Close | IG8 7DH |
| Southend Road | IG8 8QH |
| St Barnabas Road | IG8 7DG IG8 7DL IG8 7DP IG8 7DR IG8 7DU IG8 7DW |
| Summit Drive | IG8 8QP IG8 8QW |
| The Firs | IG8 7DS |
| Wansford Road | IG8 7AA IG8 7AB IG8 7AD |
| Westview Drive | IG8 8LU IG8 8LX |
Transport near Roding
-
South Woodford Station
-
Woodford Station
-
Roding Valley Station
-
Snaresbrook Station
-
Redbridge Station
-
Wanstead Station
-
Gants Hill Station
-
Highams Park Station
-
Wood Street Station
-
Buckhurst Hill Station
- FAQ
- Price Paid By Year
- Property Type Price
Frequently asked questions about Roding
What is the average price for a property for sale in Roding?
The average price for a property for sale in Roding is £506,954. This amount is 21% lower than the average price in Woodford Green. There are 1,458 property listings for sale in Roding.
What streets have the most expensive properties for sale in Roding?
The streets with the most expensive properties for sale in Roding are Lilian Gardens at an average of £752,600, Fairview Gardens at an average of £660,000 and Summit Drive at an average of £632,375.
What streets have the most affordable properties for sale in Roding?
The streets with the most affordable properties for sale in Roding are Navestock Crescent at an average of £251,625, The Firs at an average of £265,750 and Chalford Walk at an average of £273,000.
Which train stations are available in or near Roding?
Some of the train stations available in or near Roding are Highams Park and Wood Street.
Which tube stations are available in or near Roding?
Some of the tube stations available in or near Roding are South Woodford, Woodford and Roding Valley.
Property Price Paid in Roding by Year
The average sold property price by year was:
| Year | Average Sold Price | Price Change |
Sold Properties
|
|---|---|---|---|
| 2025 | £518,892 | -5% |
28 Properties |
| 2024 | £543,090 | 7% |
34 Properties |
| 2023 | £502,760 | 4% |
46 Properties |
| 2022 | £484,495 | -6% |
61 Properties |
| 2021 | £511,365 | 4% |
70 Properties |
| 2020 | £490,459 | 7% |
36 Properties |
| 2019 | £457,270 | -3% |
61 Properties |
| 2018 | £469,537 | 18% |
27 Properties |
| 2017 | £385,696 | -1% |
50 Properties |
| 2016 | £387,812 | 4% |
51 Properties |
| 2015 | £372,271 | 16% |
69 Properties |
| 2014 | £313,758 | 3% |
80 Properties |
| 2013 | £305,897 | 7% |
46 Properties |
| 2012 | £285,147 | 8% |
48 Properties |
| 2011 | £262,396 | 5% |
34 Properties |
| 2010 | £250,420 | -0,4% |
55 Properties |
| 2009 | £251,460 | -5% |
33 Properties |
| 2008 | £264,248 | -1% |
44 Properties |
| 2007 | £267,429 | 7% |
73 Properties |
| 2006 | £248,480 | 8% |
106 Properties |
| 2005 | £227,626 | -2% |
63 Properties |
| 2004 | £232,355 | 8% |
67 Properties |
| 2003 | £212,926 | 14% |
89 Properties |
| 2002 | £183,555 | 20% |
92 Properties |
| 2001 | £146,166 | 17% |
82 Properties |
| 2000 | £121,606 | 3% |
68 Properties |
| 1999 | £118,283 | 16% |
79 Properties |
| 1998 | £99,351 | 16% |
62 Properties |
| 1997 | £83,009 | 2% |
56 Properties |
| 1996 | £81,472 | 3% |
73 Properties |
| 1995 | £79,308 | - |
56 Properties |
Property Price per Property Type in Roding
Here you can find historic sold price data in order to help with your property search.
The average Property Paid Price for specific property types in the last three years are:
| Property Type | Average Sold Price | Sold Properties |
|---|---|---|
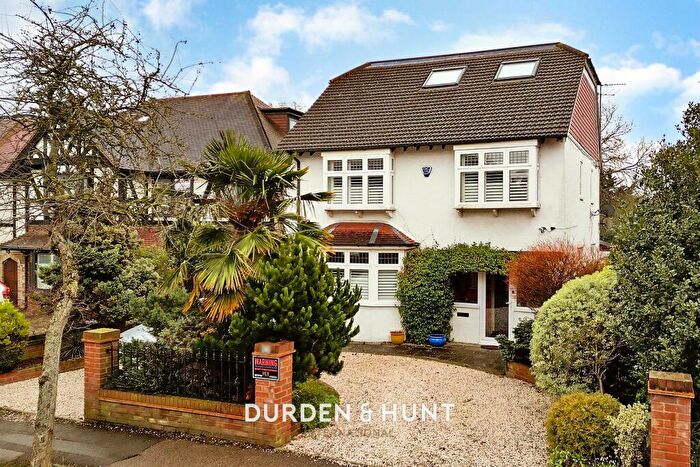
| Semi Detached House | £579,455.00 | 65 Semi Detached Houses |
| Detached House | £547,333.00 | 3 Detached Houses |
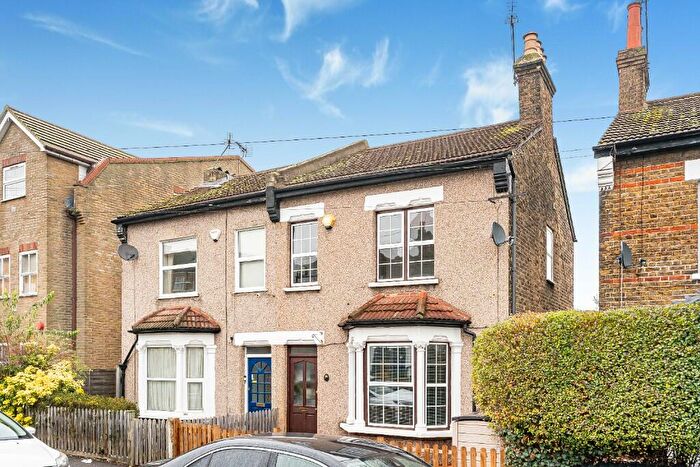
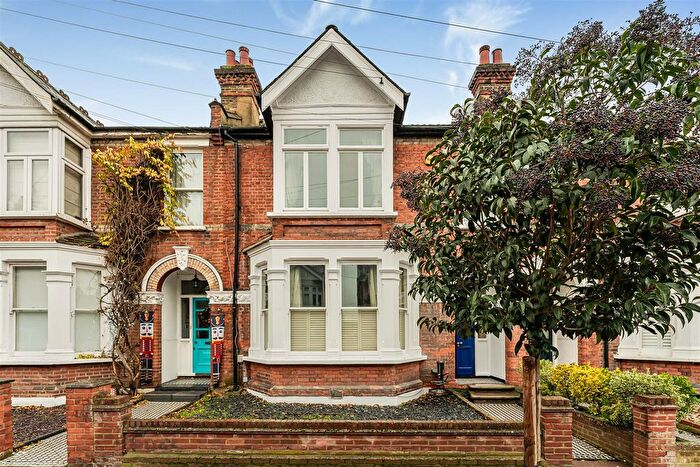
| Terraced House | £563,427.00 | 62 Terraced Houses |
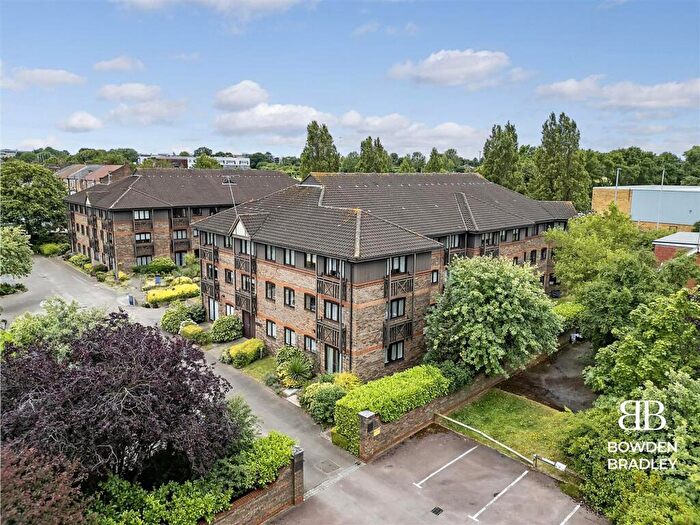
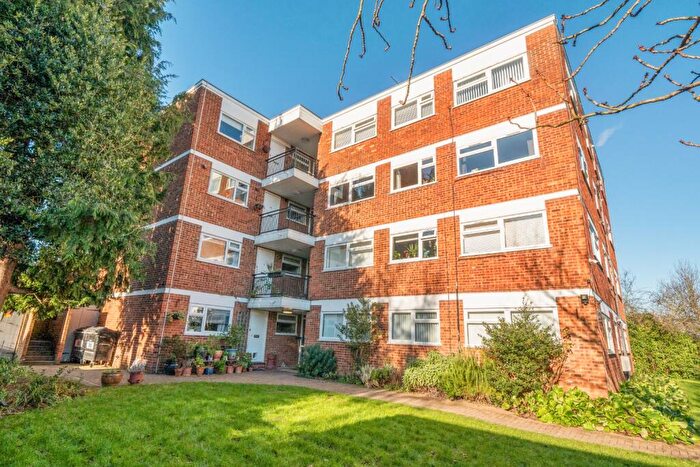
| Flat | £293,236.00 | 39 Flats |

