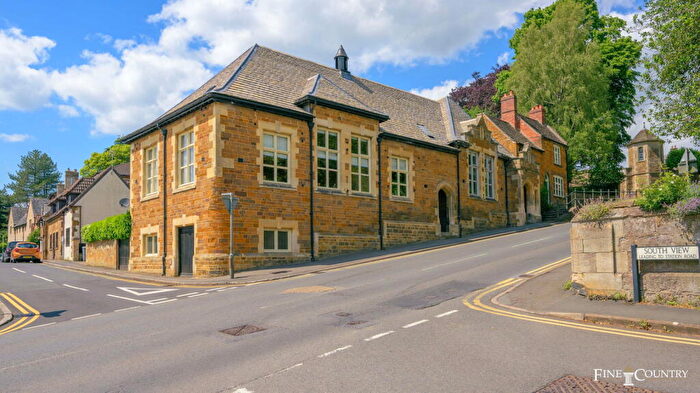
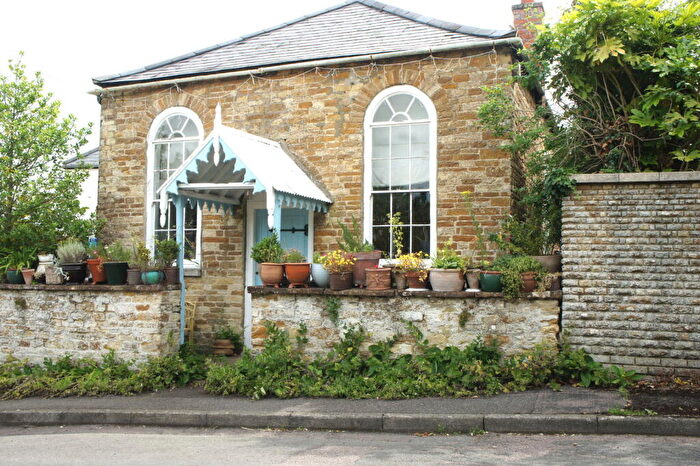
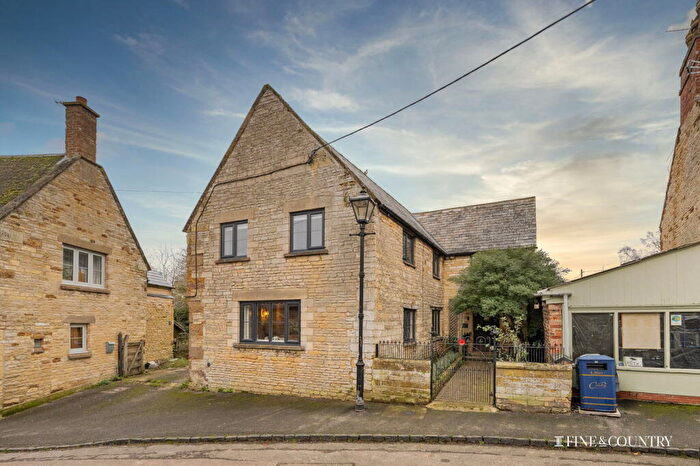
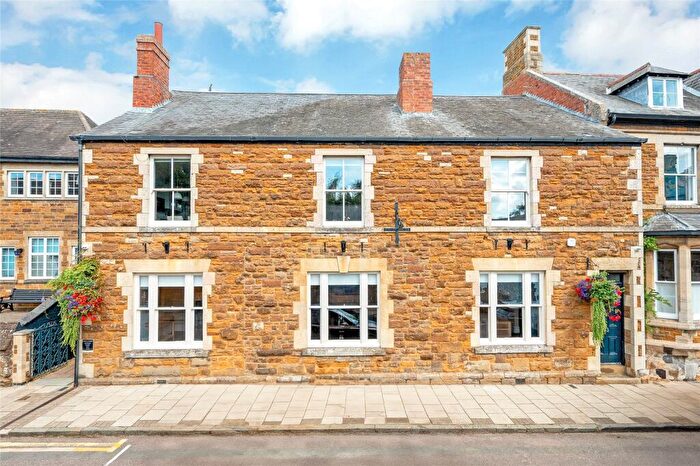
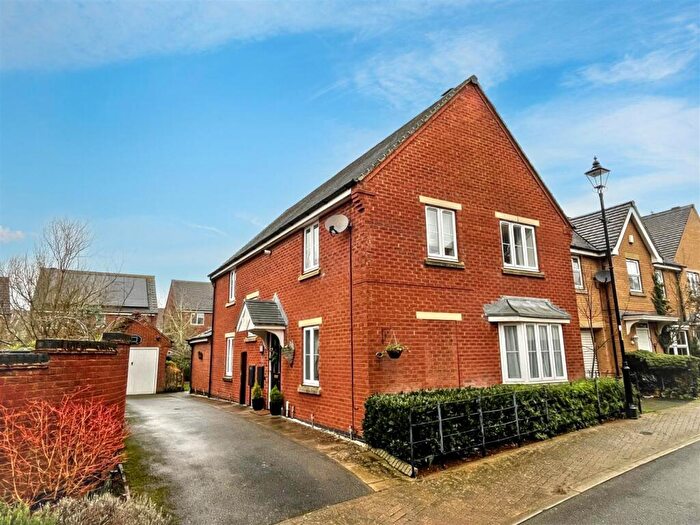
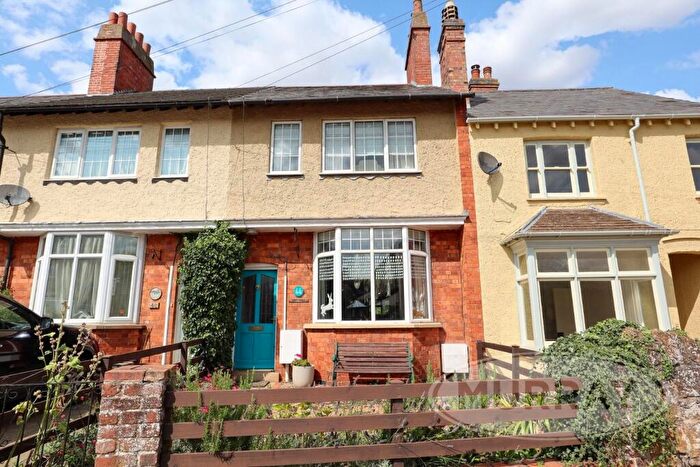
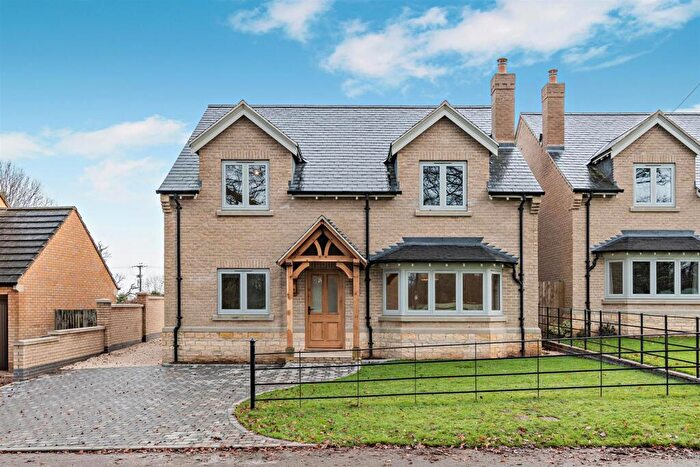
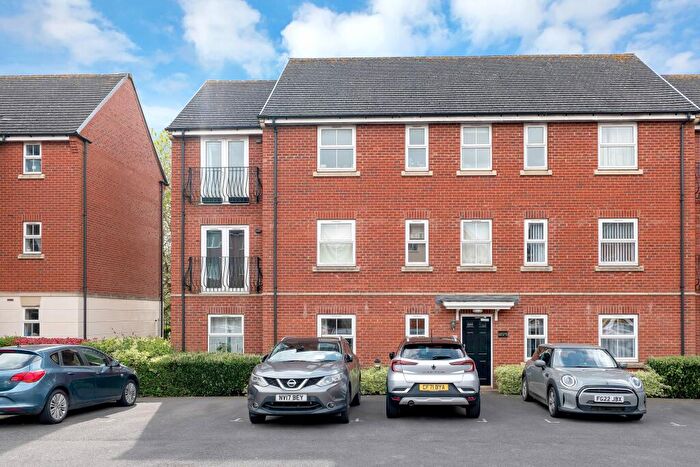
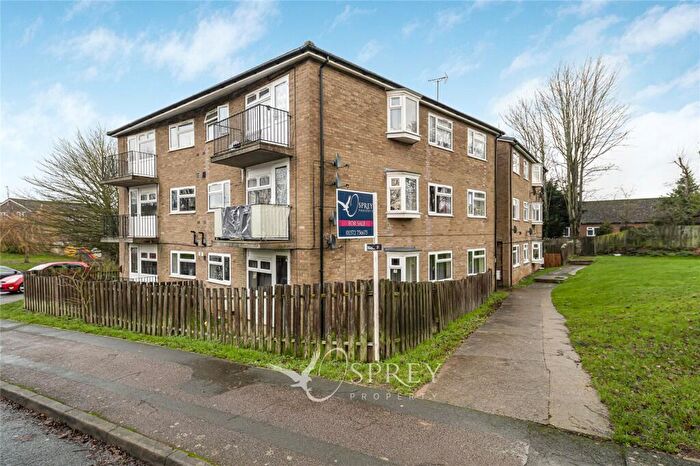
Houses for sale & to rent in Lyddington, Oakham
House Prices in Lyddington
Properties in Lyddington have an average house price of £602,544.00 and had 56 Property Transactions within the last 3 years¹.
Lyddington is an area in Oakham, Rutland with 456 households², where the most expensive property was sold for £1,875,000.00.
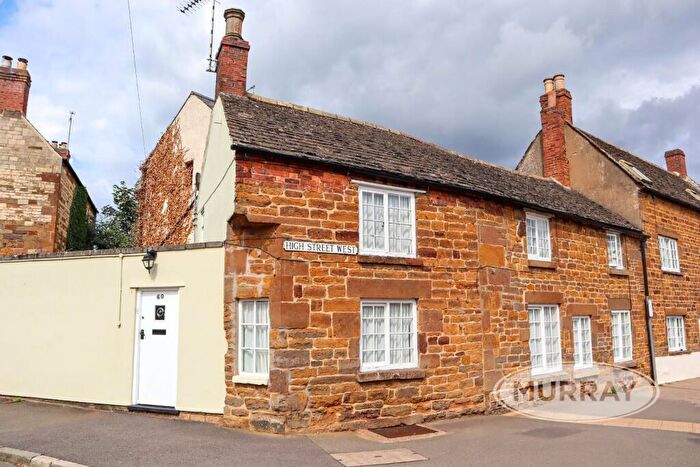
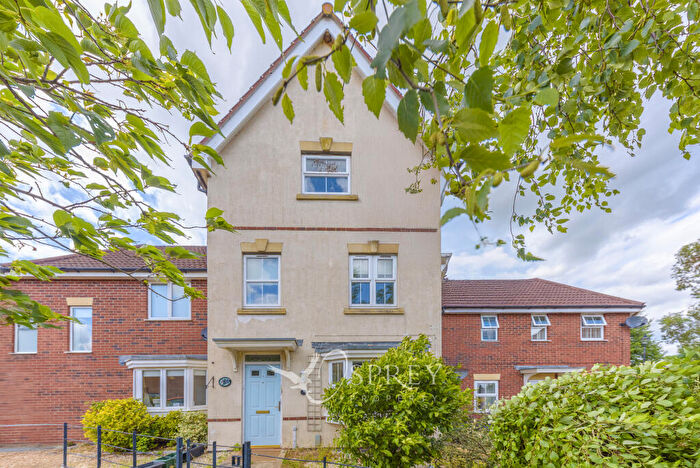
Properties for sale in Lyddington
Roads and Postcodes in Lyddington
Navigate through our locations to find the location of your next house in Lyddington, Oakham for sale or to rent.
| Streets | Postcodes |
|---|---|
| Baines Lane | LE15 9HP |
| Baulk Road | LE15 9EH |
| Bisbrooke Road | LE15 9HL |
| Bluecoat Lane | LE15 9LZ |
| Bottom Lane | LE15 9EJ |
| Caldecott Road | LE15 9BE |
| Chapel Lane | LE15 9LQ |
| Church Lane | LE15 9BN LE15 9EL LE15 9HR LE15 9LN |
| Colley Rise | LE15 9LL |
| Denfield Close | LE15 9ED |
| Drurys Lane | LE15 9HS |
| Glaston Park | LE15 9BW |
| Glaston Road | LE15 9EN |
| Grange Lane | LE15 9HT |
| Green Lane | LE15 9BH |
| Gretton Road | LE15 9HN LE15 9LP |
| Inhams Lane | LE15 9EW |
| Main Road | LE15 9BP LE15 9BS |
| Main Street | LE15 9EP LE15 9HU LE15 9JG LE15 9JQ LE15 9LR LE15 9LS LE15 9LT |
| Manor Lane | LE15 9BT |
| Mill Road | LE15 9HX LE15 9JW |
| Moles Lane | LE15 9HY |
| Morcott Road | LE15 9ET |
| Orchard Close | LE15 9BU |
| Peters Way | LE15 9EQ |
| Seaton Road | LE15 9EY LE15 9FE |
| Spring Lane | LE15 9BX LE15 9BZ |
| Station Road | LE15 9HZ |
| Stoke Road | LE15 9LU |
| The Green | LE15 9LW |
| Thompsons Lane | LE15 9JA |
| Thorpe Road | LE15 9LX |
| Top Lane | LE15 9ER |
| Uppingham Road | LE15 9ES LE15 9JB LE15 9HW |
| Walnut Close | LE15 9EX |
| West Lane | LE15 9BA |
| Windmill Way | LE15 9LY |
| Wing Road | LE15 9BY |
Transport near Lyddington
- FAQ
- Price Paid By Year
- Property Type Price
Frequently asked questions about Lyddington
What is the average price for a property for sale in Lyddington?
The average price for a property for sale in Lyddington is £602,544. This amount is 46% higher than the average price in Oakham. There are 278 property listings for sale in Lyddington.
What streets have the most expensive properties for sale in Lyddington?
The streets with the most expensive properties for sale in Lyddington are Top Lane at an average of £872,500, Spring Lane at an average of £747,500 and West Lane at an average of £702,500.
What streets have the most affordable properties for sale in Lyddington?
The streets with the most affordable properties for sale in Lyddington are Main Road at an average of £225,666, Inhams Lane at an average of £260,625 and Uppingham Road at an average of £315,250.
Which train stations are available in or near Lyddington?
Some of the train stations available in or near Lyddington are Corby, Oakham and Stamford.
Property Price Paid in Lyddington by Year
The average sold property price by year was:
| Year | Average Sold Price | Price Change |
Sold Properties
|
|---|---|---|---|
| 2025 | £621,906 | 8% |
16 Properties |
| 2024 | £573,750 | -9% |
24 Properties |
| 2023 | £626,375 | 9% |
16 Properties |
| 2022 | £571,421 | -4% |
19 Properties |
| 2021 | £592,670 | 6% |
18 Properties |
| 2020 | £555,454 | 2% |
22 Properties |
| 2019 | £546,157 | 14% |
19 Properties |
| 2018 | £470,321 | 5% |
14 Properties |
| 2017 | £448,019 | -14% |
19 Properties |
| 2016 | £512,913 | 0,4% |
18 Properties |
| 2015 | £510,642 | 13% |
28 Properties |
| 2014 | £444,508 | 16% |
18 Properties |
| 2013 | £374,049 | -44% |
13 Properties |
| 2012 | £539,252 | 31% |
23 Properties |
| 2011 | £371,992 | 8% |
13 Properties |
| 2010 | £343,578 | -11% |
19 Properties |
| 2009 | £382,638 | -32% |
18 Properties |
| 2008 | £505,974 | 31% |
25 Properties |
| 2007 | £347,111 | 7% |
22 Properties |
| 2006 | £322,194 | 18% |
18 Properties |
| 2005 | £265,294 | -5% |
17 Properties |
| 2004 | £278,190 | -15% |
20 Properties |
| 2003 | £320,248 | 12% |
30 Properties |
| 2002 | £281,302 | 19% |
20 Properties |
| 2001 | £227,602 | 2% |
19 Properties |
| 2000 | £222,331 | 31% |
16 Properties |
| 1999 | £153,264 | 21% |
17 Properties |
| 1998 | £121,798 | -11% |
26 Properties |
| 1997 | £135,073 | 10% |
34 Properties |
| 1996 | £121,720 | -3% |
34 Properties |
| 1995 | £125,152 | - |
14 Properties |
Property Price per Property Type in Lyddington
Here you can find historic sold price data in order to help with your property search.
The average Property Paid Price for specific property types in the last three years are:
| Property Type | Average Sold Price | Sold Properties |
|---|---|---|
| Semi Detached House | £316,406.00 | 8 Semi Detached Houses |
| Detached House | £751,407.00 | 35 Detached Houses |
| Terraced House | £377,846.00 | 13 Terraced Houses |

