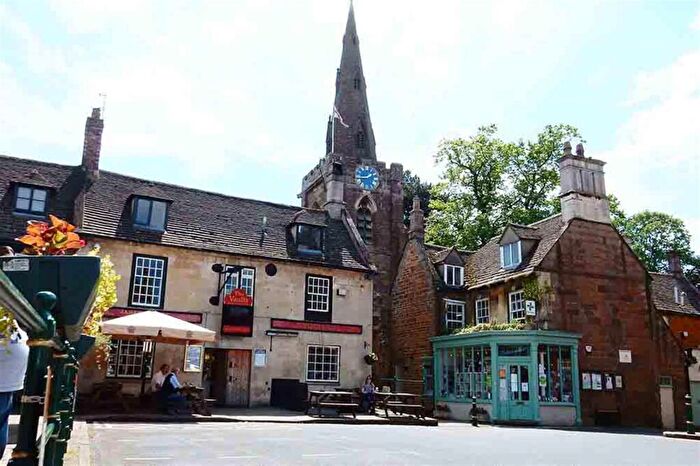
Houses for sale & to rent in Uppingham, Oakham
House Prices in Uppingham
Properties in Uppingham have an average house price of £370,957.00 and had 188 Property Transactions within the last 3 years¹.
Uppingham is an area in Oakham, Rutland with 1,731 households², where the most expensive property was sold for £1,000,000.00.
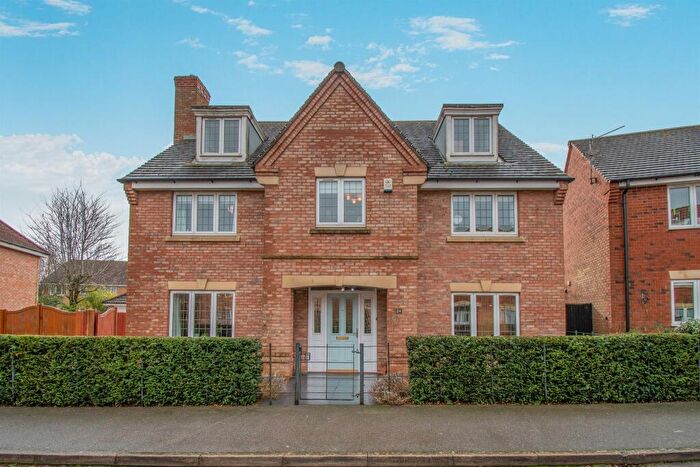
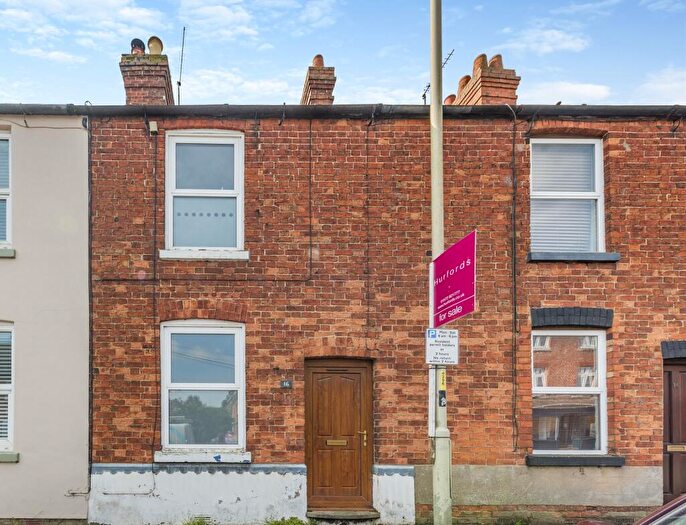
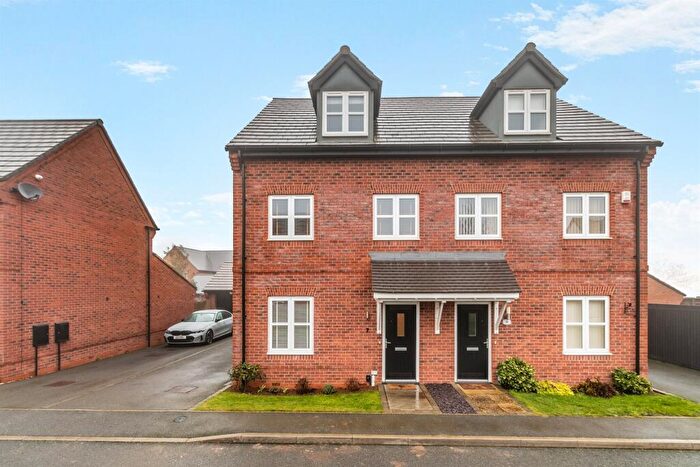
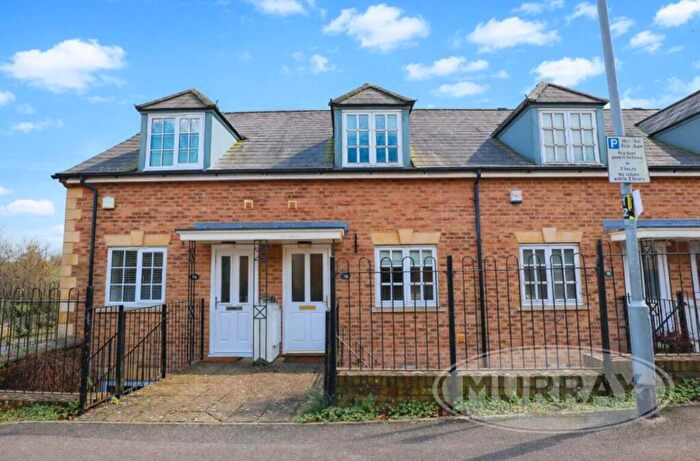
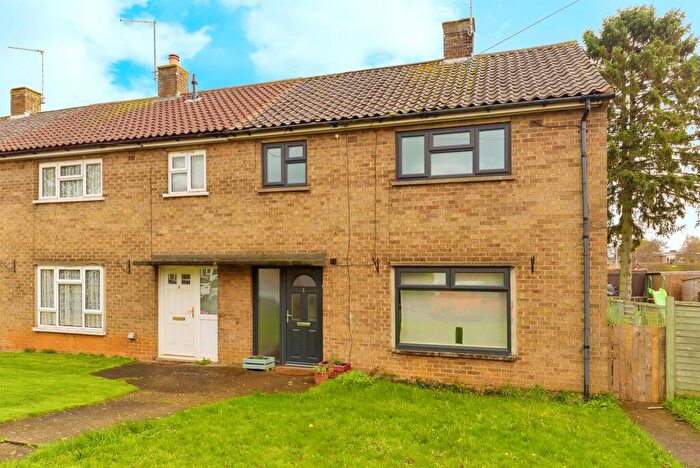
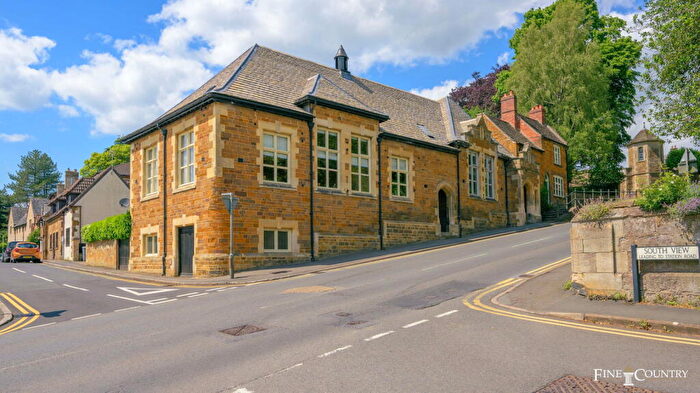
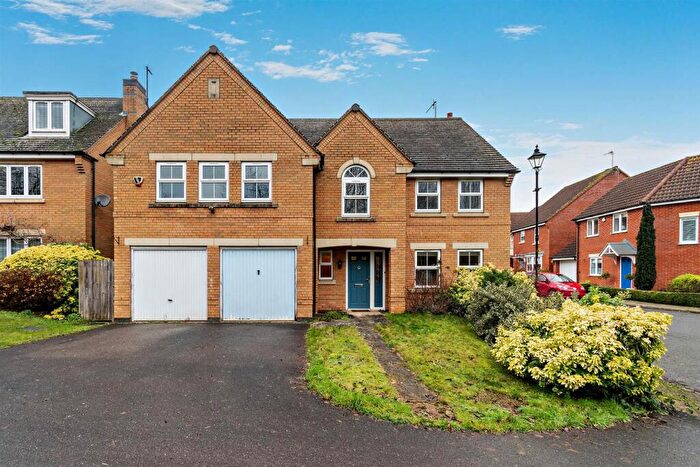
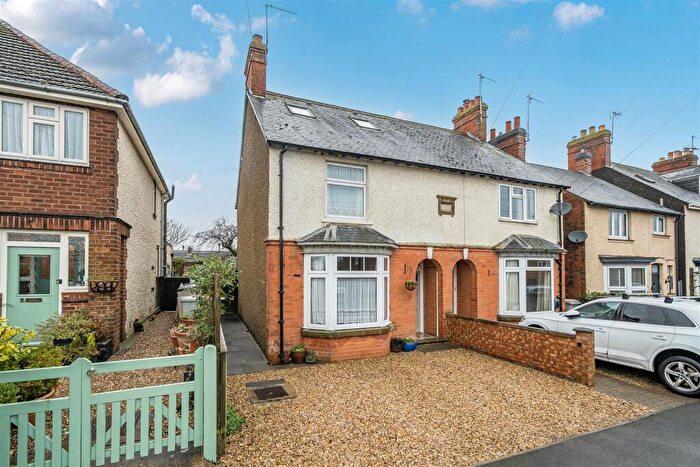
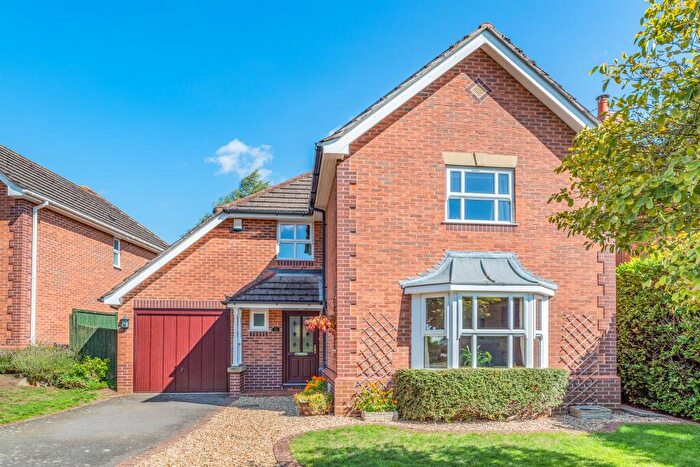
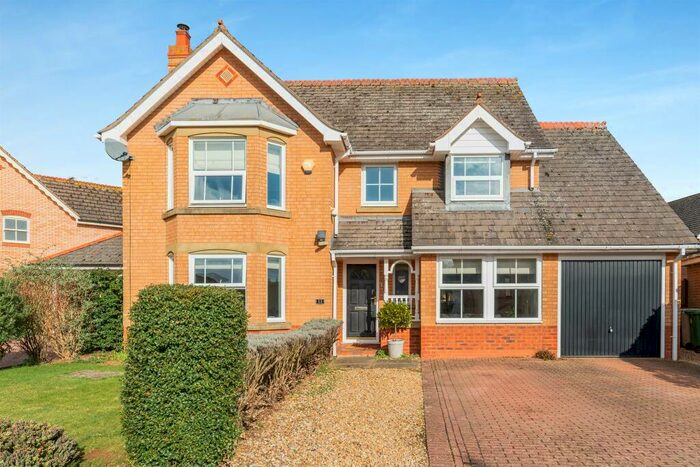
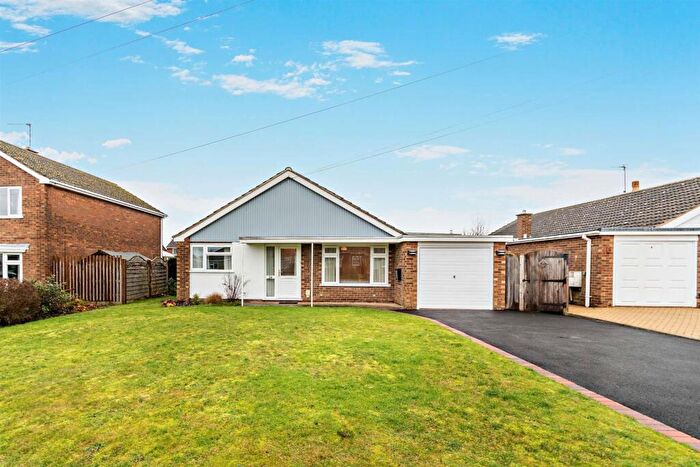
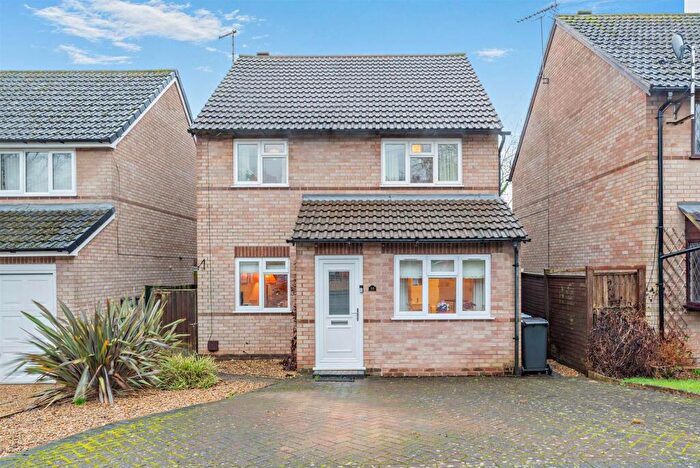
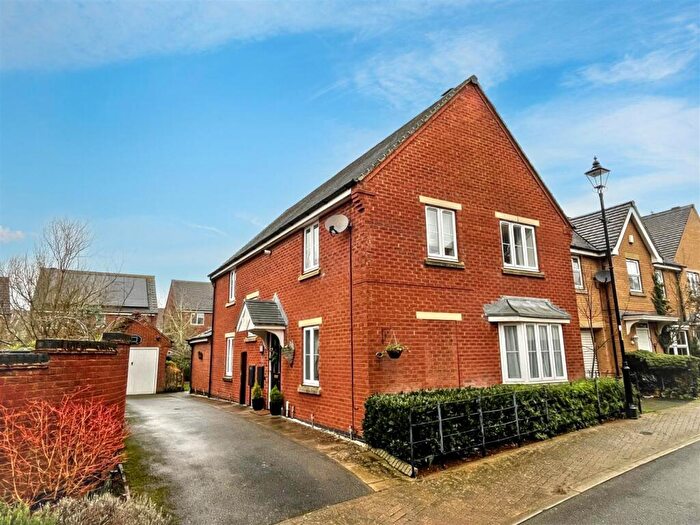
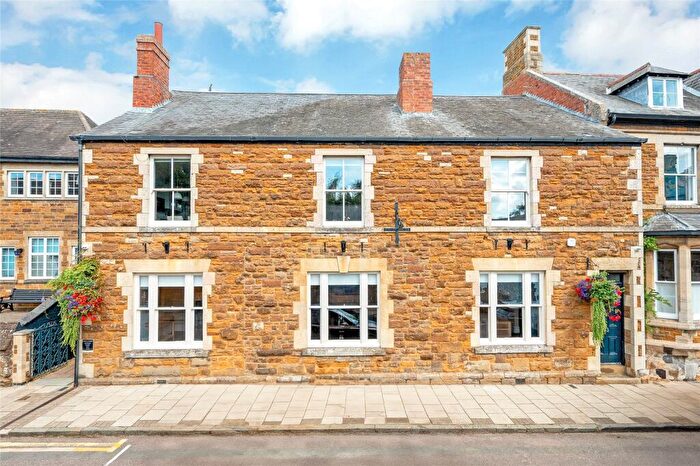
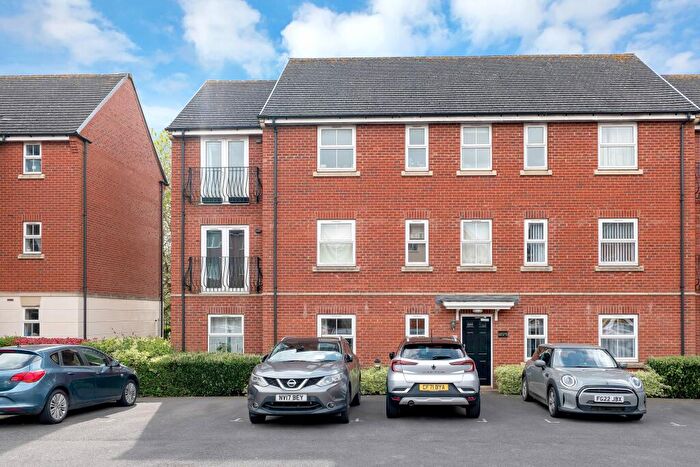
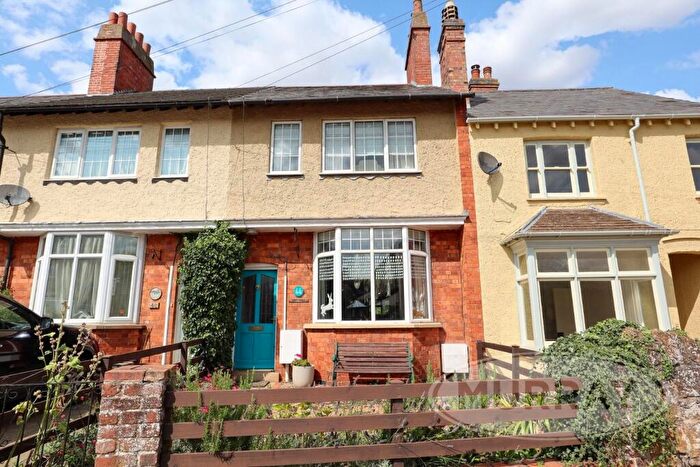
Properties for sale in Uppingham
Roads and Postcodes in Uppingham
Navigate through our locations to find the location of your next house in Uppingham, Oakham for sale or to rent.
| Streets | Postcodes |
|---|---|
| Adderley Street | LE15 9PP LE15 9PS |
| Aris Close | LE15 9FD |
| Ash Close | LE15 9PJ |
| Ayston Road | LE15 9RL LE15 9RN LE15 9RP LE15 9RW |
| Barfield Street | LE15 9FA |
| Bayley Close | LE15 9TG |
| Bear Yard | LE15 9RB |
| Belgrave Road | LE15 9RT |
| Blackthorn Close | LE15 9BG |
| Bramble Close | LE15 9PH |
| Branston Road | LE15 9RR LE15 9RS |
| Brook Close | LE15 9PE |
| Campden Close | LE15 9TE |
| Castle Close | LE15 9PN |
| Caudebec Close | LE15 9SY |
| Cedar Close | LE15 9PT |
| Chapel Walk | LE15 9NE |
| Chapman Place | LE15 9EA |
| Chestnut Close | LE15 9TQ |
| Cottesmore Road | LE15 9RU |
| Crown Passage | LE15 9NB |
| Deans Terrace | LE15 9RX |
| Dorman Avenue | LE15 9FB |
| Elizabeth Way | LE15 9PQ |
| Farleigh Court | LE15 9TY |
| Farleigh Gardens | LE15 9RH |
| Finch Close | LE15 9RG |
| Firs Avenue | LE15 9RE |
| Firth Park | LE15 9SZ |
| Freer Drive | LE15 9EF |
| Gainsborough Road | LE15 9PU |
| Gerrard Court | LE15 9SW |
| Glaston Road | LE15 9EU LE15 9PX |
| Goldcrest | LE15 9UP |
| Goldfinch Road | LE15 9UJ |
| Hall Gardens | LE15 9HG |
| Hawthorn Drive | LE15 9TA |
| Hazel Close | LE15 9QZ |
| High Street East | LE15 9PY LE15 9PZ LE15 9QA |
| High Street West | LE15 9QD LE15 9QB LE15 9QE LE15 9QF LE15 9QG |
| Hopes Yard | LE15 9QQ |
| Hornbeam Lane | LE15 9BF |
| Johnson Road | LE15 9RY LE15 9RZ LE15 9SA |
| Leamington Terrace | LE15 9TH |
| Leicester Road | LE15 9SB LE15 9SD LE15 9SE LE15 9SP |
| Lime Tree Avenue | LE15 9SS |
| Linnet Court | LE15 9UR |
| London Road | LE15 9TJ LE15 9TL LE15 9TN LE15 9TW |
| Market Place | LE15 9QH |
| Metcalfe Crescent | LE15 9UQ |
| Mount Pleasant | LE15 9PR |
| Newtown Crescent | LE15 9TP |
| Newtown Road | LE15 9TR LE15 9TS |
| North Gate | LE15 9EG LE15 9NX LE15 9PL |
| North Street East | LE15 9QJ LE15 9QL |
| North Street West | LE15 9SF LE15 9SG |
| Norton Street | LE15 9QN |
| Oak Close | LE15 9SU |
| Old School Mews | LE15 9TF |
| Orange Street | LE15 9SQ |
| Orchard Close | LE15 9PF |
| Pleasant Terrace | LE15 9QW |
| Poplar Close | LE15 9RQ |
| Printers Yard | LE15 9RA |
| Queen Street | LE15 9QR |
| Queens Road | LE15 9SH |
| Rees Close | LE15 9ST |
| Reeves Yard | LE15 9QS |
| Rutland Close | LE15 9RF |
| Samuel Close | LE15 9TB |
| School Lane | LE15 9QT |
| Scott Close | LE15 9TD |
| Seaton Drive | LE15 9HQ |
| Seaton Road | LE15 9QX LE15 9HH |
| Shepherds Way | LE15 9PW |
| Shields Yard | LE15 9ND |
| Silmans Yard | LE15 9LF |
| Siskin Road | LE15 9UL |
| South View | LE15 9TU |
| Southwell Way | LE15 9EZ |
| Spring Back Way | LE15 9TT |
| Station Road | LE15 9TX LE15 9TZ LE15 9US |
| Stockerston Crescent | LE15 9UA LE15 9UB |
| Stockerston Road | LE15 9HJ LE15 9UD LE15 9UF LE15 9UG |
| The Beeches | LE15 9PG |
| The Quadrant | LE15 9QP |
| Thorpes Terrace | LE15 9SJ |
| Thring Terrace | LE15 9UE |
| Tods Terrace | LE15 9SL |
| Toons Yard | LE15 9QU |
| Twitchbed Lane | LE15 9EE |
| Uppingham Gate | LE15 9NY |
| Wades Terrace | LE15 9QY |
| Wheatley Avenue | LE15 9SN |
| Wilkes Gardens | LE15 9UH |
| Willoughby Court | LE15 9SR |
| Willow Close | LE15 9RD |
Transport near Uppingham
-
Oakham Station
-
Corby Station
-
Market Harborough Station
-
Stamford Station
-
Kettering Station
-
Melton Mowbray Station
- FAQ
- Price Paid By Year
- Property Type Price
Frequently asked questions about Uppingham
What is the average price for a property for sale in Uppingham?
The average price for a property for sale in Uppingham is £370,957. This amount is 10% lower than the average price in Oakham. There are 174 property listings for sale in Uppingham.
What streets have the most expensive properties for sale in Uppingham?
The streets with the most expensive properties for sale in Uppingham are Leicester Road at an average of £786,250, London Road at an average of £750,000 and High Street West at an average of £675,000.
What streets have the most affordable properties for sale in Uppingham?
The streets with the most affordable properties for sale in Uppingham are Thorpes Terrace at an average of £170,000, Tods Terrace at an average of £186,666 and Printers Yard at an average of £192,500.
Which train stations are available in or near Uppingham?
Some of the train stations available in or near Uppingham are Oakham, Corby and Market Harborough.
Property Price Paid in Uppingham by Year
The average sold property price by year was:
| Year | Average Sold Price | Price Change |
Sold Properties
|
|---|---|---|---|
| 2025 | £375,290 | 4% |
55 Properties |
| 2024 | £359,133 | -6% |
71 Properties |
| 2023 | £380,653 | 7% |
62 Properties |
| 2022 | £353,712 | 15% |
64 Properties |
| 2021 | £298,963 | -13% |
104 Properties |
| 2020 | £337,375 | 10% |
86 Properties |
| 2019 | £303,399 | -1% |
104 Properties |
| 2018 | £305,090 | 9% |
82 Properties |
| 2017 | £277,212 | 3% |
81 Properties |
| 2016 | £267,856 | 17% |
63 Properties |
| 2015 | £221,229 | -4% |
97 Properties |
| 2014 | £230,892 | 0,5% |
69 Properties |
| 2013 | £229,739 | 6% |
67 Properties |
| 2012 | £215,209 | -9% |
43 Properties |
| 2011 | £233,558 | 14% |
77 Properties |
| 2010 | £200,977 | -7% |
59 Properties |
| 2009 | £214,413 | -5% |
76 Properties |
| 2008 | £226,074 | 5% |
57 Properties |
| 2007 | £214,825 | -2% |
83 Properties |
| 2006 | £220,093 | 4% |
120 Properties |
| 2005 | £210,295 | 9% |
132 Properties |
| 2004 | £191,614 | 9% |
152 Properties |
| 2003 | £174,559 | 15% |
140 Properties |
| 2002 | £148,595 | 23% |
109 Properties |
| 2001 | £113,846 | -0,1% |
109 Properties |
| 2000 | £113,979 | 19% |
68 Properties |
| 1999 | £92,229 | 1% |
75 Properties |
| 1998 | £91,107 | 10% |
82 Properties |
| 1997 | £82,096 | 11% |
97 Properties |
| 1996 | £73,352 | -2% |
85 Properties |
| 1995 | £74,956 | - |
73 Properties |
Property Price per Property Type in Uppingham
Here you can find historic sold price data in order to help with your property search.
The average Property Paid Price for specific property types in the last three years are:
| Property Type | Average Sold Price | Sold Properties |
|---|---|---|
| Semi Detached House | £322,448.00 | 38 Semi Detached Houses |
| Detached House | £455,805.00 | 80 Detached Houses |
| Terraced House | £317,500.00 | 59 Terraced Houses |
| Flat | £208,181.00 | 11 Flats |

