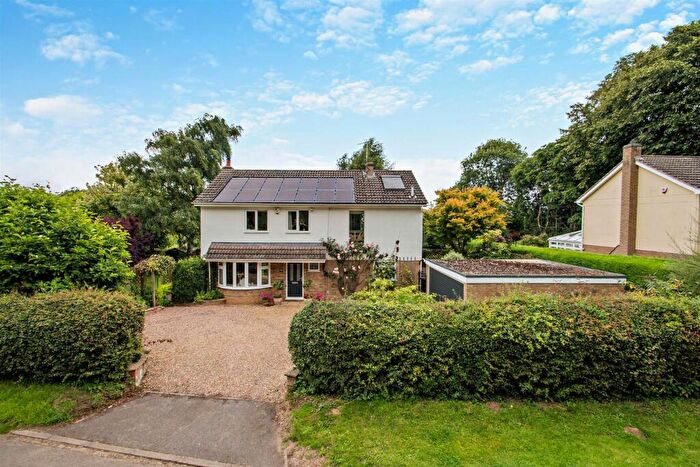
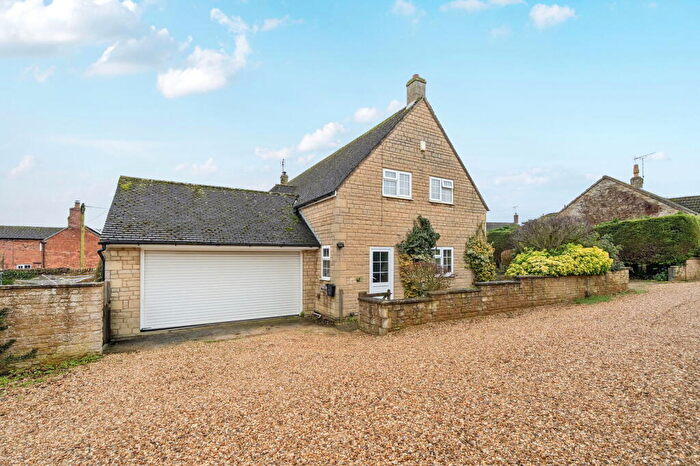
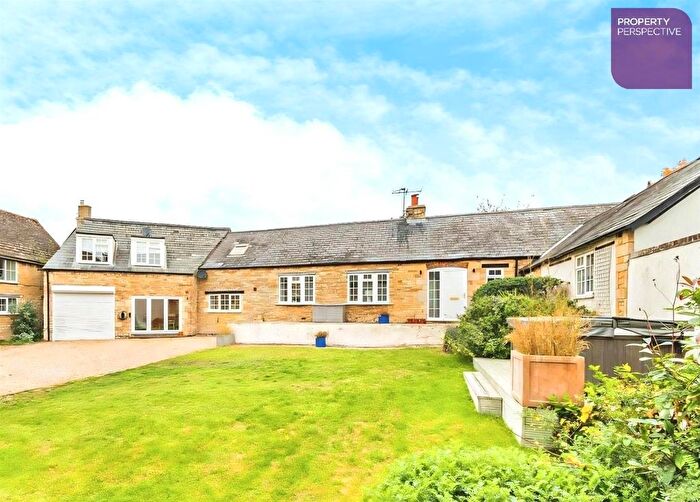
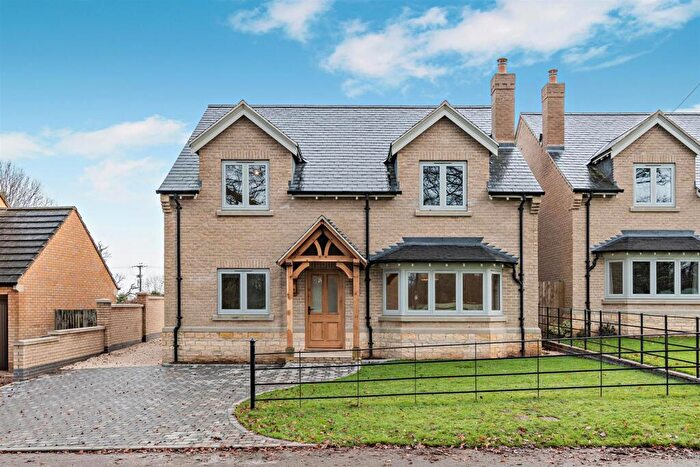
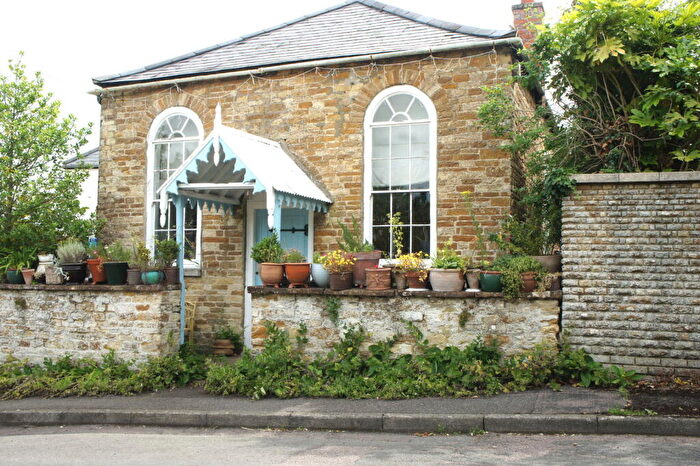
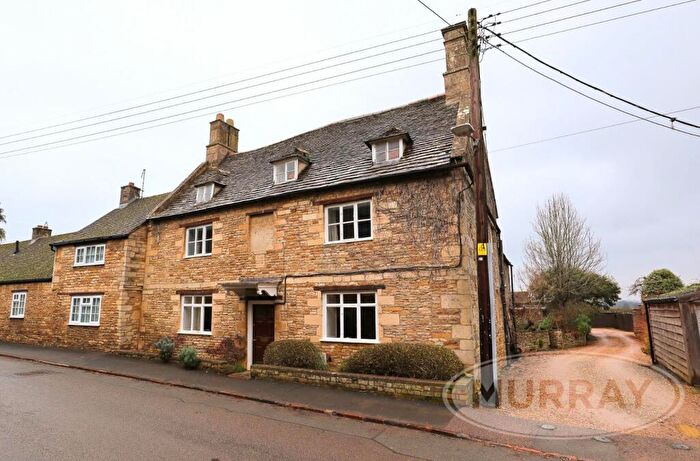
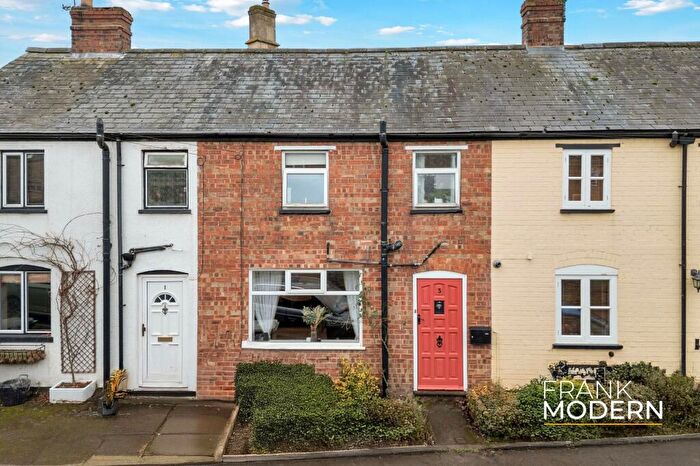
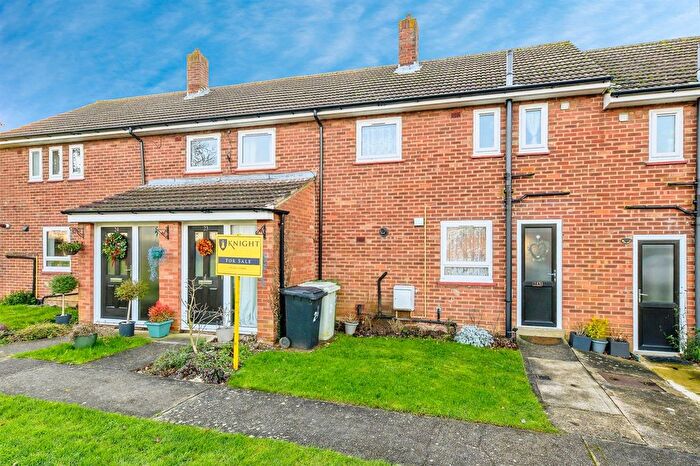
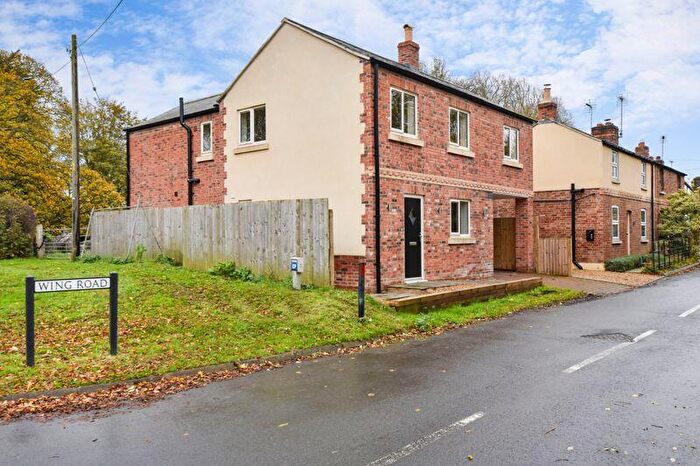
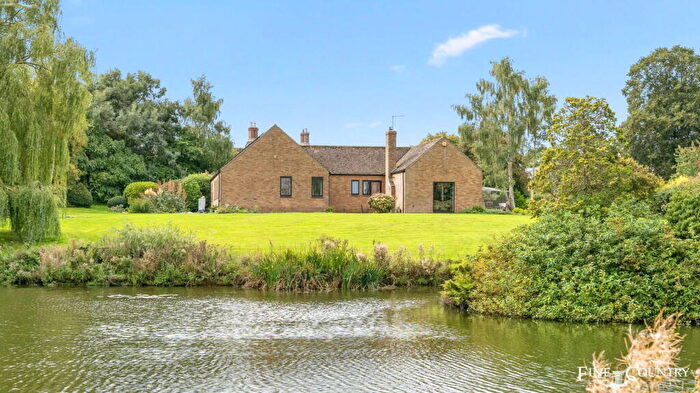
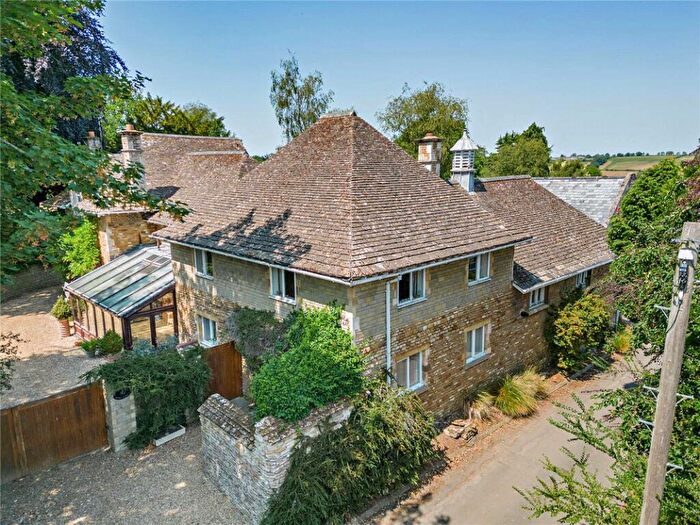
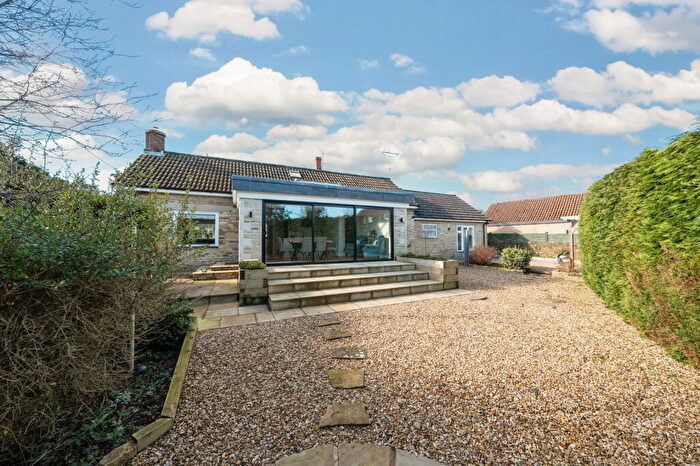
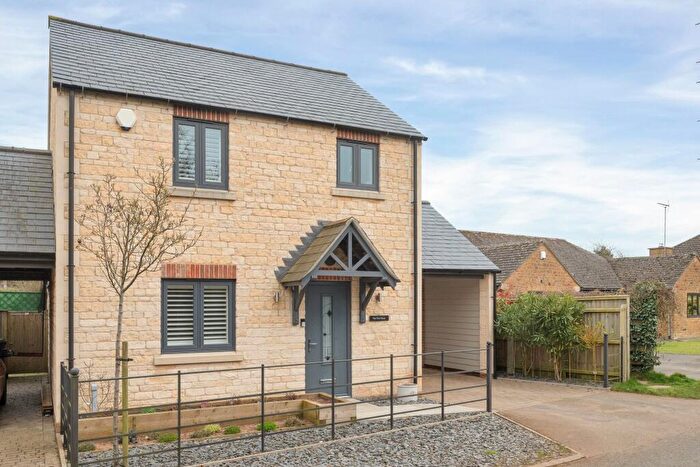
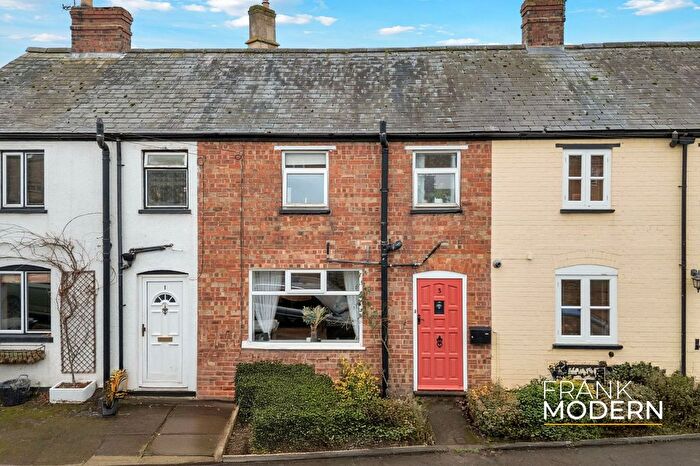
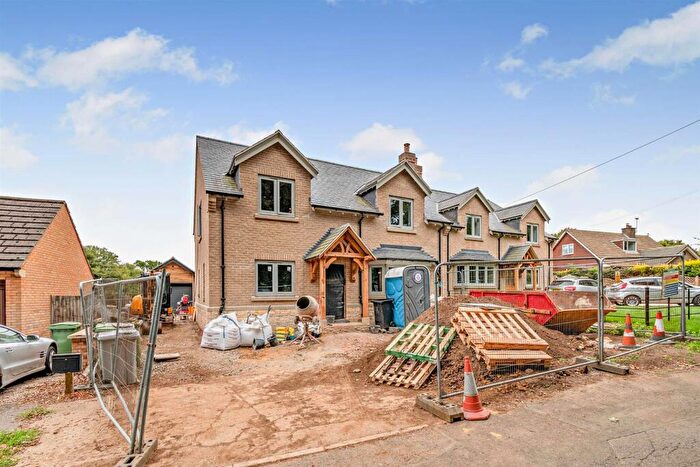
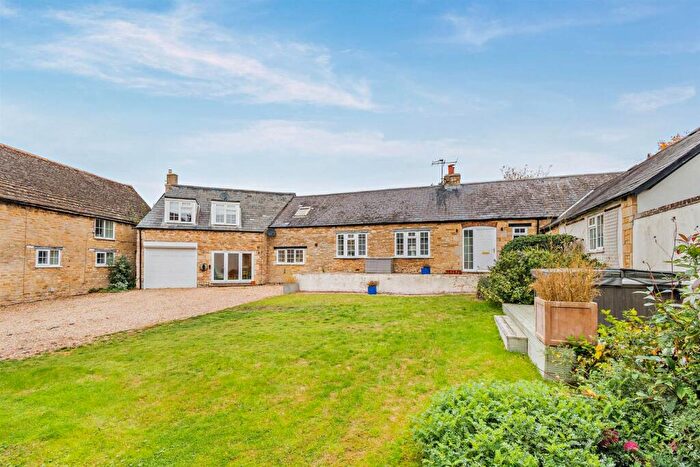
Houses for sale & to rent in Martinsthorpe, Oakham
House Prices in Martinsthorpe
Properties in Martinsthorpe have an average house price of £596,068.00 and had 37 Property Transactions within the last 3 years¹.
Martinsthorpe is an area in Oakham, Rutland with 443 households², where the most expensive property was sold for £1,475,000.00.
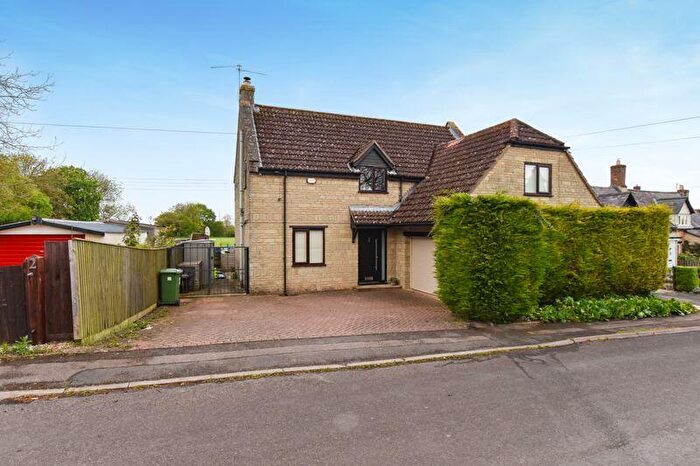
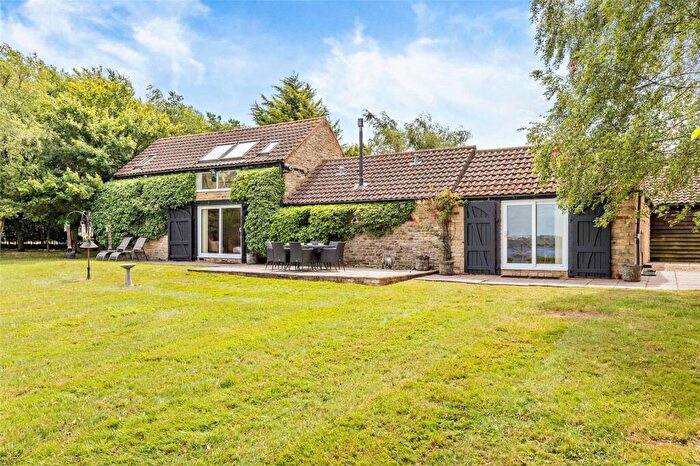
Properties for sale in Martinsthorpe
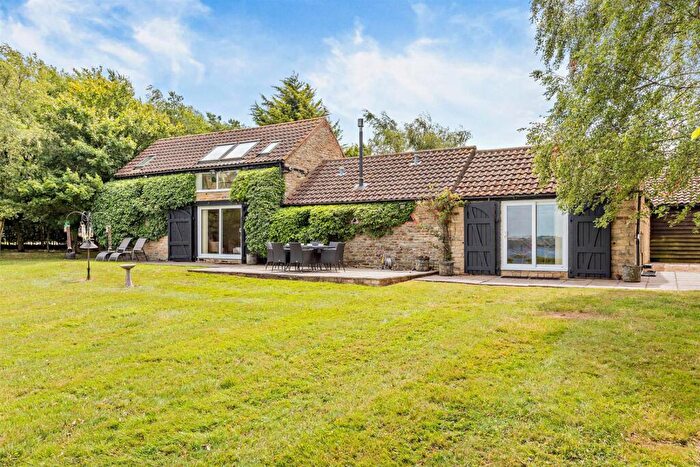
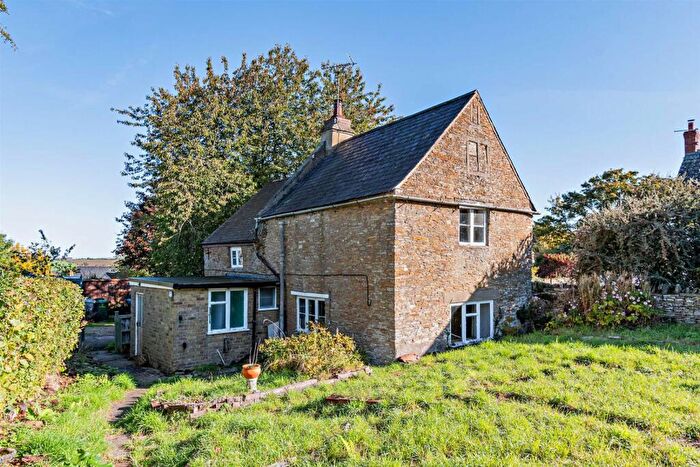
Previously listed properties in Martinsthorpe
Roads and Postcodes in Martinsthorpe
Navigate through our locations to find the location of your next house in Martinsthorpe, Oakham for sale or to rent.
| Streets | Postcodes |
|---|---|
| Back Lane | LE15 9DG |
| Badgers Close | LE15 8SQ |
| Barrowden Road | LE15 9DQ |
| Bottom Street | LE15 8RR |
| Chater Close | LE15 8SW |
| Church Lane | LE15 8SP LE15 9DH |
| Church Road | LE15 8TU |
| Church Street | LE15 8RS |
| Glaston Road | LE15 8RU LE15 9DL |
| High Street | LE15 9DN |
| Luffenham Lane | LE15 9NS |
| Luffenham Road | LE15 8TY LE15 9DW |
| Lyndon Road | LE15 8SR |
| Middle Street | LE15 8RZ |
| Morcott Road | LE15 8SA |
| Mount Pleasant Road | LE15 9DP |
| Pinfold Lane | LE15 9PA |
| Pingle Lane | LE15 9DS |
| Post Office Lane | LE15 8TZ |
| Priory Road | LE15 8ST |
| Reeves Lane | LE15 8SD |
| School Lane | LE15 9DT |
| Seaton Road | LE15 9EB |
| South View Close | LE15 8SX |
| St Marys Road | LE15 8SU |
| Stamford Road | LE15 9DU |
| Station Road | LE15 8RY LE15 9DX |
| Stocks Hill | LE15 8SY |
| The Green | LE15 8TX |
| The Jetty | LE15 8RX |
| Top Street | LE15 8SE |
| Weares Close | LE15 9DB |
| Westhorpe Close | LE15 8RJ |
| Willoughby Road | LE15 9DY |
| Wing Lane | LE15 9NR |
| Wing Road | LE15 8SZ LE15 9DZ |
| Wrendyke Close | LE15 9DD |
Transport near Martinsthorpe
- FAQ
- Price Paid By Year
- Property Type Price
Frequently asked questions about Martinsthorpe
What is the average price for a property for sale in Martinsthorpe?
The average price for a property for sale in Martinsthorpe is £596,068. This amount is 45% higher than the average price in Oakham. There are 140 property listings for sale in Martinsthorpe.
What streets have the most expensive properties for sale in Martinsthorpe?
The streets with the most expensive properties for sale in Martinsthorpe are Post Office Lane at an average of £970,000, Priory Road at an average of £945,000 and Wing Road at an average of £875,000.
What streets have the most affordable properties for sale in Martinsthorpe?
The streets with the most affordable properties for sale in Martinsthorpe are Stocks Hill at an average of £270,500, Station Road at an average of £333,775 and Glaston Road at an average of £351,000.
Which train stations are available in or near Martinsthorpe?
Some of the train stations available in or near Martinsthorpe are Oakham, Stamford and Corby.
Property Price Paid in Martinsthorpe by Year
The average sold property price by year was:
| Year | Average Sold Price | Price Change |
Sold Properties
|
|---|---|---|---|
| 2025 | £593,285 | 9% |
7 Properties |
| 2024 | £541,500 | -15% |
9 Properties |
| 2023 | £620,383 | -17% |
21 Properties |
| 2022 | £723,545 | 24% |
11 Properties |
| 2021 | £550,610 | 3% |
15 Properties |
| 2020 | £536,527 | -4% |
18 Properties |
| 2019 | £556,250 | 0,5% |
10 Properties |
| 2018 | £553,566 | 21% |
15 Properties |
| 2017 | £436,769 | -9% |
13 Properties |
| 2016 | £475,050 | 29% |
22 Properties |
| 2015 | £337,294 | -6% |
10 Properties |
| 2014 | £356,202 | -44% |
23 Properties |
| 2013 | £513,100 | 52% |
5 Properties |
| 2012 | £248,576 | -65% |
13 Properties |
| 2011 | £409,715 | -9% |
16 Properties |
| 2010 | £447,723 | 42% |
17 Properties |
| 2009 | £257,833 | -155% |
15 Properties |
| 2008 | £656,833 | 49% |
8 Properties |
| 2007 | £333,221 | -10% |
21 Properties |
| 2006 | £367,363 | -21% |
11 Properties |
| 2005 | £443,178 | 36% |
14 Properties |
| 2004 | £282,328 | -2% |
19 Properties |
| 2003 | £287,890 | 11% |
21 Properties |
| 2002 | £256,739 | 9% |
16 Properties |
| 2001 | £232,467 | 11% |
17 Properties |
| 2000 | £206,502 | 21% |
27 Properties |
| 1999 | £162,115 | -18% |
13 Properties |
| 1998 | £191,730 | 37% |
13 Properties |
| 1997 | £121,559 | -2% |
25 Properties |
| 1996 | £124,432 | 35% |
23 Properties |
| 1995 | £80,772 | - |
11 Properties |
Property Price per Property Type in Martinsthorpe
Here you can find historic sold price data in order to help with your property search.
The average Property Paid Price for specific property types in the last three years are:
| Property Type | Average Sold Price | Sold Properties |
|---|---|---|
| Semi Detached House | £403,005.00 | 10 Semi Detached Houses |
| Detached House | £735,543.00 | 23 Detached Houses |
| Terraced House | £276,750.00 | 4 Terraced Houses |

