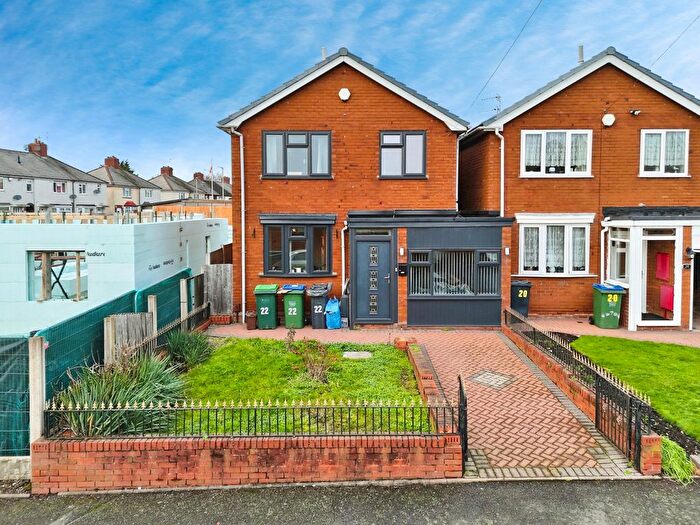
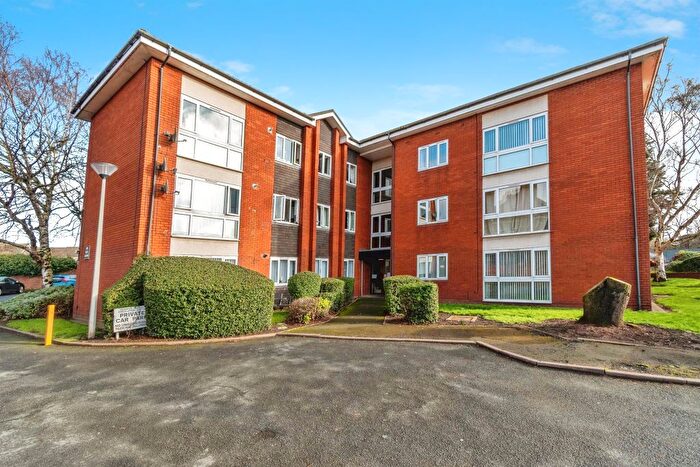
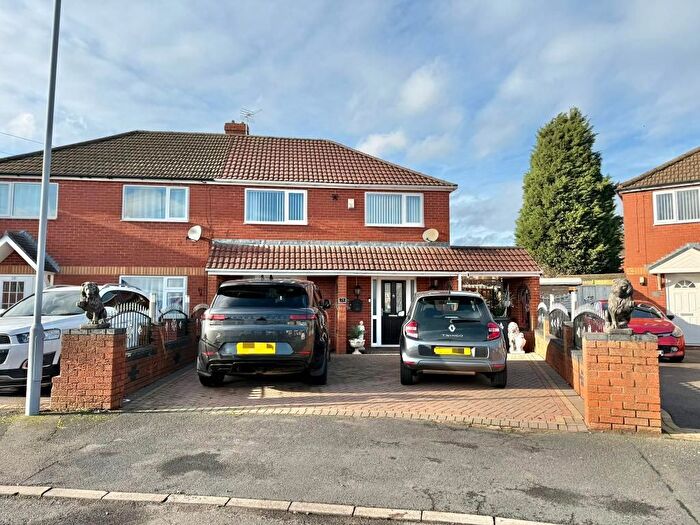
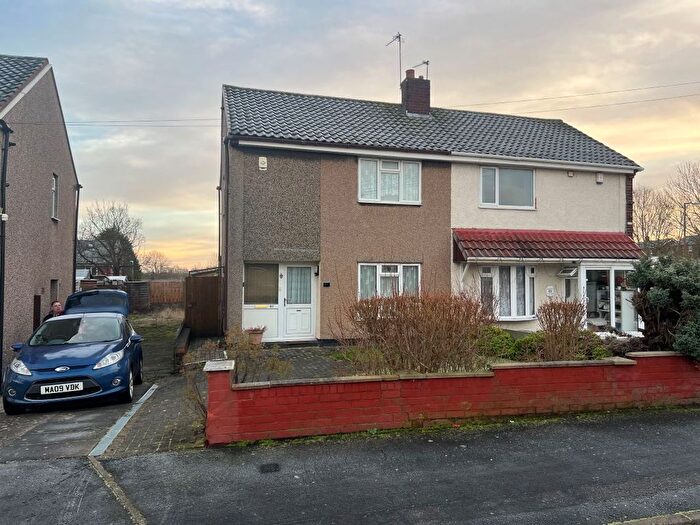
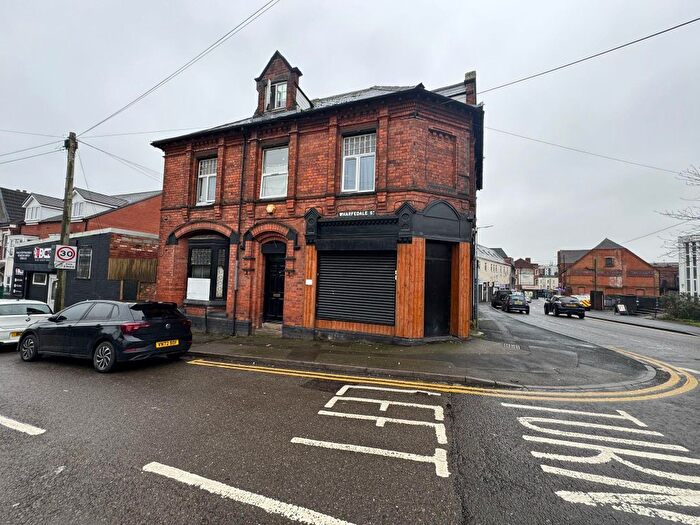
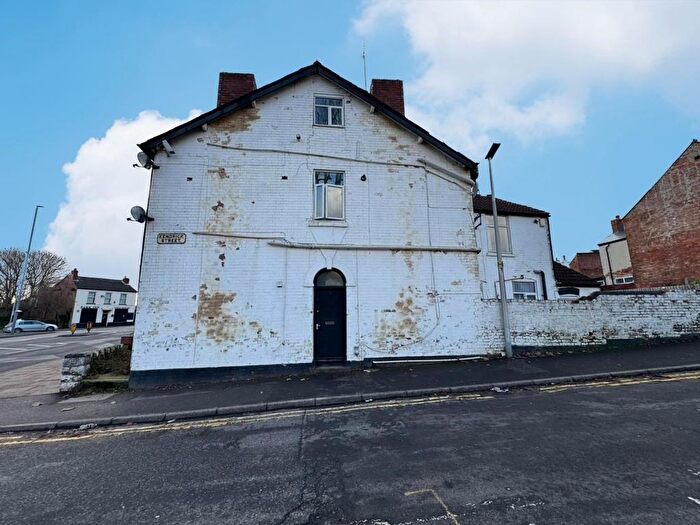
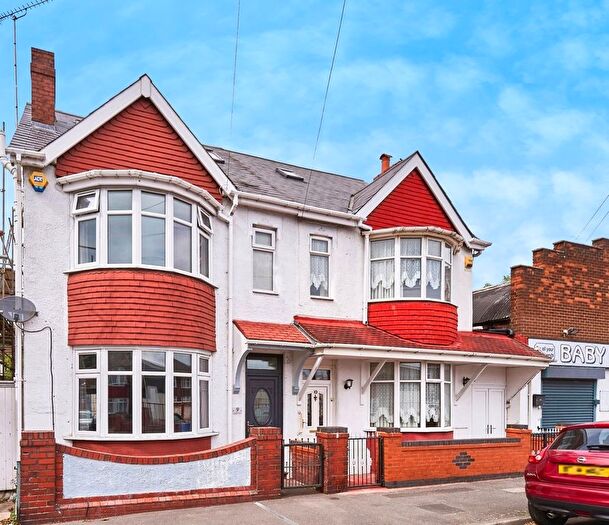
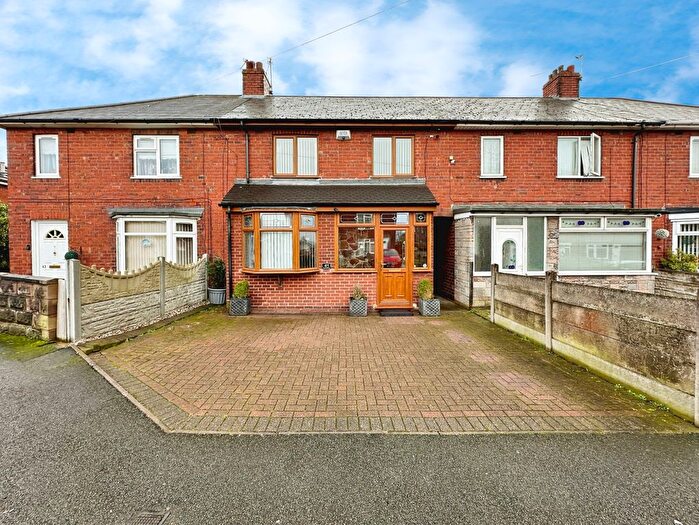
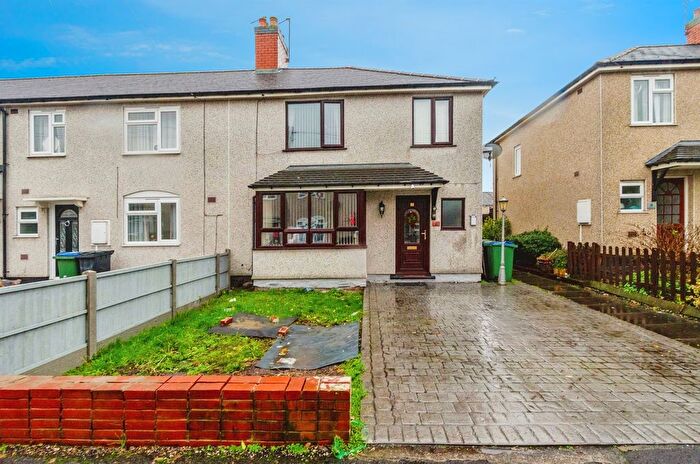
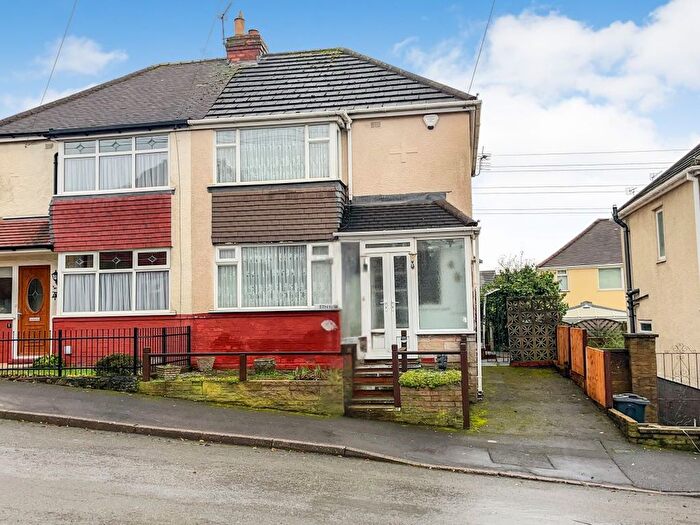
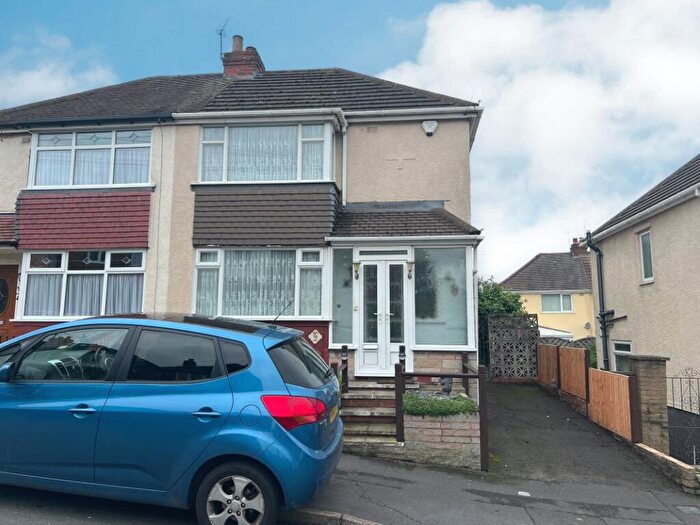
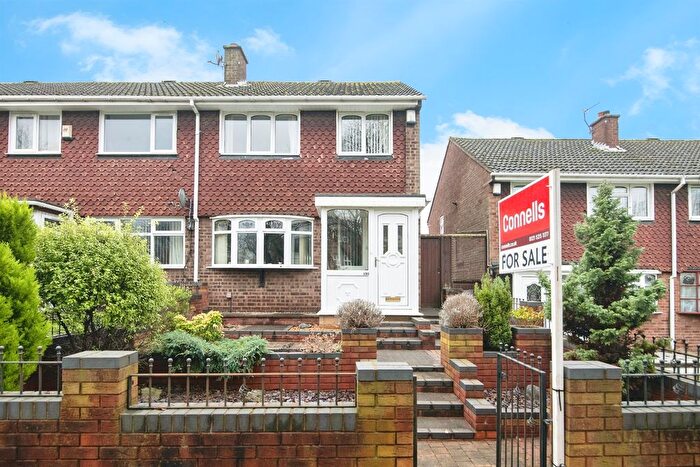
Houses for sale & to rent in Wednesbury South, Wednesbury
House Prices in Wednesbury South
Properties in Wednesbury South have an average house price of £215,601.00 and had 123 Property Transactions within the last 3 years¹.
Wednesbury South is an area in Wednesbury, Sandwell with 1,248 households², where the most expensive property was sold for £2,000,000.00.
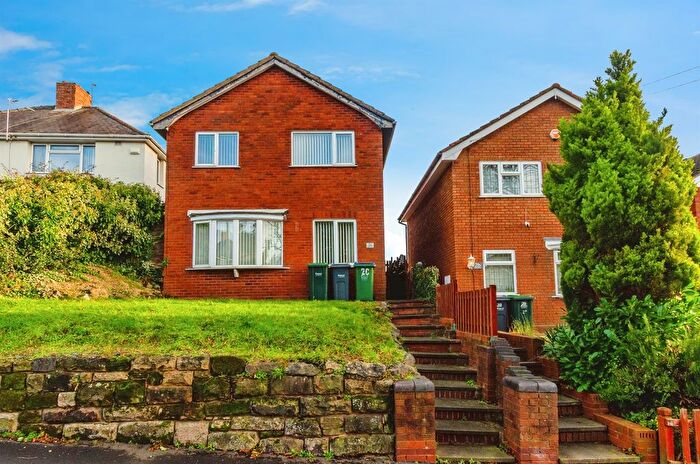
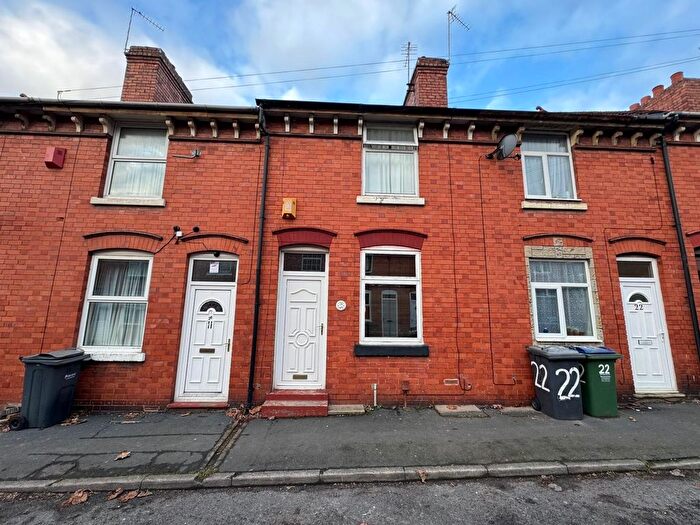
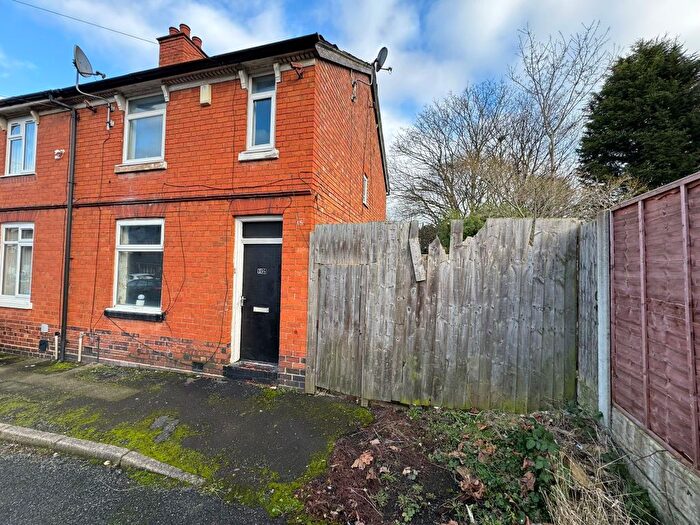
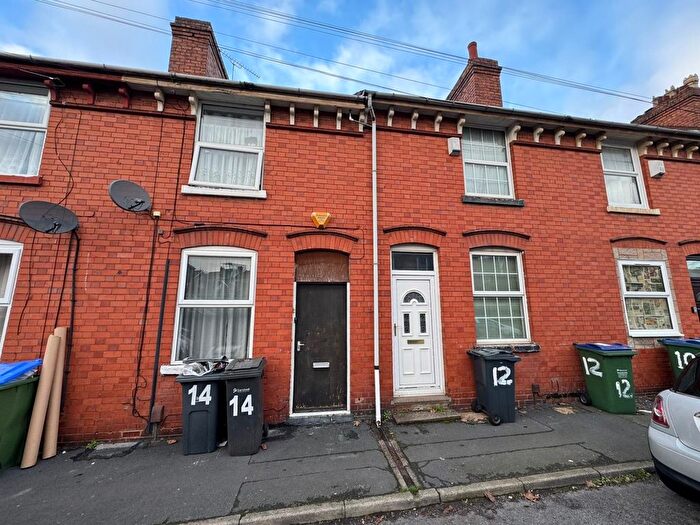
Properties for sale in Wednesbury South
Roads and Postcodes in Wednesbury South
Navigate through our locations to find the location of your next house in Wednesbury South, Wednesbury for sale or to rent.
| Streets | Postcodes |
|---|---|
| Albert Street | WS10 7EW |
| Atlantic Way | WS10 7WW |
| Bagnalls Wharf | WS10 7EL |
| Bannister Road | WS10 7LU |
| Bilport Lane | WS10 0NT WS10 0NU |
| Boswell Close | WS10 7NG |
| Bridge Street | WS10 0AH WS10 0AN WS10 0AQ WS10 0AW |
| Bridge Street Industrial Estate | WS10 0AY |
| Burrs Drive | WS10 0BB |
| Callear Road | WS10 7LX |
| Camp Street | WS10 7AD |
| Cedar Road | WS10 0BD |
| Charlotte Road | WS10 7NE WS10 7NF |
| Cherry Lane | WS10 0BN |
| Chestnut Road | WS10 0BJ WS10 0BQ |
| College Close | WS10 0BT |
| Dudley Street | WS10 7DR WS10 7HE |
| Great Western Street | WS10 7LE WS10 7LL |
| Holden Road | WS10 0DB |
| Holloway Bank | WS10 0NS WS10 0PA |
| Holloway Bank Trading Estate | WS10 0NN |
| Holyhead Road | WS10 7BA WS10 7BB WS10 7BD WS10 7DF WS10 7DJ WS10 1ZA |
| Hydes Road | WS10 0DH WS10 0PU |
| Jenkinson Road | WS10 7NN |
| John Wesley Way | WS10 0BX |
| Lea Avenue | WS10 7NP |
| Leabrook Road | WS10 7NW WS10 7NB |
| Leabrook Road North | WS10 7LY WS10 7WJ |
| Lilac Grove | WS10 0BW |
| Lower High Street | WS10 7AL WS10 7AQ WS10 7AJ WS10 7AP |
| Maple Leaf Road | WS10 7NQ |
| Market Place | WS10 7AX WS10 7AY WS10 7AG WS10 7AT WS10 7AU |
| Mounts Road | WS10 0BZ WS10 0BU |
| New Street | WS10 0AA |
| Ocean Drive | WS10 7WL |
| Old College Drive | WS10 0DD |
| Pacific Avenue | WS10 7WP |
| Perry Street | WS10 0AX WS10 0AZ |
| Potters Lane | WS10 0AS WS10 0AR WS10 0AT WS10 7LH WS10 7NR |
| Rigby Street | WS10 0NP |
| River Walk | WS10 0DE |
| Russell Street | WS10 7AZ |
| Smith Road | WS10 0PB WS10 0PD |
| St Johns Court | WS10 7AE |
| Stafford Street | WS10 7JX |
| Sycamore Road | WS10 0BE WS10 0BG |
| Tame Crossing | WS10 0DT |
| The Shambles | WS10 7DA WS10 7DS |
| Upper Russell Street | WS10 7AR |
| Victoria Street | WS10 7EH |
| Wakes Road | WS10 0BY |
| Walnut Lane | WS10 0BH |
| Waterside Avenue | WS10 0DS |
| Wedgbury Close | WS10 0DA |
| Wigginsmill Road | WS10 7NH |
| Willingsworth Road | WS10 7JU WS10 7NJ WS10 7NL |
| Woden Road South | WS10 0BA WS10 0BP WS10 0BS WS10 0NQ |
| Yew Tree Lane | WS10 0BL |
Transport near Wednesbury South
-
Bescot Stadium Station
-
Tame Bridge Parkway Station
-
Dudley Port Station
-
Tipton Station
-
Coseley Station
-
Sandwell and Dudley Station
-
Walsall Station
- FAQ
- Price Paid By Year
- Property Type Price
Frequently asked questions about Wednesbury South
What is the average price for a property for sale in Wednesbury South?
The average price for a property for sale in Wednesbury South is £215,601. This amount is 11% higher than the average price in Wednesbury. There are 476 property listings for sale in Wednesbury South.
What streets have the most expensive properties for sale in Wednesbury South?
The streets with the most expensive properties for sale in Wednesbury South are Bridge Street at an average of £2,000,000, Hydes Road at an average of £332,500 and Waterside Avenue at an average of £304,000.
What streets have the most affordable properties for sale in Wednesbury South?
The streets with the most affordable properties for sale in Wednesbury South are Russell Street at an average of £58,500, Leabrook Road at an average of £120,250 and Burrs Drive at an average of £121,200.
Which train stations are available in or near Wednesbury South?
Some of the train stations available in or near Wednesbury South are Bescot Stadium, Tame Bridge Parkway and Dudley Port.
Property Price Paid in Wednesbury South by Year
The average sold property price by year was:
| Year | Average Sold Price | Price Change |
Sold Properties
|
|---|---|---|---|
| 2025 | £281,888 | 28% |
26 Properties |
| 2024 | £202,912 | 5% |
50 Properties |
| 2023 | £192,430 | 4% |
47 Properties |
| 2022 | £185,048 | 4% |
37 Properties |
| 2021 | £177,227 | 14% |
44 Properties |
| 2020 | £151,702 | 1% |
40 Properties |
| 2019 | £149,542 | 4% |
39 Properties |
| 2018 | £142,986 | 11% |
56 Properties |
| 2017 | £127,532 | 8% |
43 Properties |
| 2016 | £117,663 | -10% |
36 Properties |
| 2015 | £129,985 | 17% |
35 Properties |
| 2014 | £108,498 | 6% |
37 Properties |
| 2013 | £102,442 | -9% |
56 Properties |
| 2012 | £111,794 | -5% |
28 Properties |
| 2011 | £117,263 | -15% |
70 Properties |
| 2010 | £135,105 | -19% |
31 Properties |
| 2009 | £160,956 | -4% |
22 Properties |
| 2008 | £168,013 | 3% |
53 Properties |
| 2007 | £162,562 | 12% |
81 Properties |
| 2006 | £143,826 | 10% |
127 Properties |
| 2005 | £129,329 | 19% |
44 Properties |
| 2004 | £105,036 | 7% |
25 Properties |
| 2003 | £97,582 | 33% |
17 Properties |
| 2002 | £65,071 | 13% |
28 Properties |
| 2001 | £56,703 | 17% |
29 Properties |
| 2000 | £47,152 | -7% |
26 Properties |
| 1999 | £50,480 | 5% |
28 Properties |
| 1998 | £47,962 | 1% |
20 Properties |
| 1997 | £47,688 | 7% |
18 Properties |
| 1996 | £44,404 | 3% |
23 Properties |
| 1995 | £43,170 | - |
20 Properties |
Property Price per Property Type in Wednesbury South
Here you can find historic sold price data in order to help with your property search.
The average Property Paid Price for specific property types in the last three years are:
| Property Type | Average Sold Price | Sold Properties |
|---|---|---|
| Semi Detached House | £223,579.00 | 50 Semi Detached Houses |
| Detached House | £432,733.00 | 15 Detached Houses |
| Terraced House | £225,013.00 | 18 Terraced Houses |
| Flat | £119,967.00 | 40 Flats |

