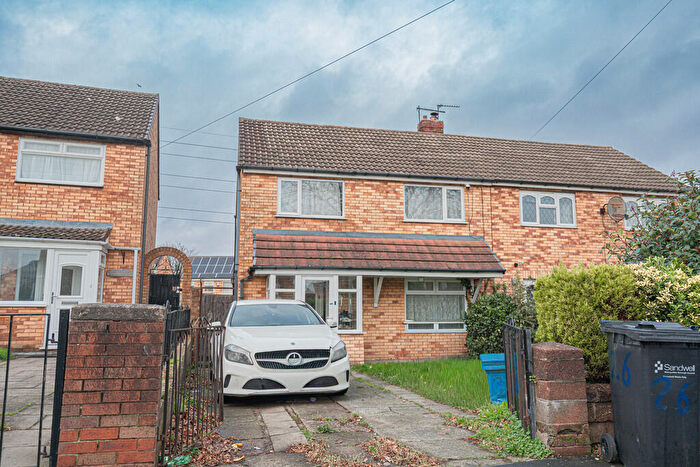
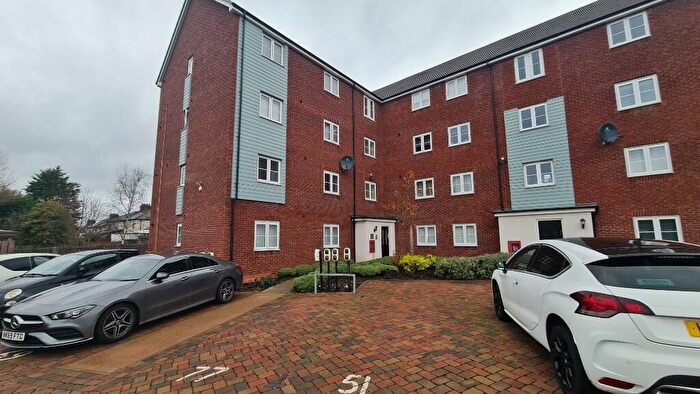
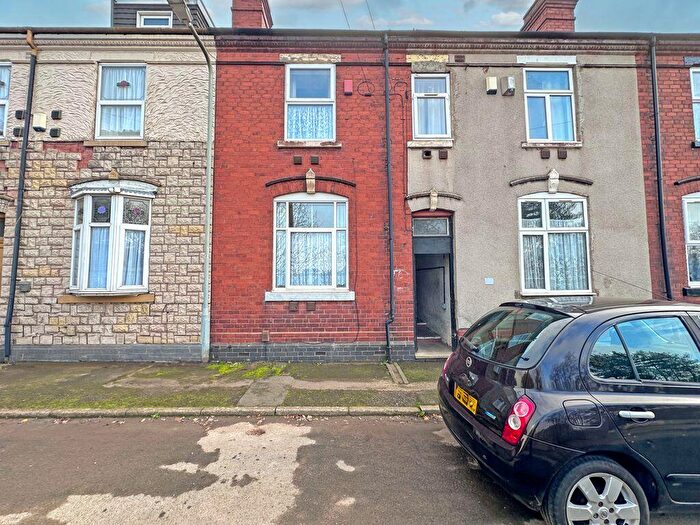
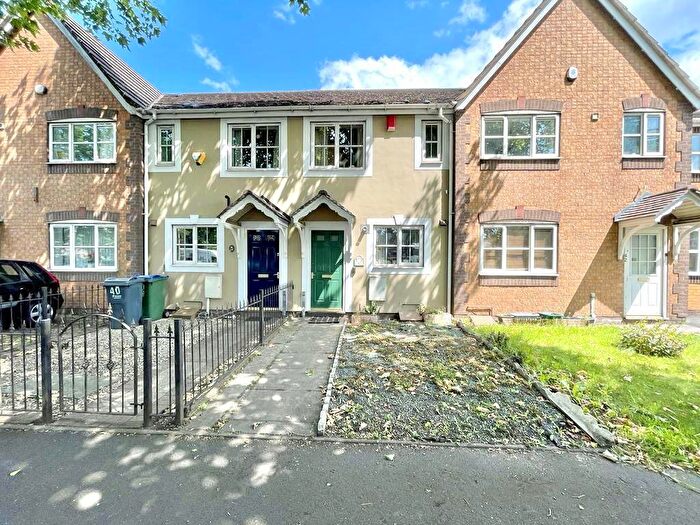
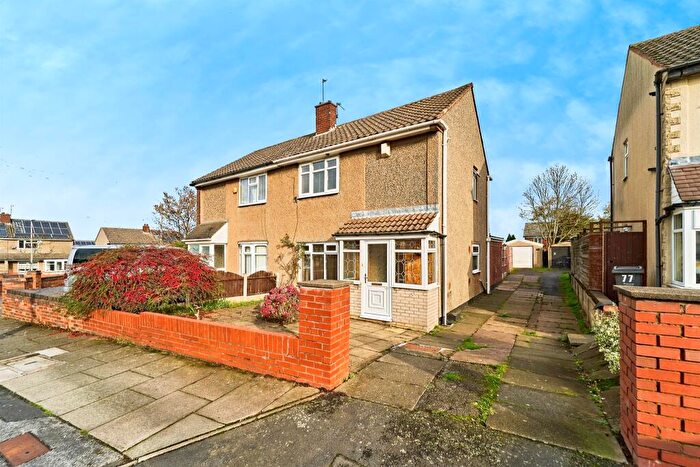
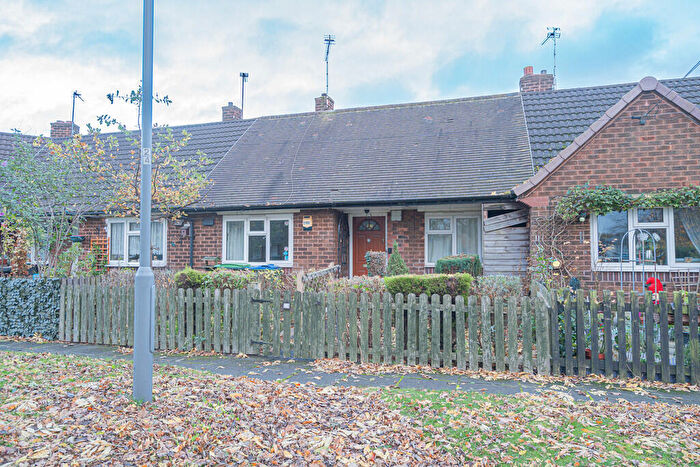
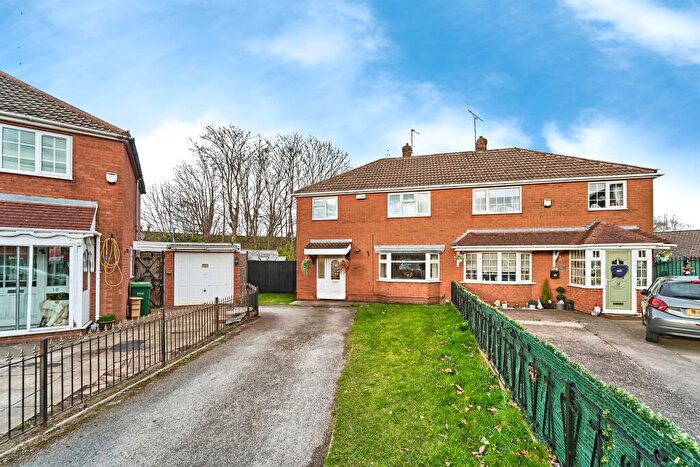
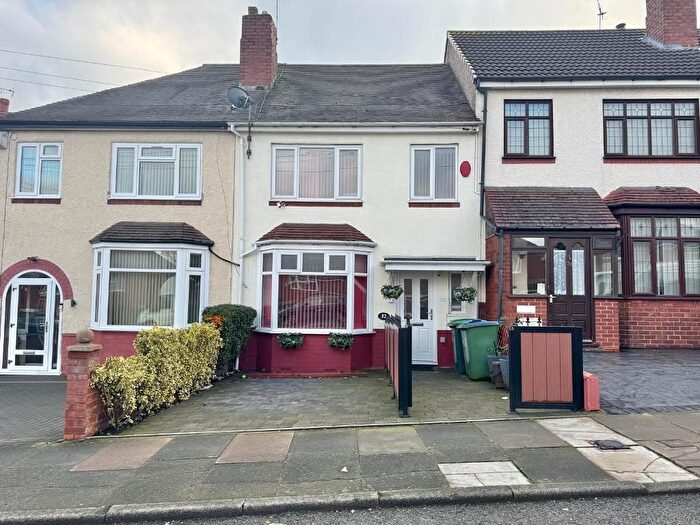
Houses for sale & to rent in Wednesbury South, West Bromwich
House Prices in Wednesbury South
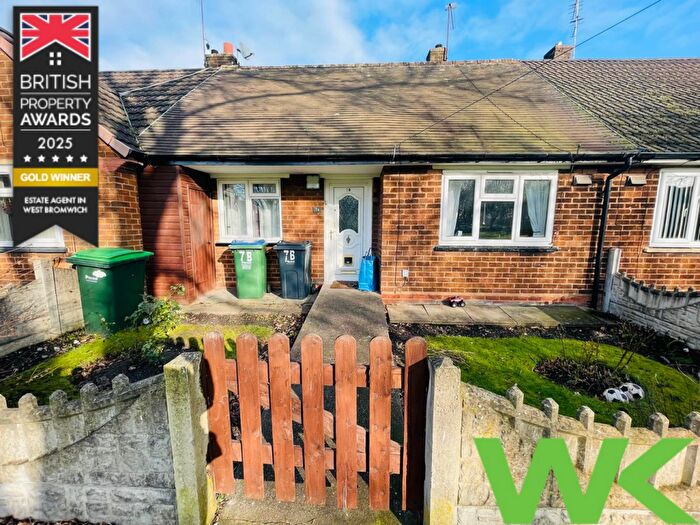
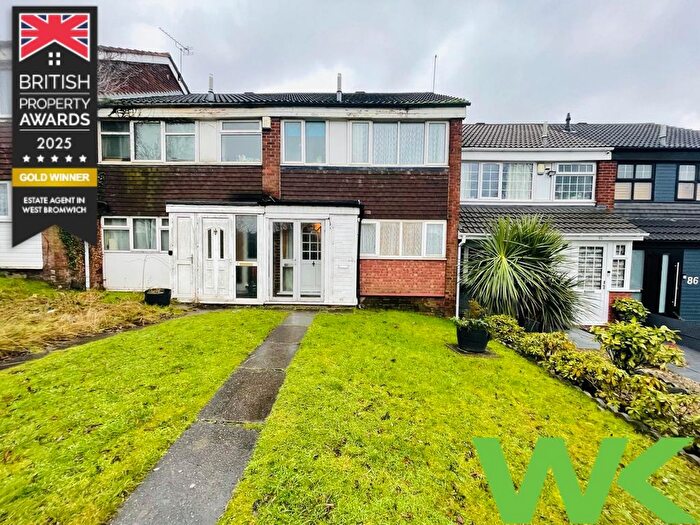
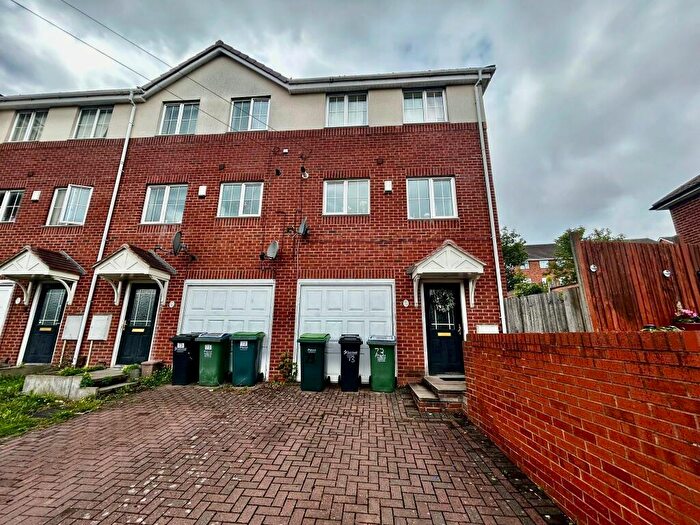
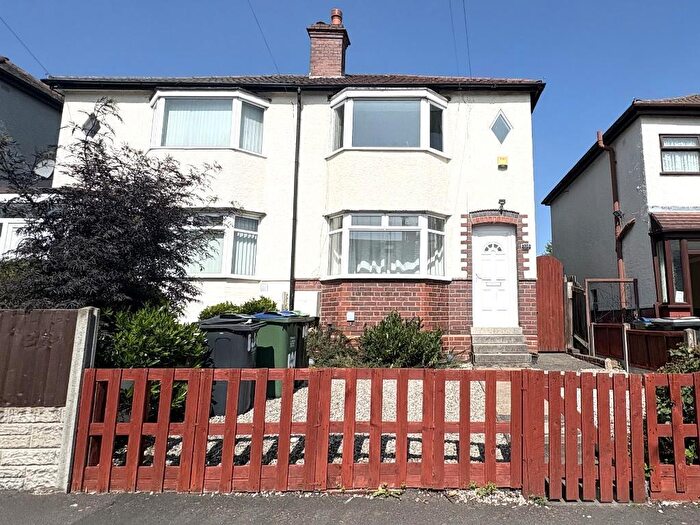
Properties in Wednesbury South have an average house price of £205,179.00 and had 211 Property Transactions within the last 3 years¹.
Wednesbury South is an area in West Bromwich, Sandwell with 3,323 households², where the most expensive property was sold for £375,000.00.
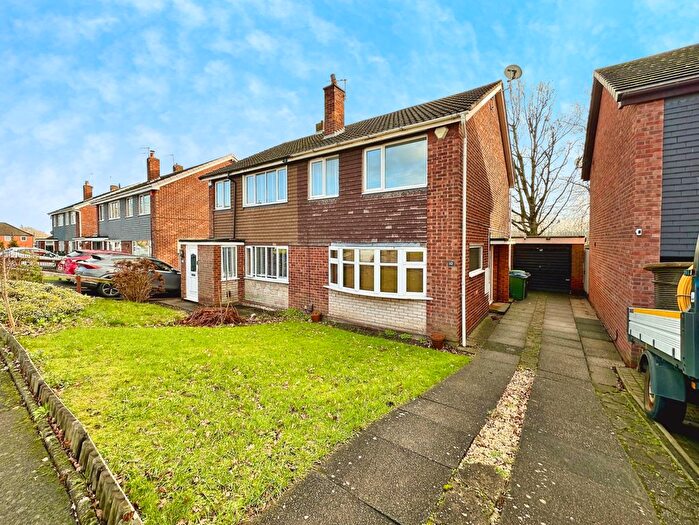
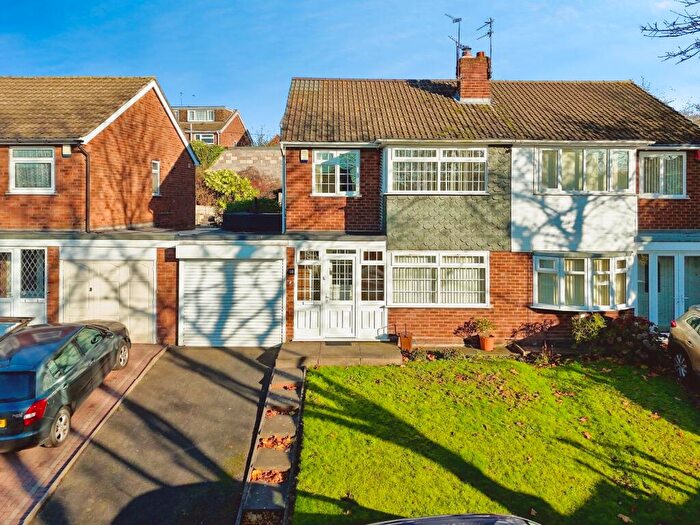
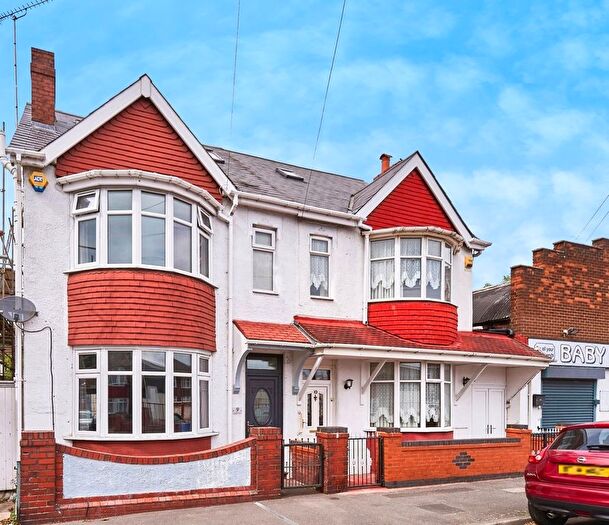
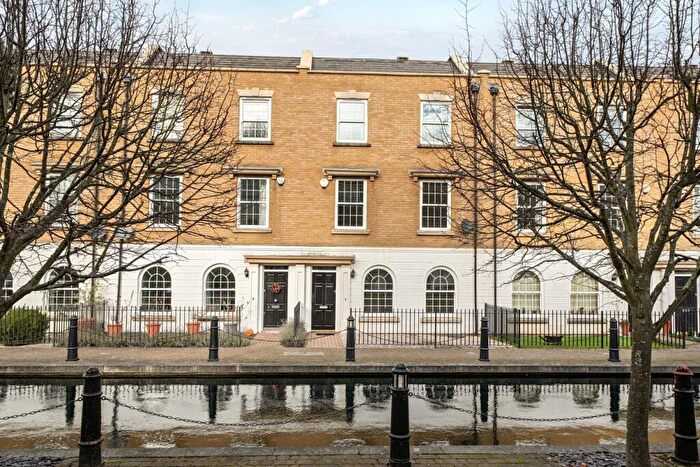
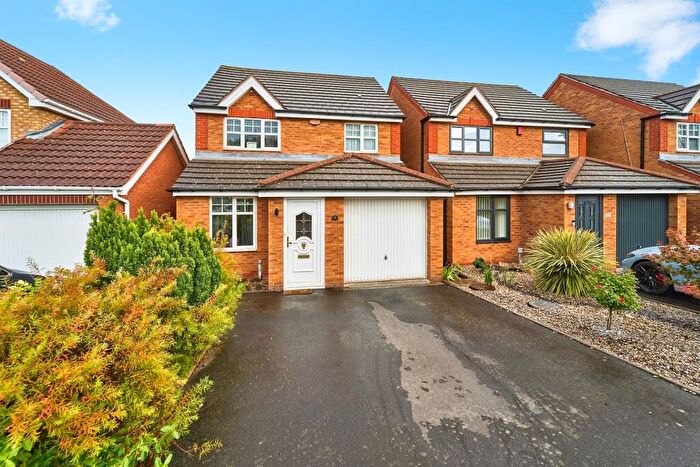
Properties for sale in Wednesbury South
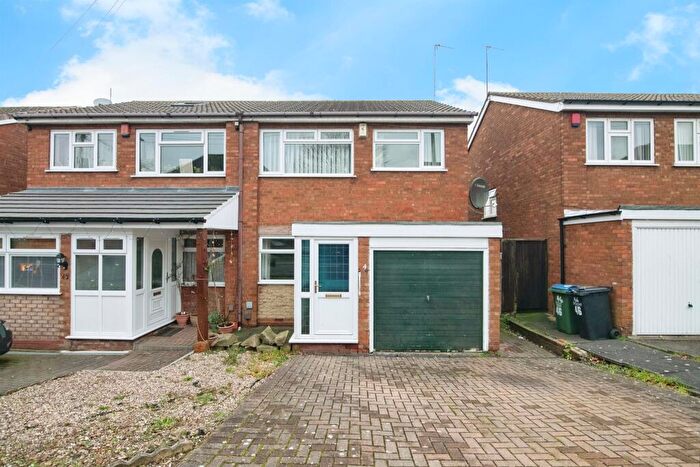
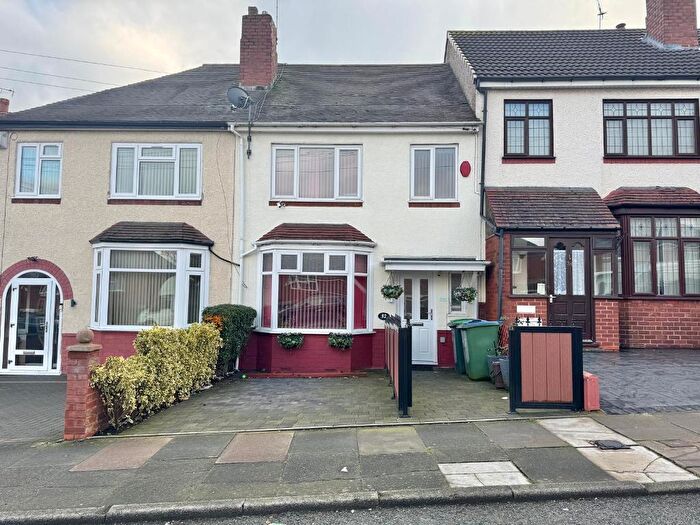
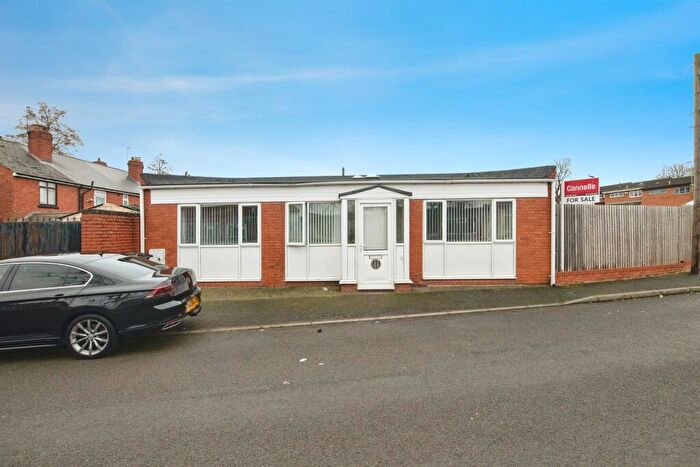
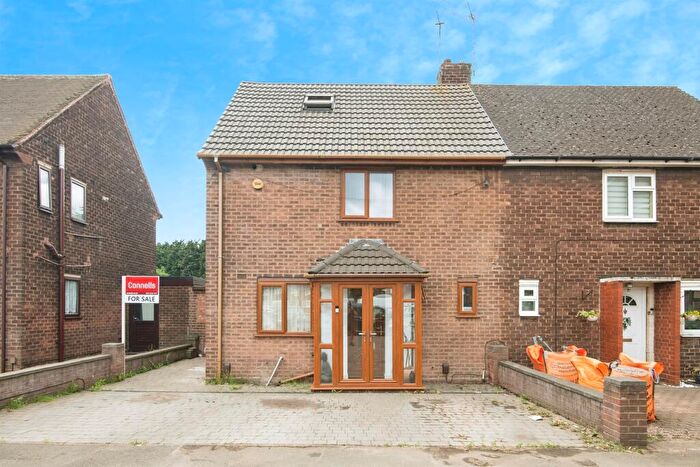
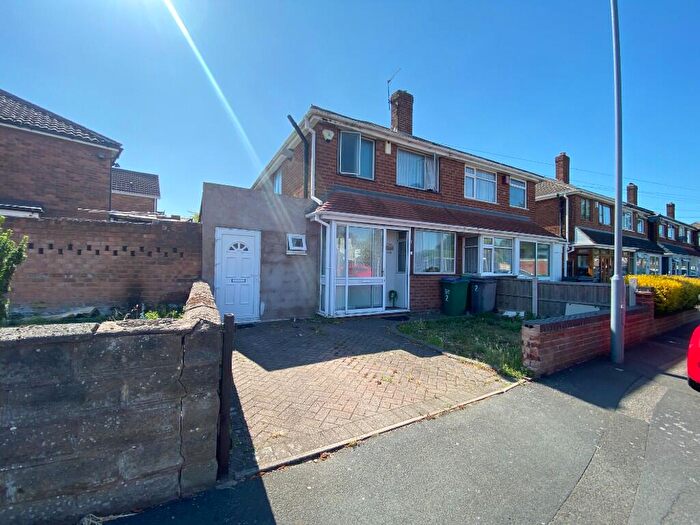
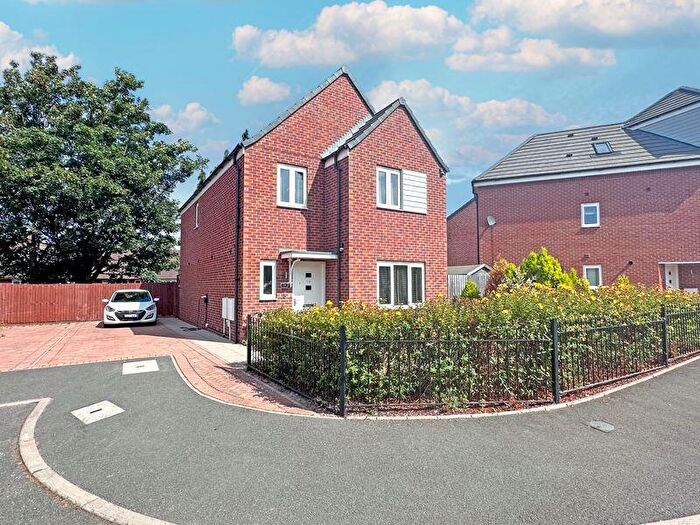
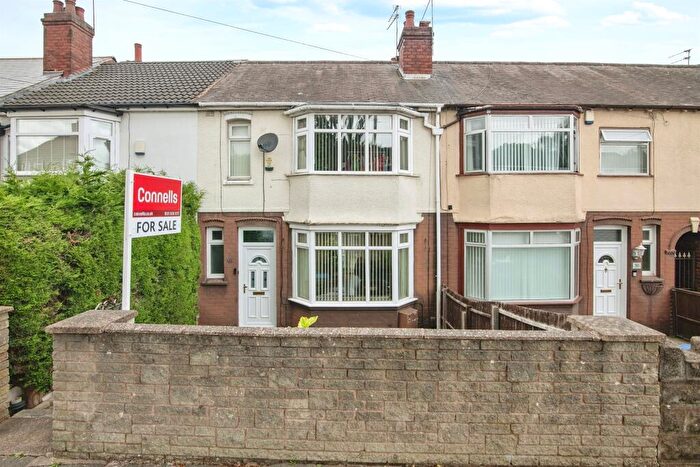
Previously listed properties in Wednesbury South
Roads and Postcodes in Wednesbury South
Navigate through our locations to find the location of your next house in Wednesbury South, West Bromwich for sale or to rent.
| Streets | Postcodes |
|---|---|
| Adelaide Avenue | B70 0SL |
| Anson Road | B70 0LX B70 0LZ B70 0NE B70 0NF B70 0NH B70 0NJ B70 0NA |
| Ardav Road | B70 0QU B70 0RA |
| Ashmole Road | B70 0ND |
| Bagnall Street | B70 0TS B70 0TW |
| Barncroft Street | B70 0QJ |
| Bells Moor Road | B70 0JR B70 0JS B70 0JX |
| Black Lake | B70 0PP B70 0PQ B70 0FR B70 0FS |
| Brickhouse Lane | B70 0DT B70 0EA B70 0DR B70 0DS B70 0DY |
| Brindley Road | B71 2NA B71 2ND |
| Brockhouse Close | B70 0LA |
| Canalside Park | B70 0FQ |
| Canberra Close | B70 0RL |
| Castle Street | B70 0RG B70 0RN B70 0RQ B70 0RW |
| Chester Road | B71 2PE B71 2PF B71 2PG B71 2PQ |
| Coles Lane | B71 2QA B71 2QJ B71 2QW |
| Conway Avenue | B71 2PB |
| Crookhay Lane | B71 2NE B71 2NG B71 2NQ B71 2NF |
| Dial Lane | B70 0EE B70 0EF B70 0EG B70 0EQ B70 0EB B70 0LL |
| Ebenezer Street | B70 0HX B70 0HY B70 0JB B70 0PF |
| Edwin Phillips Drive | B71 2AZ |
| Emay Close | B70 0QX |
| Finchpath Road | B70 0JJ |
| Francis Ward Close | B71 2PY B71 2PZ |
| Greatorex Court | B71 2AD |
| Greenwood Road | B71 2AL |
| Hampshire Road | B71 2PP B71 2PR B71 2PS B71 2PX B71 2PU |
| Harvills Hawthorn | B70 0UF B70 0UQ B70 0UD B70 0UH |
| Hawkes Lane | B70 0SF |
| Hawkestone Crescent | B70 0JD |
| Hawkins Street | B70 0QR B70 0QS |
| Hawthorn Road | B70 0LB |
| Heronville Drive | B70 0HS |
| Heronville Road | B70 0JE B70 0JF B70 0JG B70 0JQ |
| Hill Top | B70 0PS B70 0PU B70 0RU B70 0RZ B70 0SD B70 0SH B70 0RT |
| Holloway Bank | B70 0QH B70 0QQ B70 0QG |
| Howard Street | B70 0ST B70 0SN |
| Isaac Walton Place | B70 0LT |
| James Watt Street | B71 2AH B71 2AJ |
| Jefferson Close | B71 2AR |
| John Woodward Way | B70 0FF |
| Kalum Drive | B70 0PT |
| Lahmber Way | B70 0FT |
| Lakeside Road | B70 0PN B70 0PW |
| Laura Roberts Close | B70 0FJ |
| Leacroft Grove | B71 2QP |
| Lee Street | B70 0QY B70 0QZ |
| Lemox Road | B70 0QT |
| Mani Lane | B70 0FP |
| Marmion Way | B70 0LJ |
| Melbourne Close | B70 0SP |
| Meyrick Road | B70 0JL B70 0JN B70 0JP B70 0JW |
| Millfields Close | B71 2NR |
| Millfields Road | B71 2NP B71 2NS B71 2PA |
| Mostyn Crescent | B71 2QH |
| New Gas Street | B70 0NP |
| New Heart Road | B70 0GD |
| New Street | B70 0HN B70 0HW B70 0HZ |
| New Swan Lane | B70 0FU |
| Norbury Road | B70 0HP B70 0HR |
| Oakley Gardens | B70 0EH |
| Pankhurst Close | B70 0LW |
| Parkside Place | B70 0SJ |
| Pemberton Road | B70 0JH B70 0JY B70 0JZ |
| Pembroke Close | B71 2NJ |
| Pembroke Road | B71 2NH B71 2NN B71 2NU B71 2NW |
| Perry Place | B70 0PE |
| Peters Street | B70 0HT |
| Pikehelve Street | B70 0TU |
| Pleasant Street | B70 0RE B70 0RF |
| Portobello Road | B70 0QL |
| Poultney Street | B70 0LD |
| Richmond Street | B70 0DD |
| Rydding Square | B71 2AB |
| Schofield Avenue | B71 2AN B71 2AP B71 2AS B71 2AW |
| Shaw Street | B70 0TX B70 0TY |
| Siddons Factory Estate | B70 0SU B70 0TB |
| Siddons Way | B70 0RX |
| Spartan Industrial Centre | B70 0DH |
| St Pauls Crescent | B70 0TR |
| St Vincent Crescent | B70 0LE B70 0LG B70 0LH B70 0LN B70 0LQ B70 0LF |
| Surrey Crescent | B71 2PN B71 2PT B71 2PW |
| Sydney Close | B70 0SR |
| Tame Street | B70 0QP |
| Telford Close | B71 2NB |
| The Bantocks | B70 0PA B70 0PB |
| The Broadway | B71 2QG B71 2QQ |
| The Bungalows | B70 0DZ |
| Thomas Guy Road | B70 0NL |
| Tunnel Road | B70 0RB B70 0RH B70 0FG B70 0RD B70 0RJ B70 0FW |
| Warwick Close | B70 0TP |
| Waterside Street | B70 0GA B70 0GB |
| Wedgewood Avenue | B70 0FH |
| Wedgewood Place | B70 0LY |
| Winchester Road | B71 2NY B71 2NZ |
| Windsor Road | B71 2NL B71 2NT B71 2NX |
| Witton Lane | B71 2AA B71 2AE B71 2AF B71 2AG B71 2AQ B71 2AT B71 2AU |
| Wolseley Road | B70 0LP B70 0LR B70 0LS B70 0LU B70 0NB B70 0NQ B70 0NG |
| Wyld Close | B71 2AY |
| Wyntor Lane | B71 2HN |
| York Crescent | B70 0JT B70 0JU |
| B70 0SB B70 0TQ |
Transport near Wednesbury South
-
Dudley Port Station
-
Tame Bridge Parkway Station
-
Bescot Stadium Station
-
Sandwell and Dudley Station
-
Tipton Station
-
Smethwick Galton Bridge Station
- FAQ
- Price Paid By Year
- Property Type Price
Frequently asked questions about Wednesbury South
What is the average price for a property for sale in Wednesbury South?
The average price for a property for sale in Wednesbury South is £205,179. This amount is 2% higher than the average price in West Bromwich. There are 684 property listings for sale in Wednesbury South.
What streets have the most expensive properties for sale in Wednesbury South?
The streets with the most expensive properties for sale in Wednesbury South are The Bantocks at an average of £305,000, Laura Roberts Close at an average of £301,000 and Pankhurst Close at an average of £280,000.
What streets have the most affordable properties for sale in Wednesbury South?
The streets with the most affordable properties for sale in Wednesbury South are Millfields Close at an average of £75,000, Heronville Drive at an average of £87,000 and Lee Street at an average of £122,000.
Which train stations are available in or near Wednesbury South?
Some of the train stations available in or near Wednesbury South are Dudley Port, Tame Bridge Parkway and Bescot Stadium.
Property Price Paid in Wednesbury South by Year
The average sold property price by year was:
| Year | Average Sold Price | Price Change |
Sold Properties
|
|---|---|---|---|
| 2025 | £215,606 | 9% |
54 Properties |
| 2024 | £195,564 | -6% |
78 Properties |
| 2023 | £207,546 | 5% |
79 Properties |
| 2022 | £196,610 | 16% |
102 Properties |
| 2021 | £164,265 | 10% |
94 Properties |
| 2020 | £148,361 | -19% |
75 Properties |
| 2019 | £175,901 | 13% |
137 Properties |
| 2018 | £153,034 | 4% |
145 Properties |
| 2017 | £147,459 | 4% |
113 Properties |
| 2016 | £141,508 | 15% |
114 Properties |
| 2015 | £120,632 | 10% |
98 Properties |
| 2014 | £108,306 | -0,3% |
68 Properties |
| 2013 | £108,629 | 7% |
51 Properties |
| 2012 | £101,448 | -4% |
39 Properties |
| 2011 | £105,875 | 4% |
48 Properties |
| 2010 | £102,149 | -15% |
46 Properties |
| 2009 | £117,940 | -11% |
48 Properties |
| 2008 | £130,509 | 3% |
97 Properties |
| 2007 | £126,629 | 14% |
195 Properties |
| 2006 | £109,387 | 13% |
99 Properties |
| 2005 | £95,432 | 5% |
100 Properties |
| 2004 | £90,399 | 12% |
103 Properties |
| 2003 | £79,781 | 25% |
103 Properties |
| 2002 | £59,657 | 3% |
118 Properties |
| 2001 | £58,133 | 17% |
146 Properties |
| 2000 | £48,003 | 3% |
93 Properties |
| 1999 | £46,458 | 1% |
94 Properties |
| 1998 | £45,957 | 10% |
53 Properties |
| 1997 | £41,147 | -5% |
51 Properties |
| 1996 | £43,210 | 9% |
78 Properties |
| 1995 | £39,527 | - |
52 Properties |
Property Price per Property Type in Wednesbury South
Here you can find historic sold price data in order to help with your property search.
The average Property Paid Price for specific property types in the last three years are:
| Property Type | Average Sold Price | Sold Properties |
|---|---|---|
| Flat | £110,500.00 | 11 Flats |
| Semi Detached House | £207,863.00 | 120 Semi Detached Houses |
| Detached House | £271,428.00 | 14 Detached Houses |
| Terraced House | £202,027.00 | 66 Terraced Houses |

