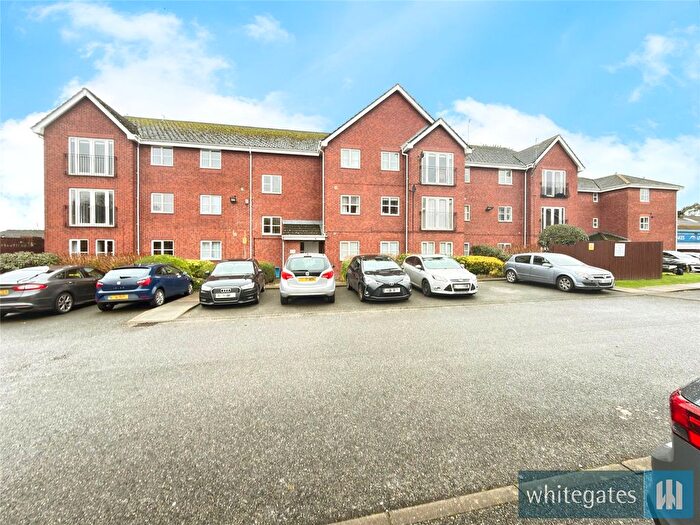
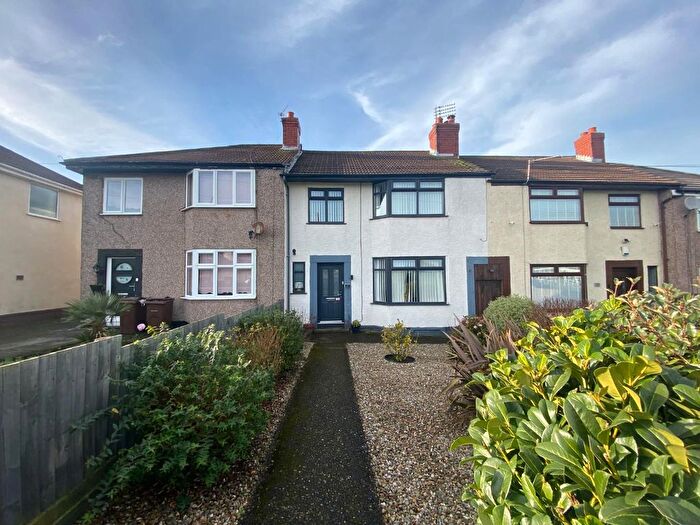
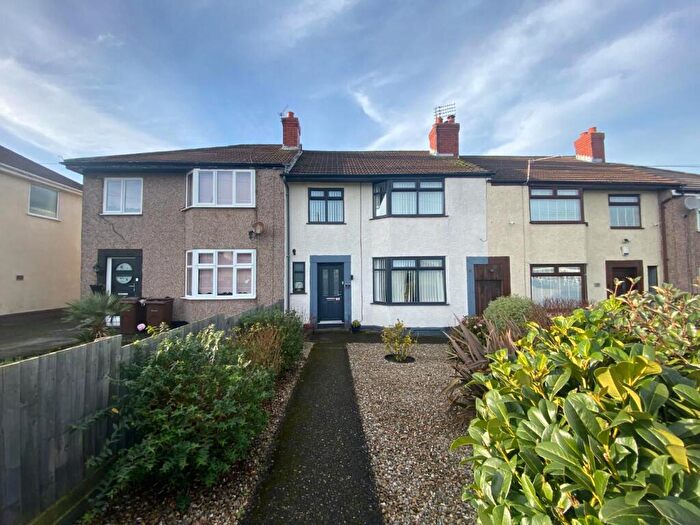
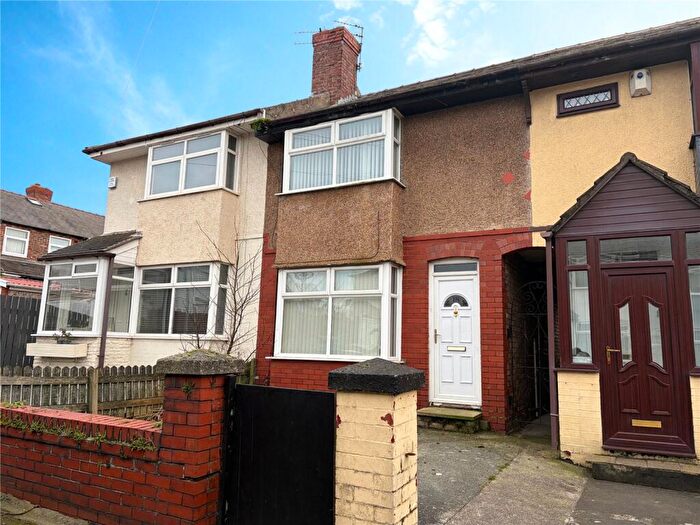
Houses for sale & to rent in Ford, Liverpool
House Prices in Ford
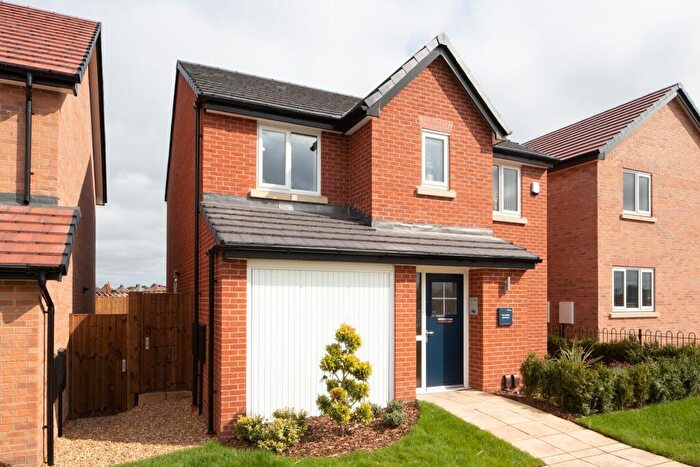
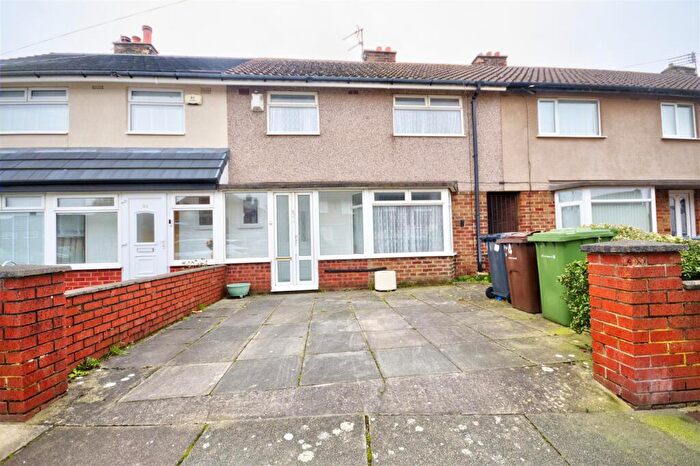
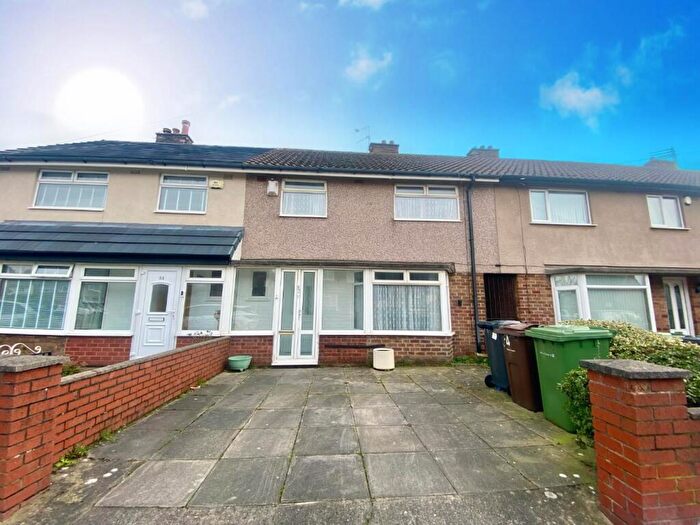
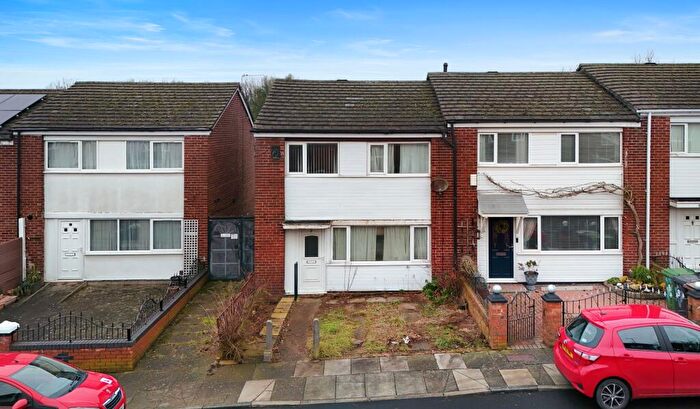
Properties in Ford have an average house price of £165,038.00 and had 274 Property Transactions within the last 3 years¹.
Ford is an area in Liverpool, Sefton with 4,772 households², where the most expensive property was sold for £839,000.00.
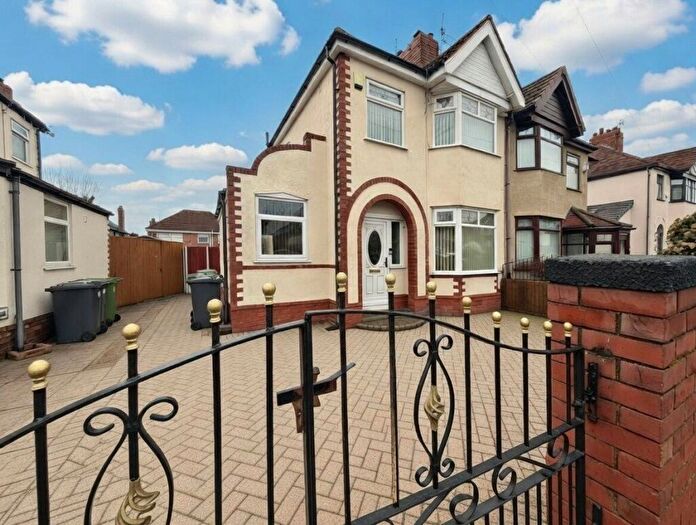
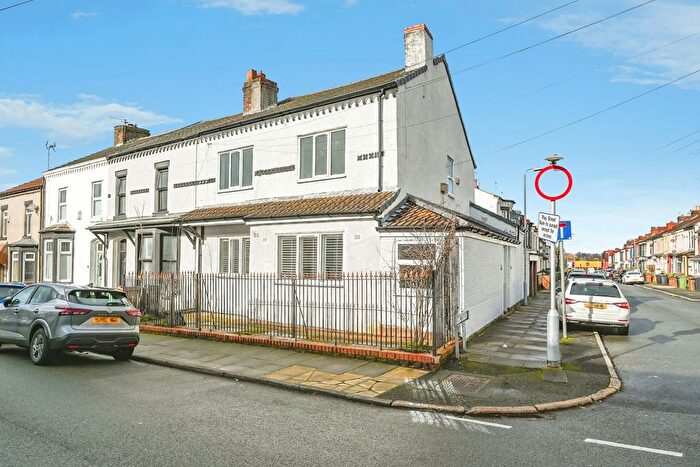
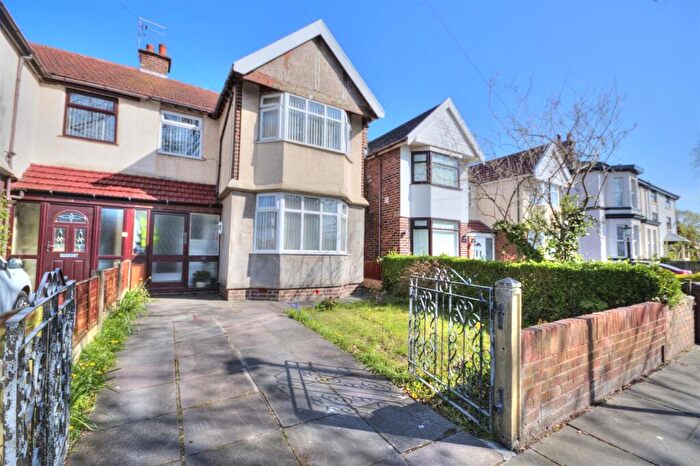
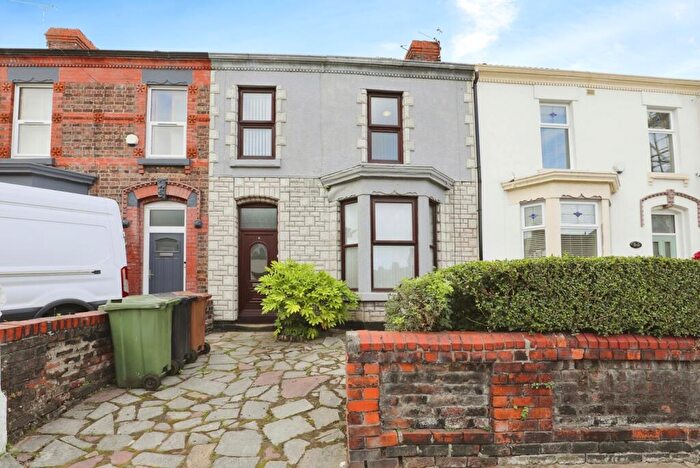
Properties for sale in Ford
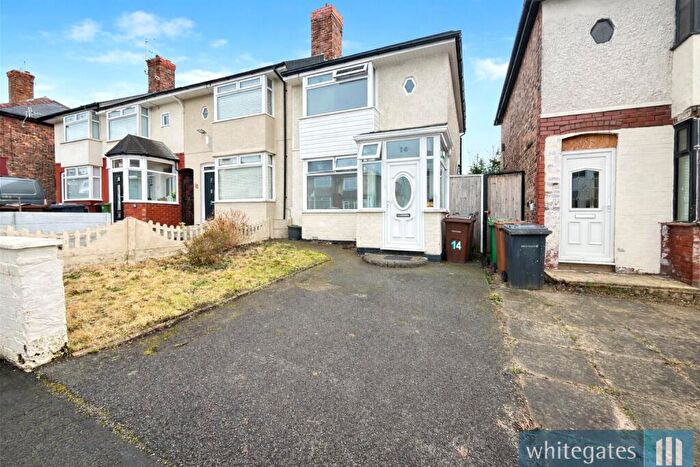
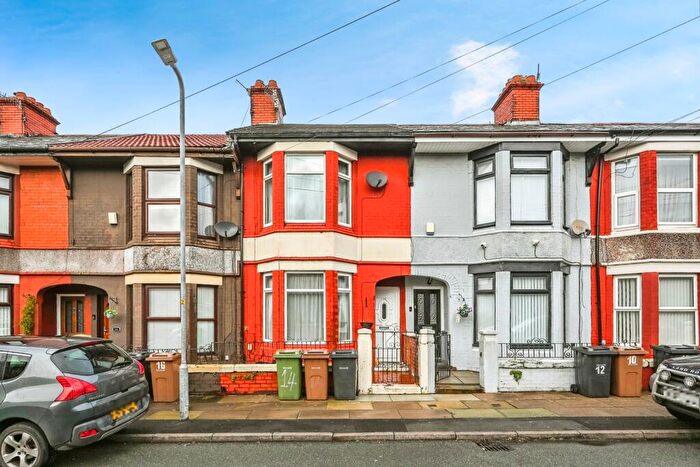
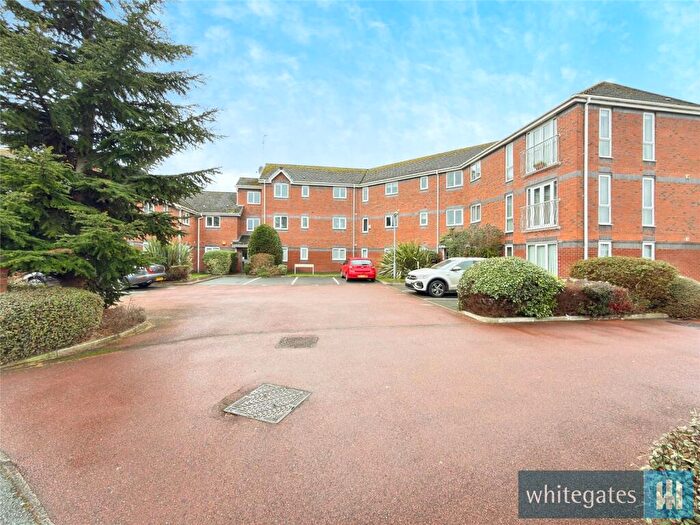
Previously listed properties in Ford
Roads and Postcodes in Ford
Navigate through our locations to find the location of your next house in Ford, Liverpool for sale or to rent.
| Streets | Postcodes |
|---|---|
| Alexandra Mount | L21 7PN |
| Alton Avenue | L21 9NN |
| Alwyn Avenue | L21 9NY L21 9NZ |
| Amethyst Close | L21 7RD |
| Amos Avenue | L21 7QH |
| Anderson Road | L21 7NE L21 7NF L21 7NG L21 7NQ L21 7ND |
| Anderson Way | L21 7QS |
| Appleton Road | L21 9NJ |
| Bark Road | L21 7QN L21 7QP L21 7QW |
| Barton Close | L21 9NT |
| Boundary Road | L21 7LA |
| Bradley Road | L21 7QE L21 7QF |
| Brendon Avenue | L21 9NW |
| Bridge Croft | L21 0HJ |
| Bridgewater Close | L21 9NS |
| Brindley Close | L21 9NR |
| Brunel Drive | L21 9LN L21 9LP L21 9LW |
| Caldon Close | L21 9PZ |
| Caledonian Crescent | L21 9QA |
| Cambridge Avenue | L21 7LU |
| Carr Croft | L21 0HH |
| Church Road | L21 7LE L21 7LF L21 7LH L21 7LJ L21 7LL L21 7LN L21 7LQ L21 7LW |
| Condron Road North | L21 7GD |
| Condron Road South | L21 7GB |
| Cross Hey | L21 0ER |
| Cumpsty Road | L21 9HX L21 9HY L21 9HZ L21 9JA L21 9JB |
| Daley Road | L21 7QG L21 7QQ |
| Ebenezer Howard Road | L21 0EB |
| Edgar Court | L21 9PR |
| Eltham Avenue | L21 9LL |
| Enstone Avenue | L21 9LH |
| Farm View | L21 0EL |
| Ferguson Road | L21 9HU |
| Field Avenue | L21 9NG |
| Field Lane | L21 9LS L21 9LU L21 9LY L21 9NB L21 9NE L21 9NF L21 9QB L21 9QD L21 9QE L21 9QQ L21 9LX L21 9PJ |
| Field View | L21 9NQ |
| Ford Close | L21 0EP |
| Ford Lane | L21 0HG L21 0HL L21 0HN L21 0HP L21 0HQ L21 0HR L21 0HT L21 0HS L21 0HW |
| Ford View | L21 0EU |
| Four Acre Drive | L21 0EN L21 0ES L21 0ET L21 0EW |
| Gale Road | L21 7QR |
| Gorsey Lane | L21 0DE L21 0DF L21 0DG L21 0DH L21 0DJ L21 0DQ |
| Green Lane | L21 0DN L21 0DW |
| Greenfield Lane | L21 9NP |
| Harrington Road | L21 7NA L21 7NB |
| Hatton Hill Road | L21 9JH L21 9JJ L21 9JL L21 9JN L21 9JP L21 9JW L21 9LE L21 9LF L21 9LG L21 9LQ L21 9PH |
| Hawthorne Court | L21 7PA |
| Hawthorne Road | L21 7PJ |
| Heathview | L21 0HA |
| Highfield Road | L21 9NH |
| Howard Close | L21 0HU |
| Hythe Avenue | L21 7QB |
| Jersey Avenue | L21 9LA |
| Kent Avenue | L21 7QJ |
| Kirkstone Road North | L21 9HH L21 9HL L21 7NP L21 7NR L21 7NS L21 7NT L21 7NU L21 9PE |
| Kirkstone Road West | L21 0EG L21 0EQ |
| Litherland Park | L21 9HP L21 9HR |
| Lonsdale Road | L21 0DR L21 0DS L21 0DP L21 0JZ |
| Lowden Avenue | L21 9JE L21 9JF |
| Marina Avenue | L21 7PE L21 7PF L21 7PP |
| Mead Avenue | L21 7QL |
| Meadow View | L21 0HB |
| Mitchell Crescent | L21 9JD L21 9PF |
| Moss Bank Park | L21 9PL |
| Moss Lane | L21 7NJ L21 7NL L21 7NN L21 7NW L21 7PR L21 7PS L21 7PT L21 7RF L21 7NH L21 7RJ |
| Moss View | L21 7PX |
| Newlyn Avenue | L21 9LD |
| Norwood Avenue | L21 9HT |
| Nunsford Close | L21 0JW |
| Oatfield Lane | L21 0EY L21 0EZ |
| Octavia Hill Road | L21 0DY L21 0DZ |
| Opal Close | L21 7RE |
| Osborne Road | L21 9HN L21 9HW |
| Overton Avenue | L21 9LB |
| Oxford Avenue | L21 7LT |
| Pankhurst Road | L21 0EE L21 0EF |
| Quartz Way | L21 7RA |
| Richard Martin Road | L21 0ED |
| Ripley Avenue | L21 9LR |
| Robinson Road | L21 7QZ |
| Ruby Close | L21 7RH |
| Rye Croft | L21 0EX |
| Ryefield Lane | L21 0HE L21 0HF L21 0HD |
| School Lane | L21 7LY L21 7LZ L21 3TQ L21 7LX |
| Sefton Moss Villas | L21 7QX L21 7QY |
| Sefton Road | L21 7PG L21 7PQ L21 7QU L21 9HA L21 9HD L21 9HE L21 9HF L21 9HG L21 9HQ L21 9HB |
| Sefton Street | L21 7PD L21 7LB |
| Sefton View | L21 7QA |
| Soma Avenue | L21 7QD |
| Sonning Avenue | L21 9JG L21 9JQ L21 9JY L21 9JZ |
| Springfield Avenue | L21 7PY L21 7PZ |
| Stanley Park | L21 9JR L21 9JS L21 9JT L21 9JU |
| Stanton Avenue | L21 9LJ |
| Sterrix Green | L21 0JP |
| Sterrix Lane | L21 0DA L21 0DD L21 0DB |
| Tannery Close | L21 9LZ |
| Tenby Avenue | L21 9NL |
| The Oaks | L21 9ND |
| Townsend View | L21 0EA |
| Trent Way | L21 9QF |
| Twyford Avenue | L21 9JX |
| Vincent Road | L21 7NX |
| Waterfield Way | L21 9PY L21 9QH |
| Watling Avenue | L21 9NU L21 9NX L21 9PA |
| Wheatfield View | L21 0DT |
| William Wall Road | L21 0DU L21 0DX |
| Wilsons Lane | L21 7LP L21 7LR L21 7LS |
| Zircon Close | L21 7RB |
Transport near Ford
-
Seaforth and Litherland Station
-
Waterloo (Merseyside) Station
-
Bootle New Strand Station
-
Aintree Station
-
Orrell Park Station
-
Blundellsands and Crosby Station
-
Walton (Merseyside) Station
-
Rice Lane Station
-
Old Roan Station
-
Bootle Oriel Road Station
- FAQ
- Price Paid By Year
- Property Type Price
Frequently asked questions about Ford
What is the average price for a property for sale in Ford?
The average price for a property for sale in Ford is £165,038. This amount is 38% lower than the average price in Liverpool. There are 935 property listings for sale in Ford.
What streets have the most expensive properties for sale in Ford?
The streets with the most expensive properties for sale in Ford are Litherland Park at an average of £395,625, Alexandra Mount at an average of £305,000 and The Oaks at an average of £280,000.
What streets have the most affordable properties for sale in Ford?
The streets with the most affordable properties for sale in Ford are Sefton View at an average of £87,500, Ford Lane at an average of £100,000 and Brendon Avenue at an average of £101,833.
Which train stations are available in or near Ford?
Some of the train stations available in or near Ford are Seaforth and Litherland, Waterloo (Merseyside) and Bootle New Strand.
Property Price Paid in Ford by Year
The average sold property price by year was:
| Year | Average Sold Price | Price Change |
Sold Properties
|
|---|---|---|---|
| 2025 | £163,904 | 3% |
73 Properties |
| 2024 | £159,090 | -8% |
105 Properties |
| 2023 | £172,406 | 10% |
96 Properties |
| 2022 | £155,671 | 4% |
123 Properties |
| 2021 | £149,324 | 12% |
176 Properties |
| 2020 | £131,136 | 3% |
100 Properties |
| 2019 | £127,705 | -1% |
125 Properties |
| 2018 | £129,220 | -7% |
117 Properties |
| 2017 | £138,253 | 21% |
122 Properties |
| 2016 | £108,979 | -9% |
110 Properties |
| 2015 | £118,433 | 4% |
108 Properties |
| 2014 | £114,066 | 3% |
87 Properties |
| 2013 | £110,382 | -4% |
73 Properties |
| 2012 | £114,409 | 4% |
64 Properties |
| 2011 | £109,863 | -3% |
52 Properties |
| 2010 | £112,678 | -4% |
53 Properties |
| 2009 | £116,912 | -4% |
44 Properties |
| 2008 | £121,539 | 3% |
79 Properties |
| 2007 | £117,534 | -5% |
140 Properties |
| 2006 | £123,242 | 0,3% |
138 Properties |
| 2005 | £122,817 | 7% |
116 Properties |
| 2004 | £113,780 | 26% |
148 Properties |
| 2003 | £84,290 | 15% |
165 Properties |
| 2002 | £71,547 | 21% |
309 Properties |
| 2001 | £56,470 | 11% |
148 Properties |
| 2000 | £50,075 | 3% |
105 Properties |
| 1999 | £48,804 | 9% |
107 Properties |
| 1998 | £44,607 | 2% |
108 Properties |
| 1997 | £43,764 | -0,1% |
85 Properties |
| 1996 | £43,828 | -2% |
85 Properties |
| 1995 | £44,568 | - |
55 Properties |
Property Price per Property Type in Ford
Here you can find historic sold price data in order to help with your property search.
The average Property Paid Price for specific property types in the last three years are:
| Property Type | Average Sold Price | Sold Properties |
|---|---|---|
| Flat | £109,440.00 | 26 Flats |
| Semi Detached House | £178,700.00 | 113 Semi Detached Houses |
| Detached House | £303,227.00 | 11 Detached Houses |
| Terraced House | £151,987.00 | 124 Terraced Houses |

