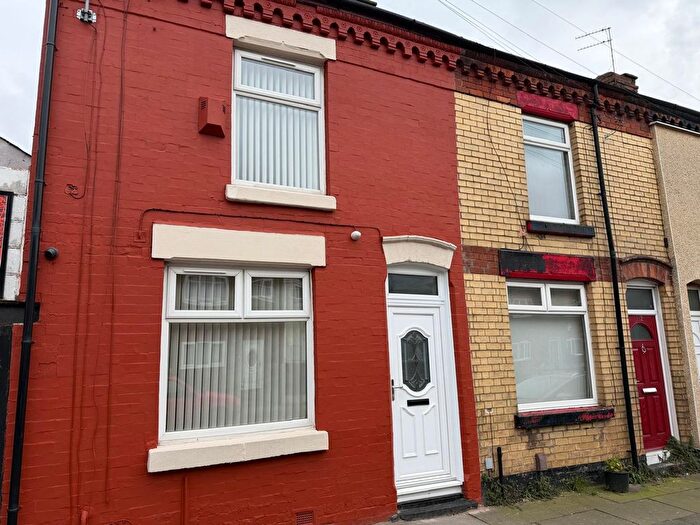
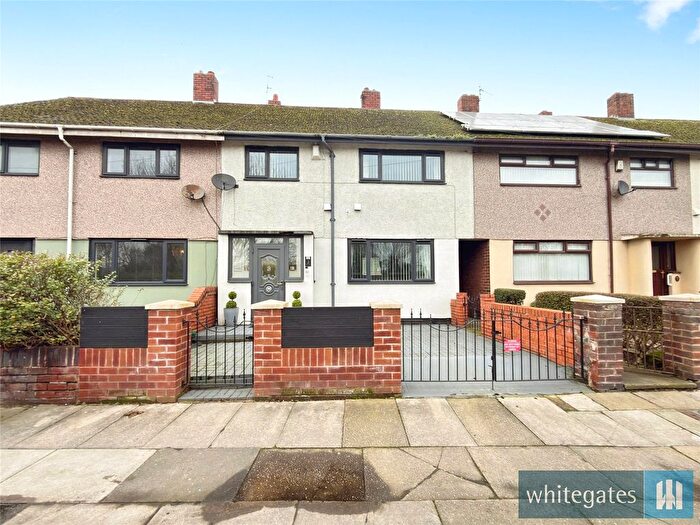
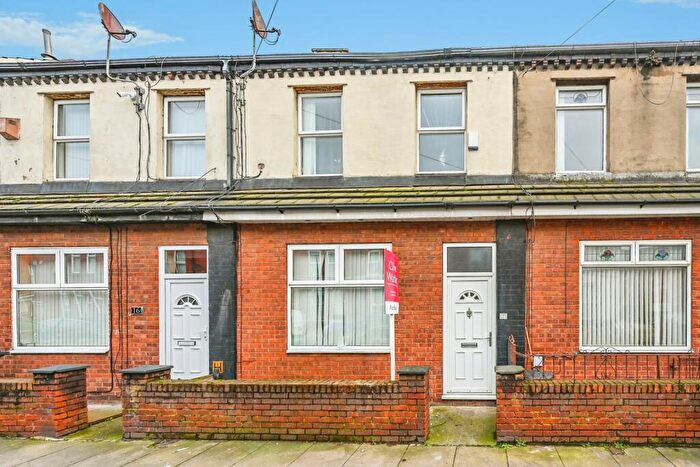
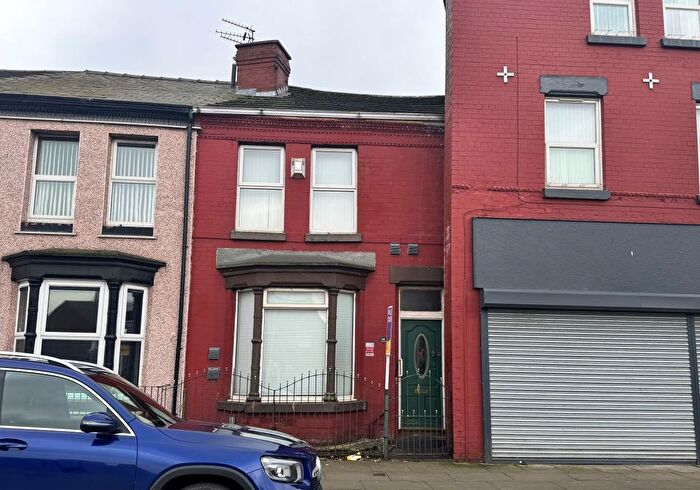
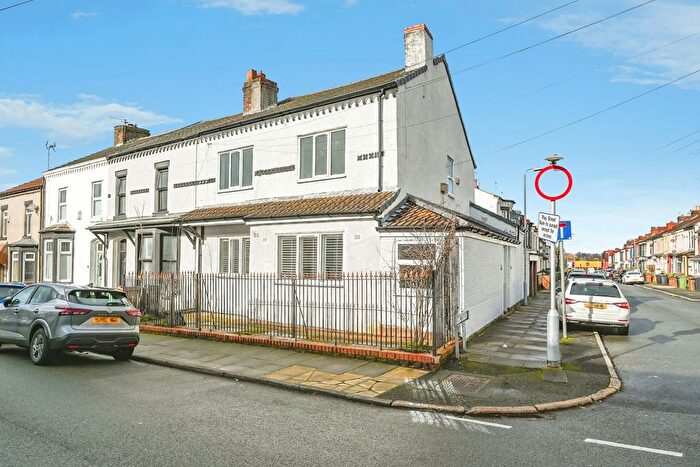
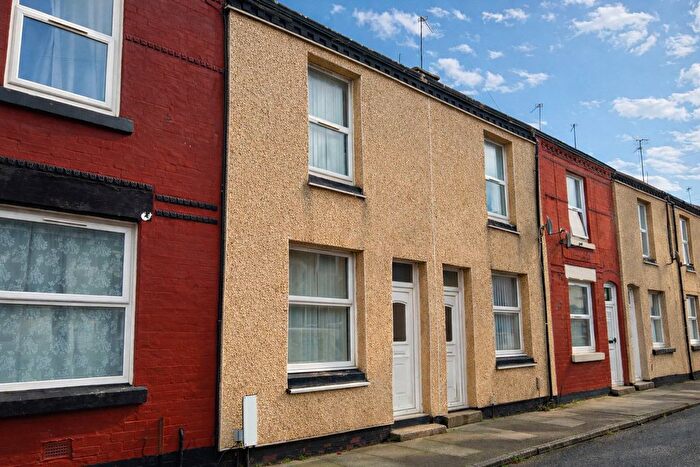
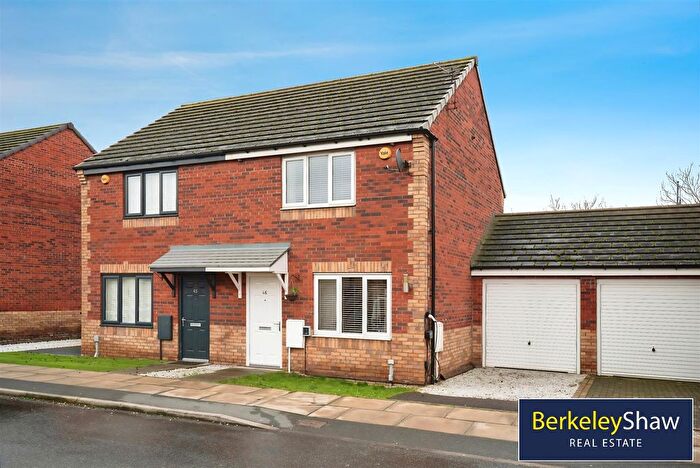
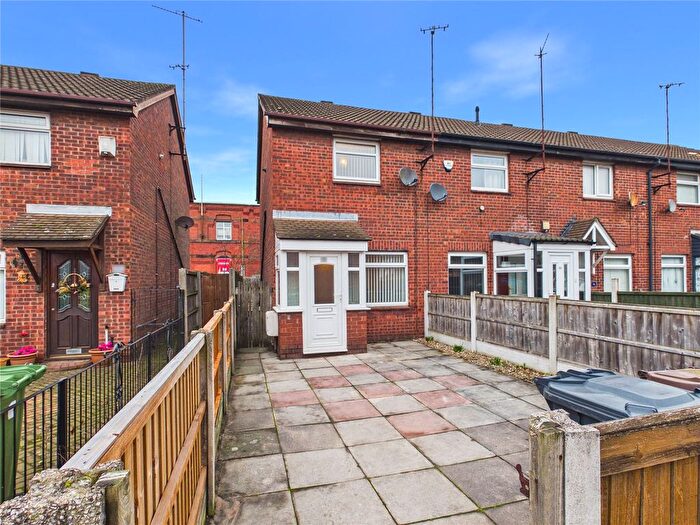
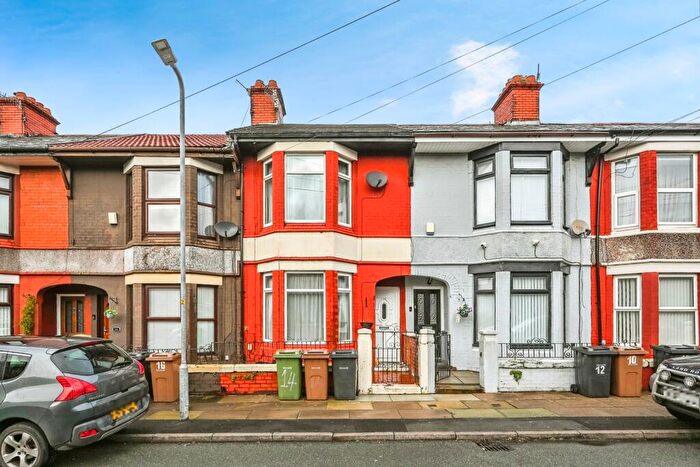
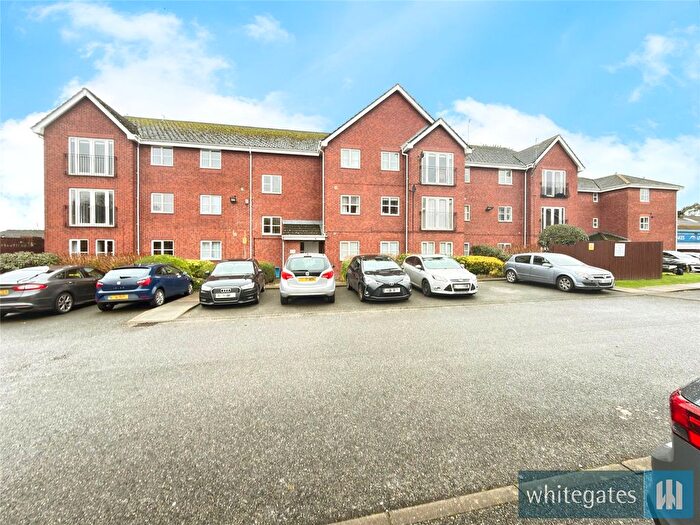
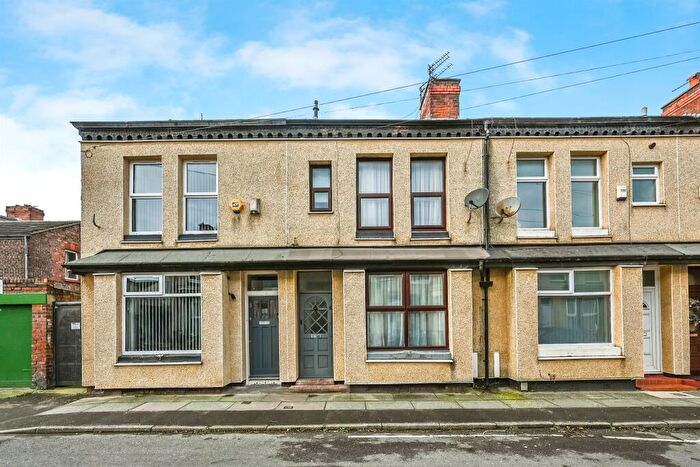
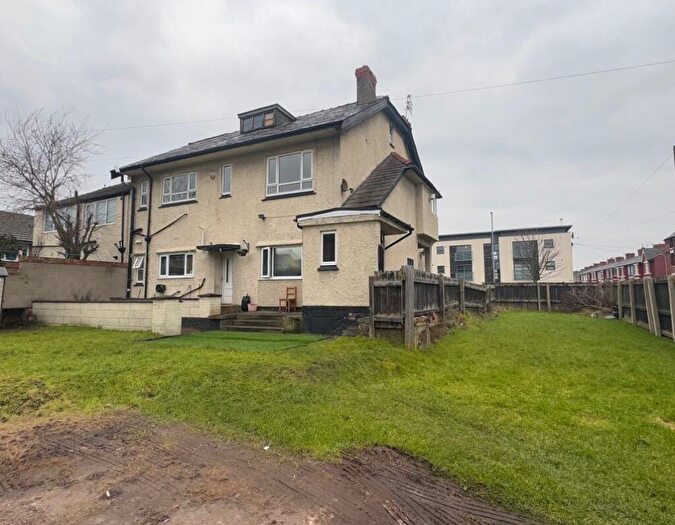
Houses for sale & to rent in Linacre, Liverpool
House Prices in Linacre
Properties in Linacre have an average house price of £106,426.00 and had 106 Property Transactions within the last 3 years¹.
Linacre is an area in Liverpool, Sefton with 1,263 households², where the most expensive property was sold for £235,000.00.
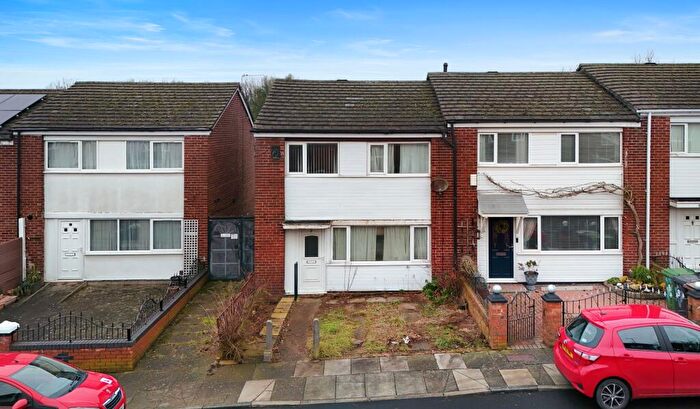
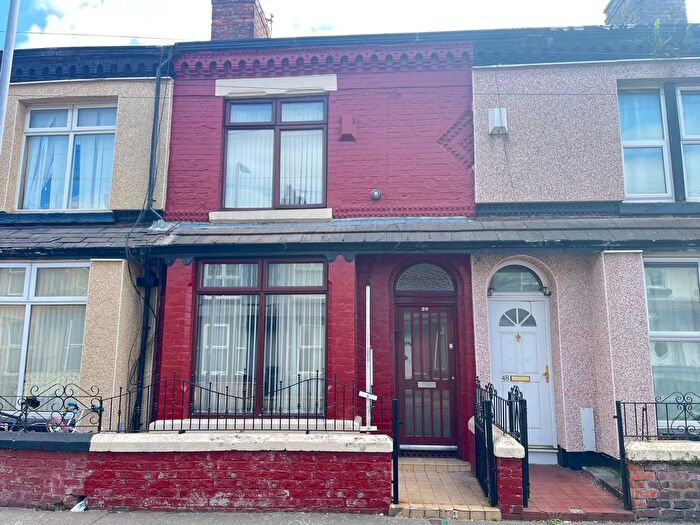
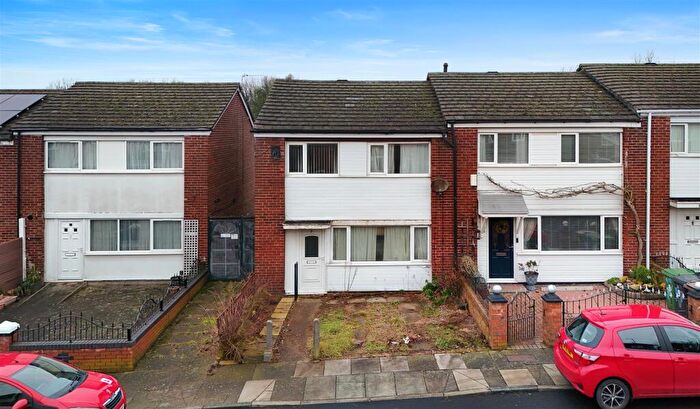
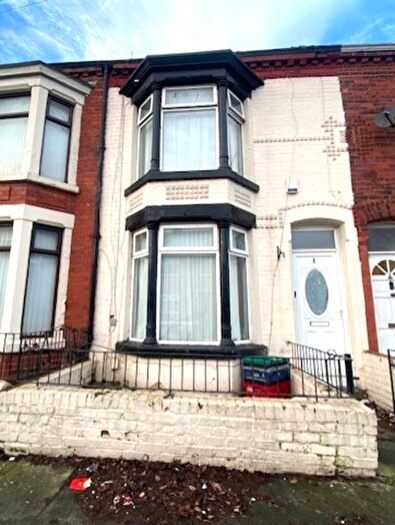
Properties for sale in Linacre
Roads and Postcodes in Linacre
Navigate through our locations to find the location of your next house in Linacre, Liverpool for sale or to rent.
| Streets | Postcodes |
|---|---|
| Ash Grove | L21 1BD |
| Balfe Street | L21 4NR |
| Barkeley Drive | L21 4LX |
| Beech Grove | L21 1BP |
| Bellini Close | L21 4PL |
| Caradoc Road | L21 4NB |
| Cecil Road | L21 1DB L21 1DD |
| Church Grove | L21 4PW |
| Church Road | L21 4LL L21 4LN L21 4LW |
| Clarendon Road | L21 4LP |
| Cookson Road | L21 4NT L21 4NU |
| Crescent Court | L21 4PQ |
| Crescent Road | L21 4LJ |
| Crosby Road South | L21 4LR L21 4LS L21 4LT L21 4LU L21 4PF |
| Elm Drive | L21 4NA |
| Elm Gardens | L21 1BE |
| Elm Road | L21 1BH L21 1BJ L21 1BL L21 3TG |
| Gladstone Road | L21 1DN |
| Green Lane | L21 3UB |
| Hawarden Grove | L21 3TS |
| Hicks Road | L21 3TD |
| Hogarth Street | L21 3TJ |
| Holly Grove | L21 1BN |
| Hornby Street | L21 3AD |
| Kelper Street | L21 3TL |
| Kepler Street | L21 3TF L21 3TE |
| Lime Grove | L21 3TT L21 3TZ |
| Lytton Grove | L21 1DJ |
| Maple Close | L21 4LY L21 4LZ L21 4PD L21 4PZ |
| Mary Stockton Court | L21 3UD |
| Muspratt Road | L21 4NN L21 4NP L21 4NW |
| Plum Grove | L21 3AB |
| Poplar Grove | L21 1BR |
| Rawson Road | L21 1BS L21 1BX L21 1BY L21 1EP |
| Rossini Street | L21 4NS |
| Sandy Road | L21 3TN |
| Seaforth Dock | L21 4PG |
| Seaforth Road | L21 3TX L21 3TY L21 4LB L21 4LD L21 4LE L21 4LF L21 4LG L21 3TA L21 4AB L21 4LA L21 4PN |
| Seaforth Vale North | L21 3TR |
| Seaforth Vale West | L21 3TP |
| Stanley Road | L75 1HP L75 1HR L75 1HS L75 1HT L75 1HU L75 1HW L75 1HX L75 1HY L75 2LL |
| Stella Precinct | L21 3TB |
| The Triad | L75 2BB L75 2DD L75 2EE L75 2GG L75 2PR L75 2TT L75 2YY |
| Verdi Avenue | L21 4NH |
| Verdi Street | L21 4PA |
| Verdi Terrace | L21 4ND |
| Woolfall Terrace | L21 4PJ |
| L69 9BN L69 9BP L69 9BR L69 9BS L69 9BU |
Transport near Linacre
-
Seaforth and Litherland Station
-
Bootle New Strand Station
-
Bootle Oriel Road Station
-
Waterloo (Merseyside) Station
-
Walton (Merseyside) Station
-
Kirkdale Station
-
Orrell Park Station
-
Bank Hall Station
-
Rice Lane Station
-
Sandhills Station
- FAQ
- Price Paid By Year
- Property Type Price
Frequently asked questions about Linacre
What is the average price for a property for sale in Linacre?
The average price for a property for sale in Linacre is £106,426. This amount is 60% lower than the average price in Liverpool. There are 1,135 property listings for sale in Linacre.
What streets have the most expensive properties for sale in Linacre?
The streets with the most expensive properties for sale in Linacre are Hicks Road at an average of £207,500, Elm Road at an average of £150,416 and Barkeley Drive at an average of £149,983.
What streets have the most affordable properties for sale in Linacre?
The streets with the most affordable properties for sale in Linacre are Verdi Street at an average of £62,500, Verdi Avenue at an average of £69,500 and Balfe Street at an average of £71,000.
Which train stations are available in or near Linacre?
Some of the train stations available in or near Linacre are Seaforth and Litherland, Bootle New Strand and Bootle Oriel Road.
Property Price Paid in Linacre by Year
The average sold property price by year was:
| Year | Average Sold Price | Price Change |
Sold Properties
|
|---|---|---|---|
| 2025 | £109,984 | 3% |
26 Properties |
| 2024 | £106,635 | 3% |
42 Properties |
| 2023 | £103,761 | 2% |
38 Properties |
| 2022 | £101,505 | -17% |
36 Properties |
| 2021 | £118,690 | 30% |
42 Properties |
| 2020 | £82,689 | -1% |
42 Properties |
| 2019 | £83,553 | 20% |
28 Properties |
| 2018 | £66,781 | 1% |
35 Properties |
| 2017 | £66,080 | -8% |
99 Properties |
| 2016 | £71,378 | 9% |
25 Properties |
| 2015 | £65,143 | -14% |
38 Properties |
| 2014 | £74,404 | 8% |
32 Properties |
| 2013 | £68,494 | -6% |
19 Properties |
| 2012 | £72,633 | -14% |
15 Properties |
| 2011 | £83,125 | 18% |
8 Properties |
| 2010 | £67,937 | -1% |
8 Properties |
| 2009 | £68,611 | -32% |
9 Properties |
| 2008 | £90,538 | 11% |
36 Properties |
| 2007 | £80,822 | 2% |
44 Properties |
| 2006 | £79,006 | -7% |
57 Properties |
| 2005 | £84,708 | 30% |
39 Properties |
| 2004 | £59,022 | 16% |
62 Properties |
| 2003 | £49,342 | 42% |
49 Properties |
| 2002 | £28,600 | 14% |
54 Properties |
| 2001 | £24,460 | -10% |
32 Properties |
| 2000 | £26,838 | -8% |
45 Properties |
| 1999 | £29,008 | 5% |
19 Properties |
| 1998 | £27,580 | -2% |
28 Properties |
| 1997 | £28,174 | 6% |
34 Properties |
| 1996 | £26,624 | 12% |
28 Properties |
| 1995 | £23,444 | - |
24 Properties |
Property Price per Property Type in Linacre
Here you can find historic sold price data in order to help with your property search.
The average Property Paid Price for specific property types in the last three years are:
| Property Type | Average Sold Price | Sold Properties |
|---|---|---|
| Semi Detached House | £126,875.00 | 10 Semi Detached Houses |
| Terraced House | £106,050.00 | 89 Terraced Houses |
| Flat | £82,000.00 | 7 Flats |

