
Houses for sale in Sheffield, Sheffield
House Prices in Sheffield
Properties in Sheffield have an average house price of £245k and had 19,931 Property Transactions within the last 3 years.¹
Sheffield is an area in Sheffield with 234,191 households², where the most expensive property was sold for £3M.
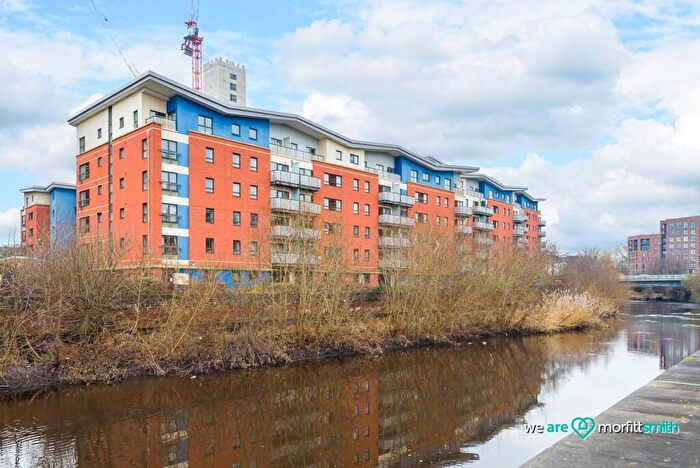
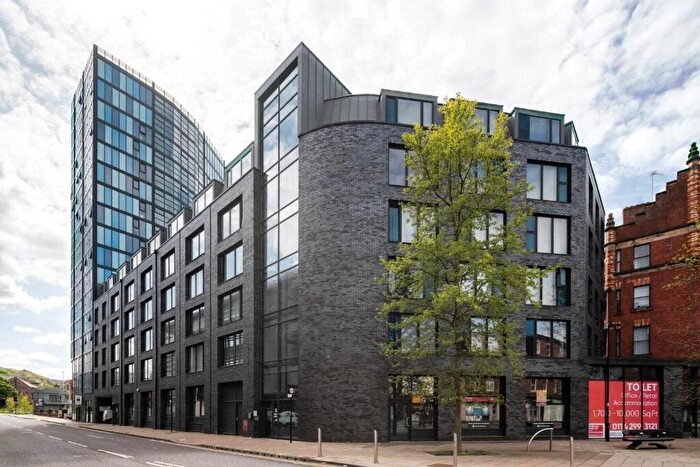
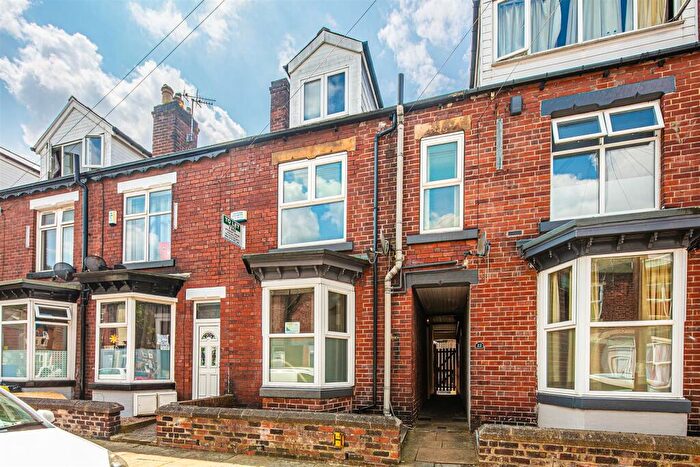
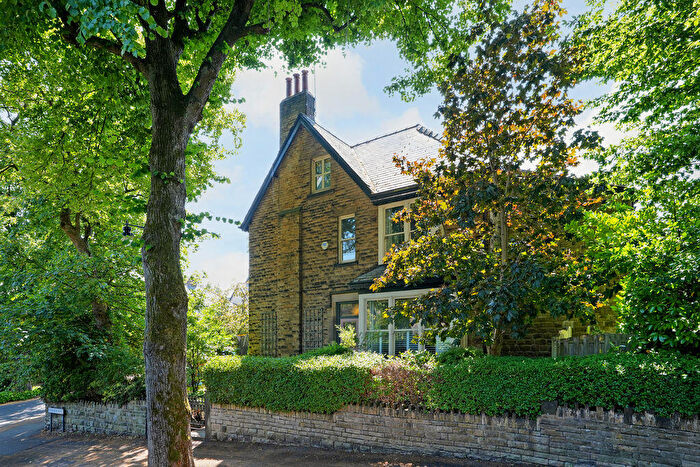
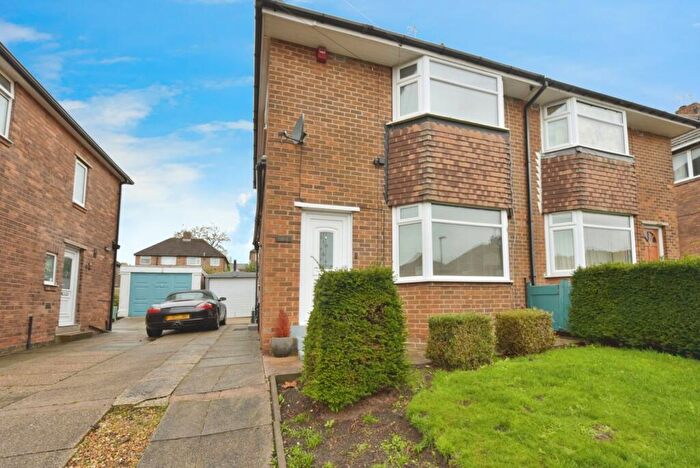
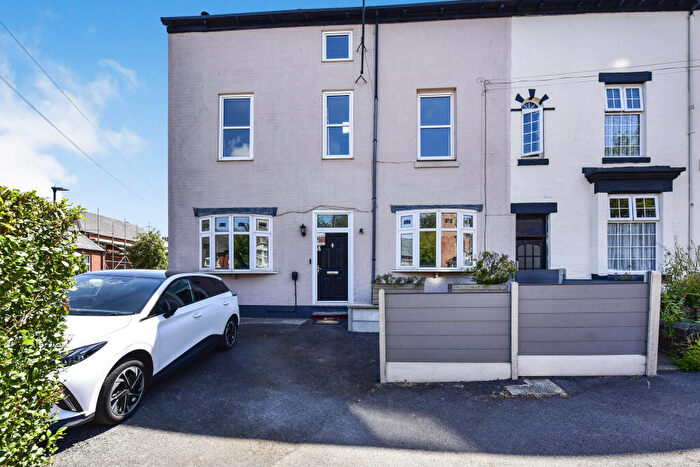
Properties for sale in Sheffield
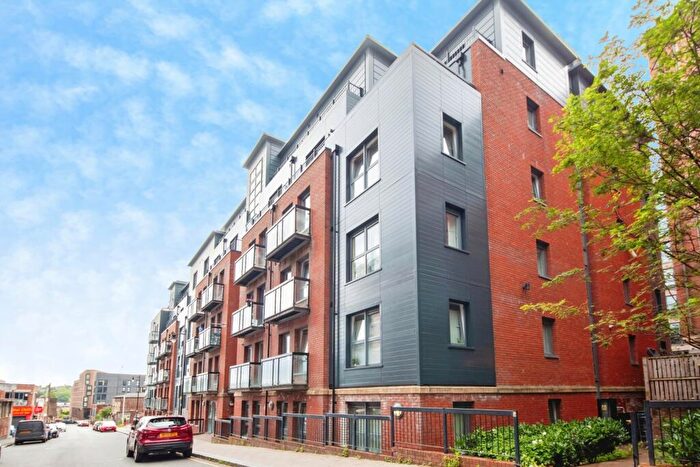
![]()
If you are looking to sell your house, let it out, or receive a property valuation, an expert can help you.
Click the button below to get started.
Neighbourhoods in Sheffield
Navigate through our locations to find the location of your next house in Sheffield, Sheffield for sale or to rent.
- Aughton & Swallownest
- Burngreave
- Arbourthorne
- Beauchief And Greenhill
- Beighton
- Birley
- Broomhill
- Central
- Crookes
- Darnall
- Dore And Totley
- East Ecclesfield
- Ecclesall
- Firth Park
- Fulwood
- Gleadless Valley
- Graves Park
- Hillsborough
- Manor Castle
- Mosborough
- Nether Edge
- Richmond
- Shiregreen And Brightside
- Southey
- Stannington
- Stocksbridge And Upper Don
- Walkley
- West Ecclesfield
- Woodhouse
- Broomhill and Sharrow Vale
- Crookes and Crosspool
- Nether Edge and Sharrow
- Park and Arbourthorne
- City
- Hathersage and Eyam
Property price trends in Sheffield
According to the latest Land Registry data, the average home in Sheffield sold for £243,418 in 2026. That figure comes from a substantial record of 243,184 sales logged over the past 31 years.
Prices have held fairly steady over the last three years. Compared with 2023, when the typical sale came in around £242,305, values are broadly unchanged.
Looking back five years, average prices are up about 7.5% since 2021, a gain of around £17,009 in cash terms.
Zoom out to the past decade for the fuller picture. Back in 2016, homes here averaged £172,939, so the typical sold price has climbed about 40.8% since then, roughly 3.5% a year. Stretch the view to fifteen years and that annual pace holds at about 3.3%.
Frequently asked questions about Sheffield
What is the average price for a property for sale in Sheffield?
The average price for a property for sale in Sheffield is £244,502. This amount is 0.48% lower than the average price in Sheffield. There are more than 10,000 property listings for sale in Sheffield.
What locations have the most expensive properties for sale in Sheffield?
The locations with the most expensive properties for sale in Sheffield are Crookes and Crosspool at an average of £806,333, Dore And Totley at an average of £510,784 and Fulwood at an average of £469,009.
What locations have the most affordable properties for sale in Sheffield?
The locations with the most affordable properties for sale in Sheffield are Burngreave at an average of £128,218, Shiregreen And Brightside at an average of £133,906 and Firth Park at an average of £143,701.
Which train stations are available in or near Sheffield?
Some of the train stations available in or near Sheffield are Sheffield, Darnall and Meadowhall.
Property Price Paid in Sheffield by Year
The average sold property price by year was:
| Year | Average Sold Price | Price Change |
Sold Properties
|
|---|---|---|---|
| 2026 | £243,418 | -1% |
395 Properties |
| 2025 | £246,247 | 0,4% |
5,946 Properties |
| 2024 | £245,140 | 1% |
7,025 Properties |
| 2023 | £242,305 | 2% |
6,565 Properties |
| 2022 | £237,587 | 5% |
7,398 Properties |
| 2021 | £226,409 | 10% |
8,582 Properties |
| 2020 | £204,253 | 4% |
6,687 Properties |
| 2019 | £195,420 | 2% |
8,193 Properties |
| 2018 | £190,630 | 5% |
8,094 Properties |
| 2017 | £180,288 | 4% |
8,279 Properties |
Property Price per Property Type in Sheffield
Here you can find historic sold price data in order to help with your property search.
The average Property Paid Price for specific property types in the last three years are:
| Property Type | Average Sold Price | Sold Properties |
|---|---|---|
| Semi Detached House | £248,747.00 | 7,225 Semi Detached Houses |
| Terraced House | £198,132.00 | 6,843 Terraced Houses |
| Detached House | £440,461.00 | 2,876 Detached Houses |
| Flat | £151,790.00 | 2,987 Flats |
Transport in Sheffield
Please see below transportation links in this area:
