
Houses for sale in Dronfield, Derbyshire
House Prices in Dronfield
Properties in Dronfield have an average house price of £318k and had 992 Property Transactions within the last 3 years.¹
Dronfield is an area in Derbyshire with 11,103 households², where the most expensive property was sold for £1.98M.
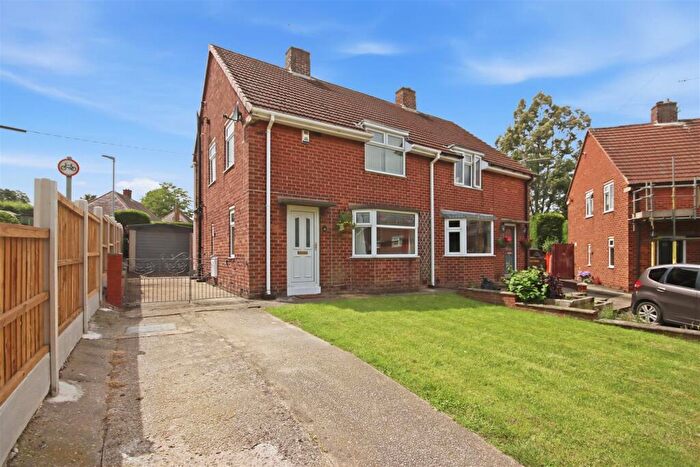
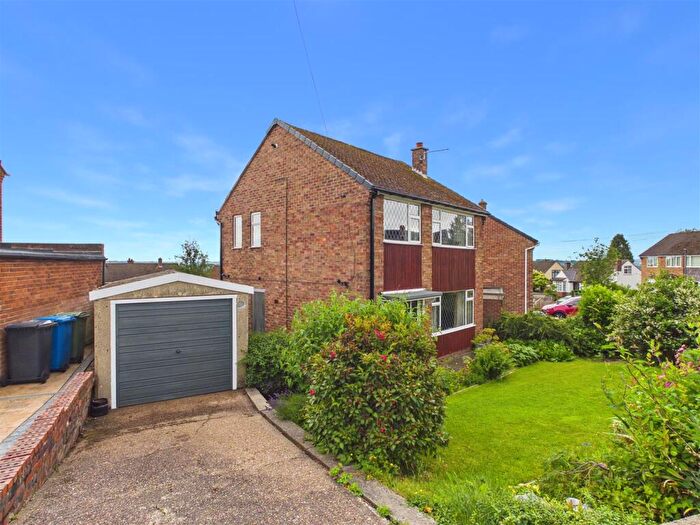
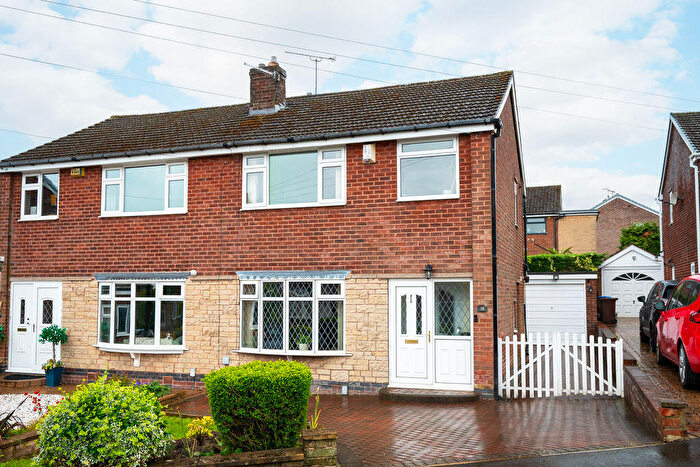
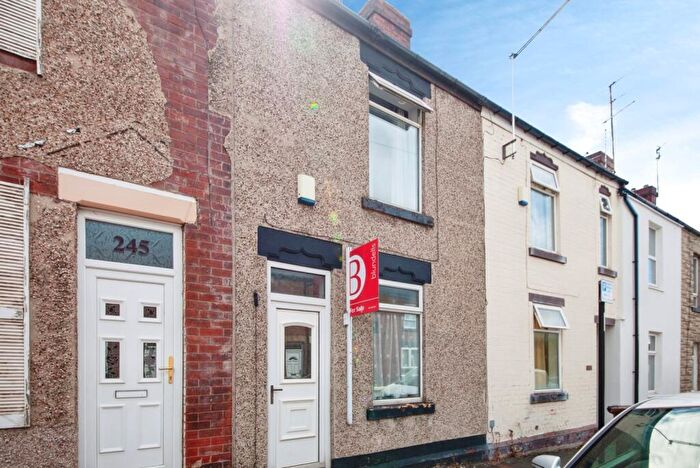
Properties for sale in Dronfield
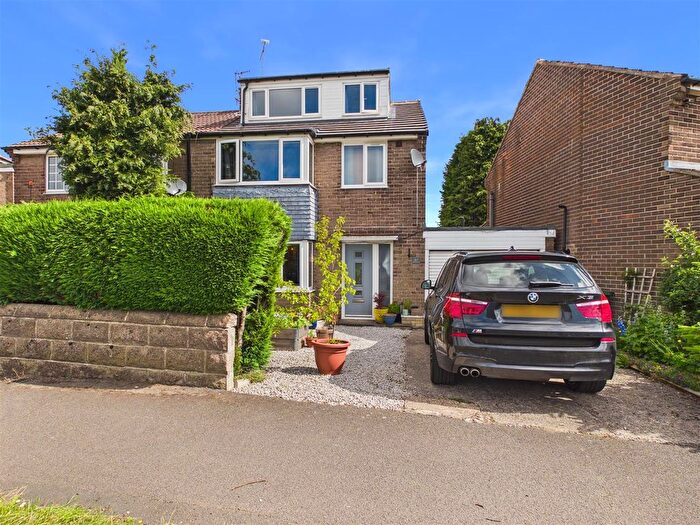
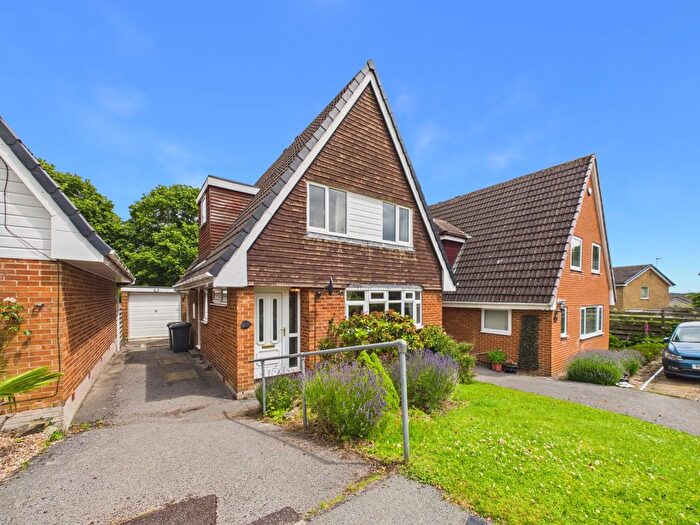
![]()
If you are looking to sell your house, let it out, or receive a property valuation, an expert can help you.
Click the button below to get started.

Neighbourhoods in Dronfield
Navigate through our locations to find the location of your next house in Dronfield, Derbyshire for sale or to rent.
Property price trends in Dronfield
According to the latest Land Registry data, the average home in Dronfield sold for £326,605 in 2026. That figure comes from a substantial record of 11,702 sales logged over the past 31 years.
Prices have moved up over the last three years. Compared with 2023, when the typical sale came in around £317,319, that's a rise of roughly 2.9%.
Looking back five years, average prices are up about 11.2% since 2021, a gain of around £32,937 in cash terms.
Zoom out to the past decade for the fuller picture. Back in 2016, homes here averaged £224,571, so the typical sold price has climbed about 45.4% since then, roughly 3.8% a year. Stretch the view to fifteen years and that annual pace eases back to about 3.6%.
Frequently asked questions about Dronfield
What is the average price for a property for sale in Dronfield?
The average price for a property for sale in Dronfield is £318,233. This amount is 26% higher than the average price in Derbyshire. There are 8,242 property listings for sale in Dronfield.
What locations have the most expensive properties for sale in Dronfield?
The locations with the most expensive properties for sale in Dronfield are Barlow & Holmesfield at an average of £1,100,000, Barlow And Holmesfield at an average of £558,372 and Ridgeway And Marsh Lane at an average of £550,000.
What locations have the most affordable properties for sale in Dronfield?
The locations with the most affordable properties for sale in Dronfield are Dronfield North at an average of £255,660, Coal Aston at an average of £295,221 and Dronfield South at an average of £303,362.
Which train stations are available in or near Dronfield?
Some of the train stations available in or near Dronfield are Dronfield, Dore and Totley and Chesterfield.
Property Price Paid in Dronfield by Year
The average sold property price by year was:
| Year | Average Sold Price | Price Change |
Sold Properties
|
|---|---|---|---|
| 2026 | £326,605 | 2% |
19 Properties |
| 2025 | £320,706 | 1% |
328 Properties |
| 2024 | £316,210 | -0,4% |
344 Properties |
| 2023 | £317,319 | -0,5% |
301 Properties |
| 2022 | £318,804 | 8% |
376 Properties |
| 2021 | £293,668 | 6% |
398 Properties |
| 2020 | £274,879 | 6% |
365 Properties |
| 2019 | £258,256 | 3% |
396 Properties |
| 2018 | £251,172 | 2% |
396 Properties |
| 2017 | £247,273 | 9% |
390 Properties |
Property Price per Property Type in Dronfield
Here you can find historic sold price data in order to help with your property search.
The average Property Paid Price for specific property types in the last three years are:
| Property Type | Average Sold Price | Sold Properties |
|---|---|---|
| Semi Detached House | £269,389.00 | 397 Semi Detached Houses |
| Detached House | £424,114.00 | 402 Detached Houses |
| Terraced House | £219,087.00 | 139 Terraced Houses |
| Flat | £144,304.00 | 54 Flats |
Transport in Dronfield
Please see below transportation links in this area:
