
Houses for sale in Ludlow, Shropshire
House Prices in Ludlow
Properties in Ludlow have an average house price of £308k and had 708 Property Transactions within the last 3 years.¹
Ludlow is an area in Shropshire with 7,355 households², where the most expensive property was sold for £1.78M.
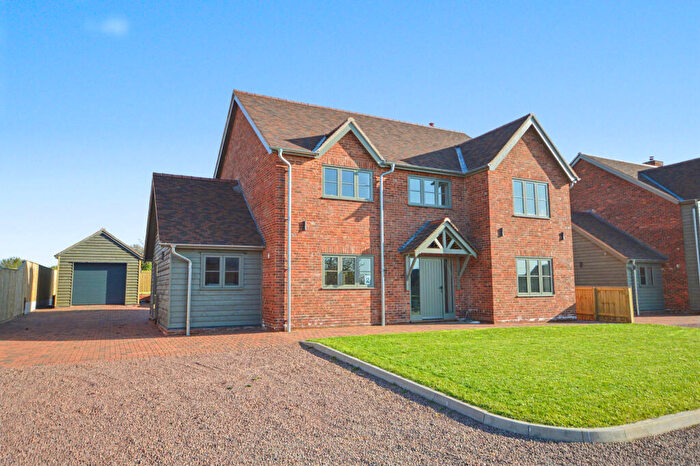
Properties for sale in Ludlow
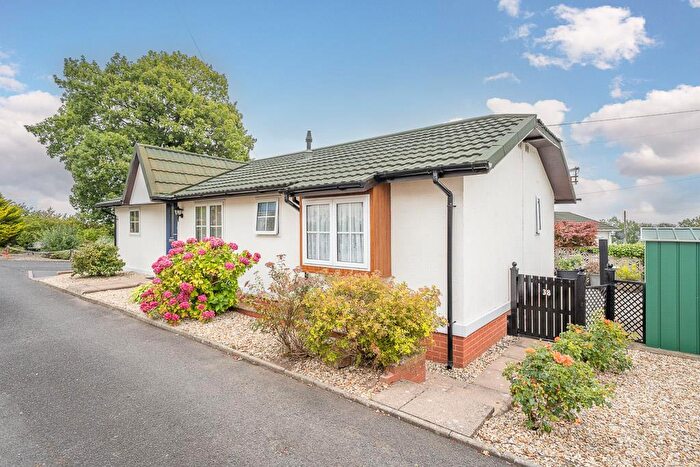
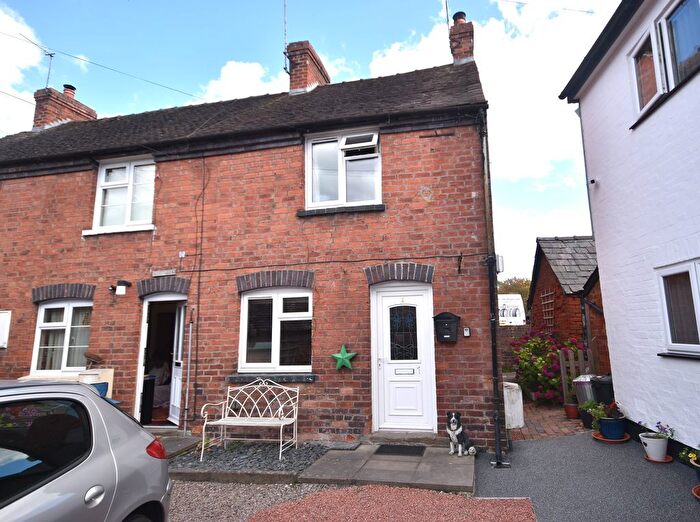
![]()
If you are looking to sell your house, let it out, or receive a property valuation, an expert can help you.
Click the button below to get started.
Neighbourhoods in Ludlow
Navigate through our locations to find the location of your next house in Ludlow, Shropshire for sale or to rent.
Property price trends in Ludlow
According to the latest Land Registry data, the average home in Ludlow sold for £317,128 in 2026. That figure comes from a substantial record of 9,190 sales logged over the past 31 years.
Prices have moved up over the last three years. Compared with 2023, when the typical sale came in around £299,231, that's a rise of roughly 6%.
Looking back five years, average prices are up about 11.1% since 2021, a gain of around £31,705 in cash terms.
Zoom out to the past decade for the fuller picture. Back in 2016, homes here averaged £234,488, so the typical sold price has climbed about 35.2% since then, roughly 3.1% a year. Stretch the view to fifteen years and that annual pace eases back to about 2.7%.
Frequently asked questions about Ludlow
What is the average price for a property for sale in Ludlow?
The average price for a property for sale in Ludlow is £307,954. This amount is 0.6% higher than the average price in Shropshire. There are 710 property listings for sale in Ludlow.
What locations have the most expensive properties for sale in Ludlow?
The locations with the most expensive properties for sale in Ludlow are Corvedale at an average of £484,245, Cleobury Mortimer at an average of £402,181 and Clee at an average of £363,965.
What locations have the most affordable properties for sale in Ludlow?
The locations with the most affordable properties for sale in Ludlow are Ludlow East at an average of £263,927, Ludlow South at an average of £282,639 and Ludlow North at an average of £316,688.
Which train stations are available in or near Ludlow?
Some of the train stations available in or near Ludlow are Ludlow, Craven Arms and Broome.
Property Price Paid in Ludlow by Year
The average sold property price by year was:
| Year | Average Sold Price | Price Change |
Sold Properties
|
|---|---|---|---|
| 2026 | £317,128 | 3% |
25 Properties |
| 2025 | £307,847 | -2% |
195 Properties |
| 2024 | £314,682 | 5% |
262 Properties |
| 2023 | £299,231 | -1% |
226 Properties |
| 2022 | £302,322 | 6% |
267 Properties |
| 2021 | £285,423 | -3% |
350 Properties |
| 2020 | £294,896 | 17% |
204 Properties |
| 2019 | £245,903 | -1% |
273 Properties |
| 2018 | £249,087 | 5% |
276 Properties |
| 2017 | £237,241 | 1% |
297 Properties |
Property Price per Property Type in Ludlow
Here you can find historic sold price data in order to help with your property search.
The average Property Paid Price for specific property types in the last three years are:
| Property Type | Average Sold Price | Sold Properties |
|---|---|---|
| Semi Detached House | £276,605.00 | 142 Semi Detached Houses |
| Detached House | £409,518.00 | 270 Detached Houses |
| Terraced House | £256,894.00 | 212 Terraced Houses |
| Flat | £163,354.00 | 84 Flats |
Transport in Ludlow
Please see below transportation links in this area:
