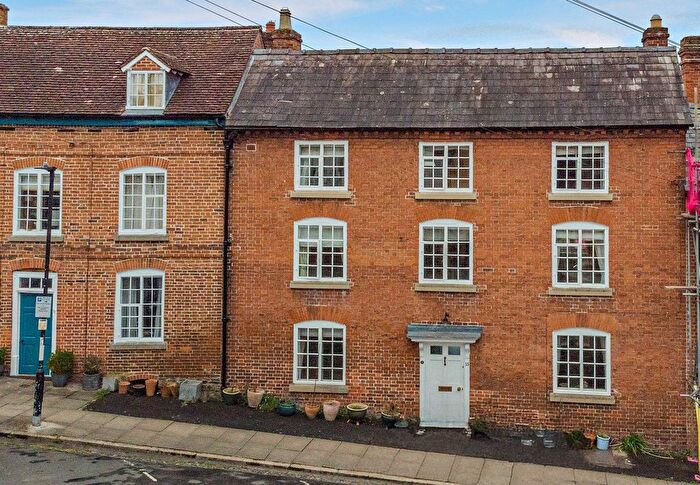
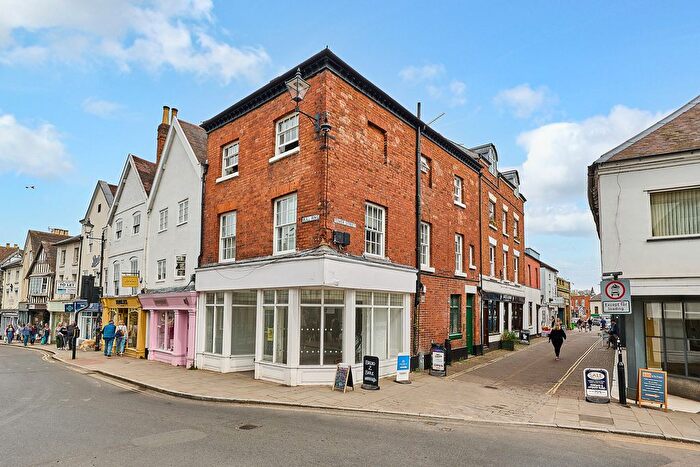
Houses for sale & to rent in Ludlow North, Ludlow
House Prices in Ludlow North
Properties in Ludlow North have an average house price of £308,784.00 and had 218 Property Transactions within the last 3 years¹.
Ludlow North is an area in Ludlow, Shropshire with 1,981 households², where the most expensive property was sold for £1,500,000.00.
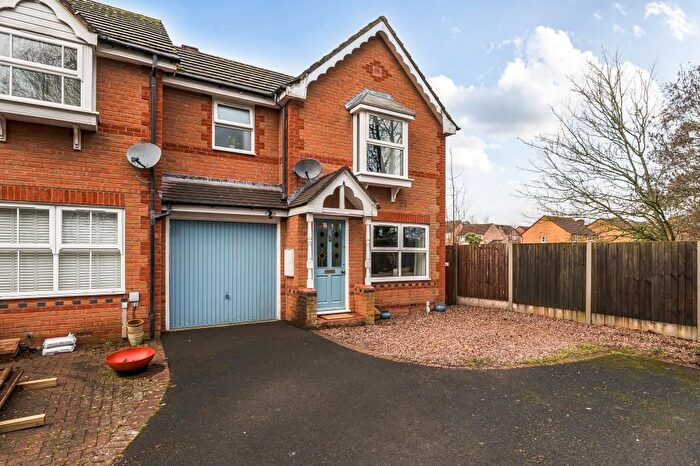
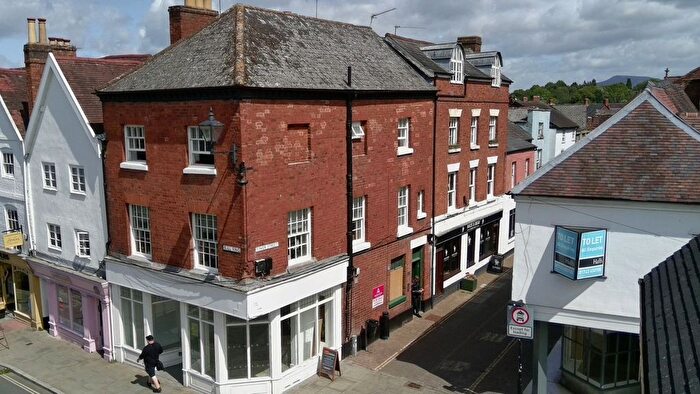
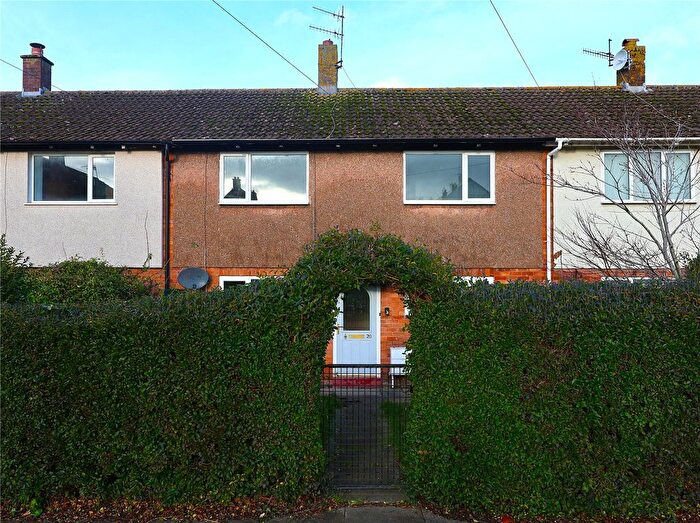
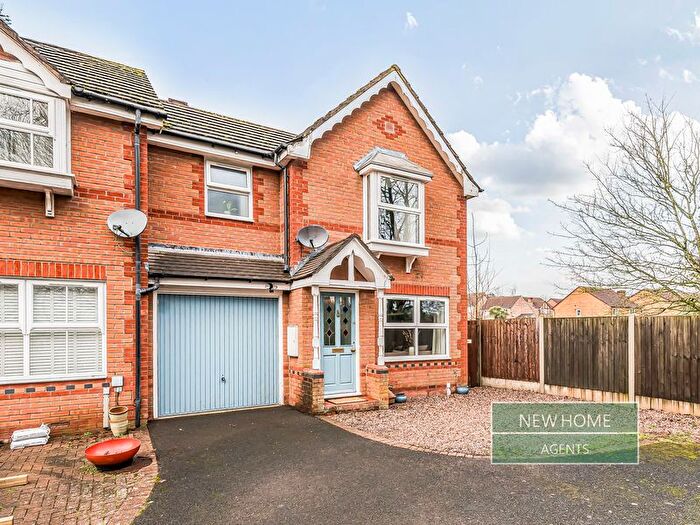
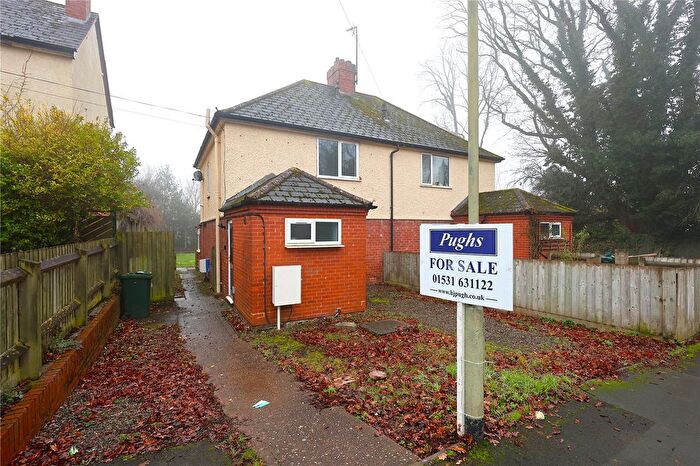
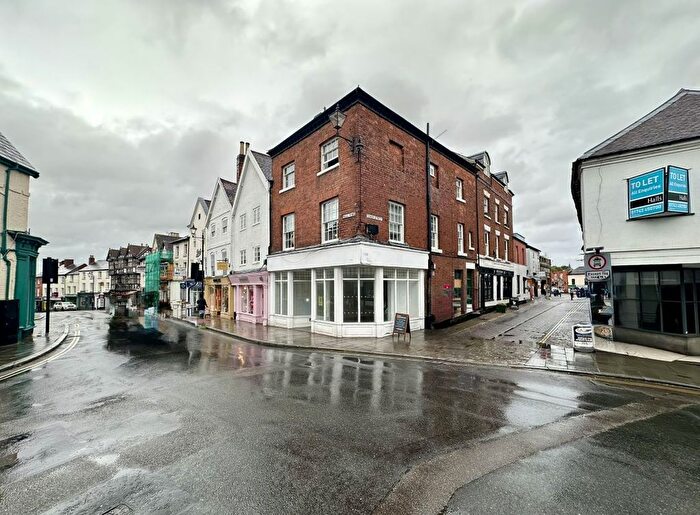
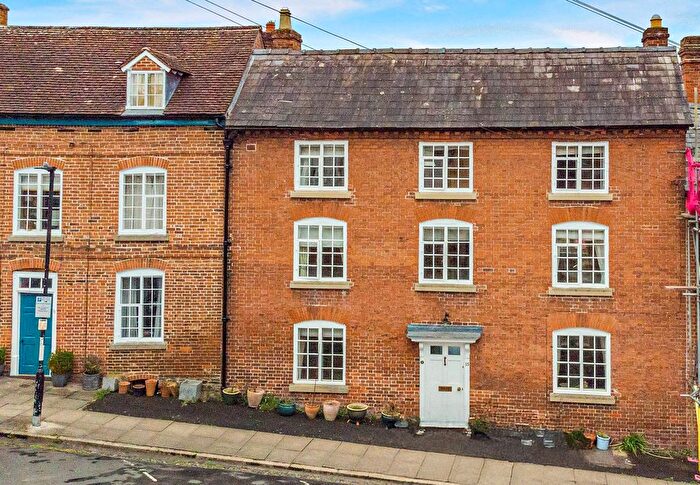
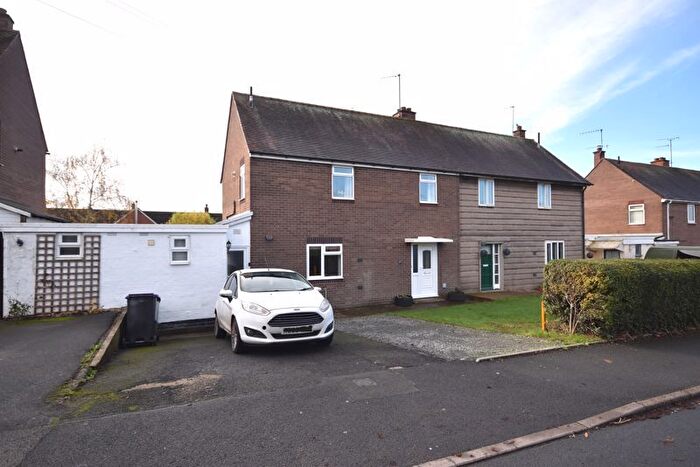
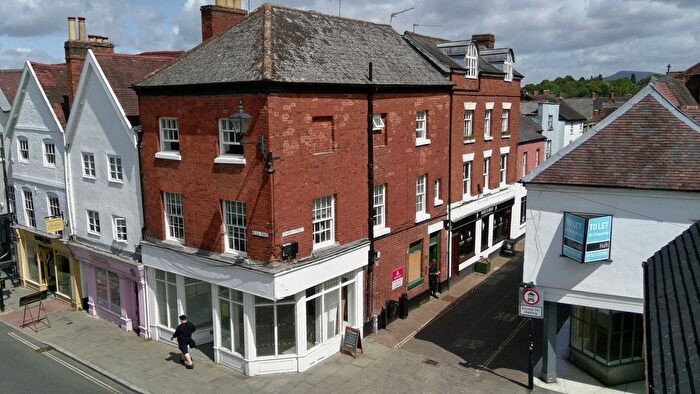
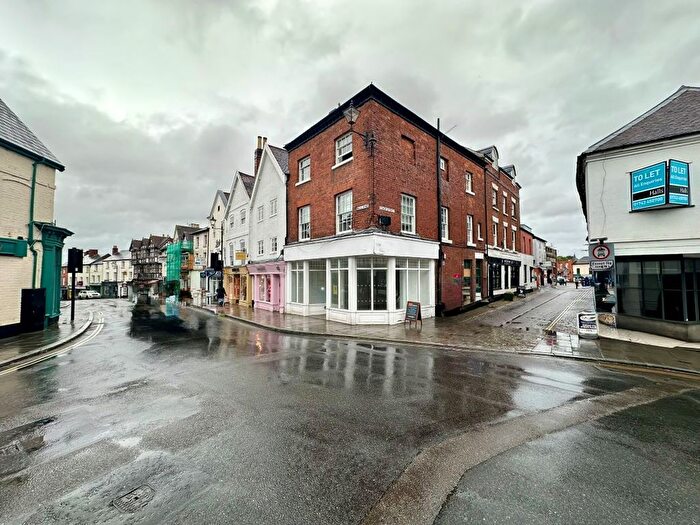
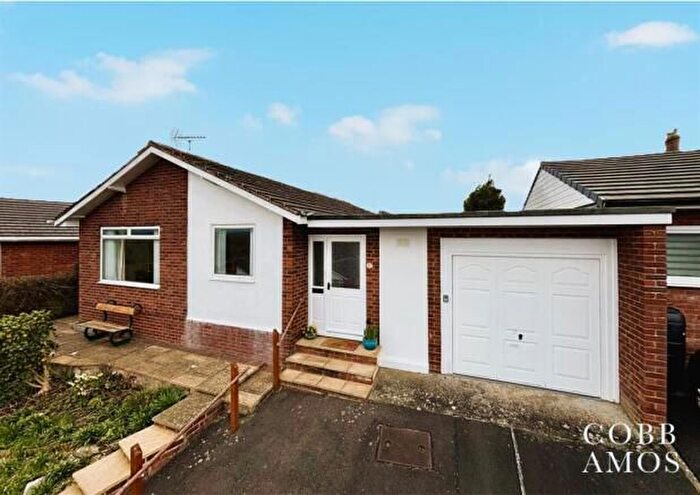
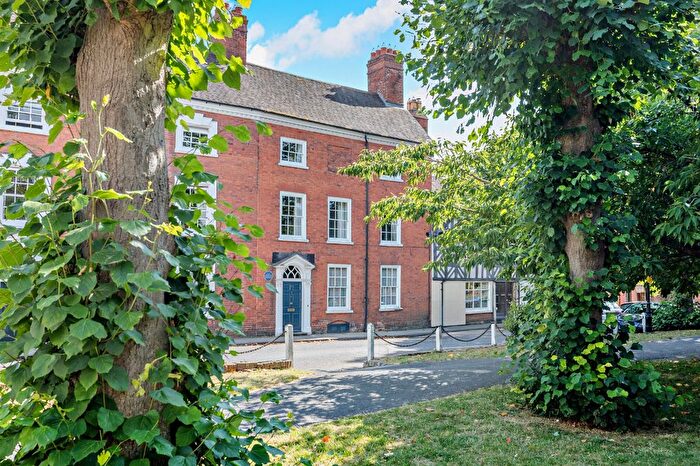
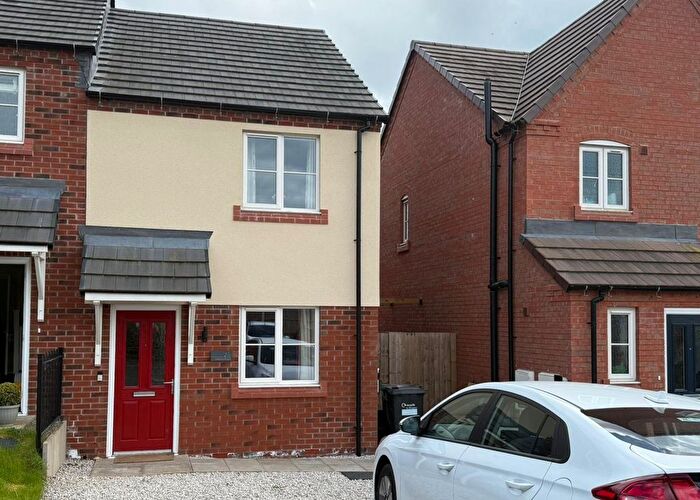
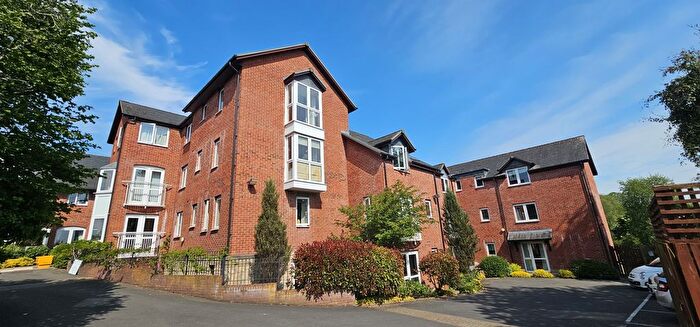
Previously listed properties in Ludlow North
Roads and Postcodes in Ludlow North
Navigate through our locations to find the location of your next house in Ludlow North, Ludlow for sale or to rent.
| Streets | Postcodes |
|---|---|
| Abbotts Row | SY8 1TT |
| Bell Lane | SY8 1BN |
| Belle Vue Terrace | SY8 2NZ |
| Brand Lane | SY8 1NN |
| Bringewood Close | SY8 2LY |
| Bringewood Rise | SY8 2NB SY8 2ND SY8 2NE |
| Bringewood Road | SY8 2LZ SY8 2NA SY8 2NF |
| Broad Street | SY8 1NG SY8 1NH SY8 1NJ SY8 1NL SY8 1GN SY8 1GP SY8 1NQ |
| Bromfield Road | SY8 1DN SY8 1DW SY8 2BN SY8 2BP SY8 1DR SY8 1EL SY8 1GJ SY8 2BW |
| Broome Close | SY8 2JT |
| Bull Ring | SY8 1AB SY8 1AD |
| Burway Close | SY8 1GX |
| Burway Lane | SY8 1DT |
| Burway Trading Estate | SY8 1EN |
| Buttercross | SY8 1AW |
| Camp Lane | SY8 1EQ |
| Castle Square | SY8 1AX SY8 1AY SY8 1GD |
| Castle Street | SY8 1AS SY8 1AT |
| Castle View Terrace | SY8 2NG |
| Castleford Road | SY8 1DF |
| Chandlers Close | SY8 1SB |
| Chapel Mews | SY8 2PY |
| Chapel Row | SY8 2NL |
| Church Street | SY8 1AP |
| Church Walk | SY8 1AL |
| College Court | SY8 1BZ |
| College Street | SY8 1AN |
| Cookeridge Cottages | SY8 2LA |
| Coronation Avenue | SY8 1DP |
| Corve Street | SY8 1DA SY8 1DJ SY8 1DL SY8 1DU SY8 1DX SY8 1EB SY8 1GB SY8 1GE SY8 2PG SY8 1DB SY8 1DE SY8 1DG SY8 1DH SY8 1DY SY8 1EA |
| Corve View | SY8 2QD |
| Dinham | SY8 1EH SY8 1EJ SY8 1GF SY8 2JE |
| Dodmore Lane | SY8 2NN |
| Felton Close | SY8 1DQ SY8 1DS |
| Fish Street | SY8 1TY |
| Fishmore Close | SY8 2PS |
| Fishmore Road | SY8 2LU |
| Fishmore View | SY8 2PR |
| Friars Garden | SY8 1RX |
| Friars Walk | SY8 1NT |
| Glencoe Terrace | SY8 1PY |
| Gravel Hill | SY8 1QU SY8 1QX SY8 1RY |
| Harp Lane | SY8 1BY |
| High Street | SY8 1BS |
| Jockey Field | SY8 1PU |
| Jockey Fields | SY8 1TP |
| Keepside Close | SY8 1BQ |
| Kiln Court | SY8 2PJ |
| King Street | SY8 1AQ SY8 1AJ |
| Lady Halton | SY8 2JJ SY8 2JL |
| Linney | SY8 1ED SY8 1EG |
| Lower Broad Street | SY8 1PH SY8 1PQ SY8 1XA |
| Lower Galdeford | SY8 1RN SY8 1RU SY8 1TE SY8 1RZ |
| Lower Mill Street | SY8 1BH |
| Lower Raven Lane | SY8 1BL |
| Lower Wood Road | SY8 2JG |
| Ludford Bridge Industrial Estate | SY8 1PE |
| Market Street | SY8 1BP |
| Marstons Terrace | SY8 1QN |
| Mayfields | SY8 2QB |
| Middle Wood Road | SY8 2LN |
| Mill Street | SY8 1AZ SY8 1BB SY8 1BE SY8 1BG SY8 1GH |
| New Road | SY8 2LS SY8 2NX SY8 2NY |
| New Street | SY8 2BL SY8 2NH SY8 2NJ SY8 2NQ |
| Norton Row | SY8 2PL |
| Oakly Park | SY8 2JW |
| Old Brickyard | SY8 2LT |
| Old Street | SY8 1NP SY8 1NS SY8 1NU SY8 1NW SY8 1NX SY8 1NZ SY8 1TZ SY8 1NR |
| Pepper Lane | SY8 1PX |
| Portcullis Lane | SY8 1BF SY8 1PZ SY8 1GT |
| Priors Halton | SY8 2JN |
| Pynfold Gardens | SY8 1RW |
| Quality Square | SY8 1AR SY8 1FE |
| Raglan Place | SY8 2LW |
| Raven Lane | SY8 1BW SY8 1TX |
| Saunders Close | SY8 1RH |
| Silk Mill Lane | SY8 1BJ |
| Springfield Close | SY8 1RR SY8 1RS |
| St Johns Lane | SY8 1PF |
| St Johns Road | SY8 1PG |
| St Marys Lane | SY8 1DZ |
| St Marys Mews | SY8 1FG |
| St Peters Mews | SY8 2PZ |
| St Stephens Close | SY8 1QQ |
| Stanton Close | SY8 2LP |
| Stanton Drive | SY8 2PH |
| Stanton Road | SY8 2LR SY8 2PF |
| Station Cottages | SY8 2BT |
| Station Drive | SY8 2PQ |
| Steeple Mews | SY8 1YW |
| Streatley Mews | SY8 2PN |
| Summerfields | SY8 2QA |
| Teme Avenue | SY8 1NE SY8 1NY |
| The Angel | SY8 1LT |
| The Cliff Park | SY8 2JF |
| The Greyhound | SY8 1NF |
| The Linney | SY8 1EE |
| The Paddocks | SY8 1AA |
| The Poles | SY8 2JH |
| The Stalls | SY8 2JS |
| Tower Street | SY8 1RL |
| Upper Galdeford | SY8 1QD SY8 1QF |
| Upper Linney | SY8 1EF |
| Warrington Gardens | SY8 1RP |
| Whitbatch Close | SY8 2PA |
| Wigley Drive | SY8 3DR |
| Wood Yard | SY8 2PX |
| Woodville Cottages | SY8 1QG |
| SY8 2JU SY8 3DP SY8 3DT SY8 1AE SY8 1AG SY8 1GG SY8 1PS SY8 1PT SY8 1QB SY8 1QH SY8 2AA SY8 2BU SY8 2BX SY8 2JP SY8 2JR SY8 2JX SY8 2JY SY8 2JZ SY8 2LB SY8 3DS SY8 3DU |
Transport near Ludlow North
- FAQ
- Price Paid By Year
- Property Type Price
Frequently asked questions about Ludlow North
What is the average price for a property for sale in Ludlow North?
The average price for a property for sale in Ludlow North is £308,784. This amount is 1% higher than the average price in Ludlow. There are 185 property listings for sale in Ludlow North.
What streets have the most expensive properties for sale in Ludlow North?
The streets with the most expensive properties for sale in Ludlow North are Brand Lane at an average of £787,500, Burway Lane at an average of £786,666 and Mill Street at an average of £740,000.
What streets have the most affordable properties for sale in Ludlow North?
The streets with the most affordable properties for sale in Ludlow North are Castle Street at an average of £122,000, Tower Street at an average of £124,000 and College Court at an average of £125,831.
Which train stations are available in or near Ludlow North?
Some of the train stations available in or near Ludlow North are Ludlow, Craven Arms and Broome.
Property Price Paid in Ludlow North by Year
The average sold property price by year was:
| Year | Average Sold Price | Price Change |
Sold Properties
|
|---|---|---|---|
| 2025 | £283,446 | -22% |
62 Properties |
| 2024 | £346,998 | 20% |
94 Properties |
| 2023 | £276,185 | -6% |
62 Properties |
| 2022 | £292,245 | 5% |
113 Properties |
| 2021 | £277,828 | -8% |
121 Properties |
| 2020 | £300,727 | 22% |
72 Properties |
| 2019 | £234,210 | -12% |
93 Properties |
| 2018 | £263,452 | 7% |
96 Properties |
| 2017 | £243,921 | 13% |
93 Properties |
| 2016 | £212,363 | 4% |
103 Properties |
| 2015 | £204,718 | -18% |
91 Properties |
| 2014 | £241,066 | 8% |
98 Properties |
| 2013 | £221,684 | 16% |
70 Properties |
| 2012 | £187,148 | -4% |
84 Properties |
| 2011 | £195,146 | -9% |
70 Properties |
| 2010 | £212,632 | 6% |
66 Properties |
| 2009 | £199,143 | 1% |
75 Properties |
| 2008 | £198,111 | -23% |
84 Properties |
| 2007 | £243,627 | 15% |
96 Properties |
| 2006 | £206,517 | 2% |
129 Properties |
| 2005 | £201,971 | 6% |
91 Properties |
| 2004 | £189,333 | 6% |
103 Properties |
| 2003 | £177,829 | 21% |
116 Properties |
| 2002 | £141,032 | 14% |
119 Properties |
| 2001 | £121,634 | 20% |
117 Properties |
| 2000 | £97,441 | 11% |
118 Properties |
| 1999 | £87,008 | 5% |
119 Properties |
| 1998 | £82,300 | 13% |
111 Properties |
| 1997 | £71,192 | 4% |
101 Properties |
| 1996 | £68,164 | 5% |
104 Properties |
| 1995 | £64,906 | - |
82 Properties |
Property Price per Property Type in Ludlow North
Here you can find historic sold price data in order to help with your property search.
The average Property Paid Price for specific property types in the last three years are:
| Property Type | Average Sold Price | Sold Properties |
|---|---|---|
| Flat | £175,507.00 | 62 Flats |
| Semi Detached House | £383,237.00 | 20 Semi Detached Houses |
| Detached House | £436,838.00 | 56 Detached Houses |
| Terraced House | £303,823.00 | 80 Terraced Houses |

