Houses for sale & to rent in Ludlow East, Ludlow
House Prices in Ludlow East
Properties in Ludlow East have an average house price of £266,719.00 and had 168 Property Transactions within the last 3 years¹.
Ludlow East is an area in Ludlow, Shropshire with 1,820 households², where the most expensive property was sold for £750,000.00.
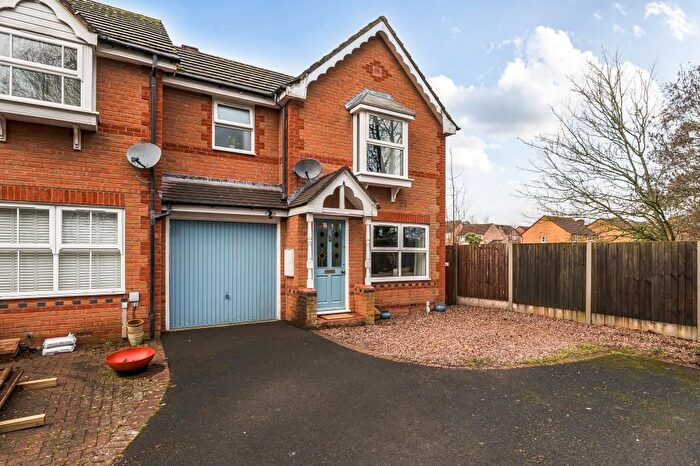
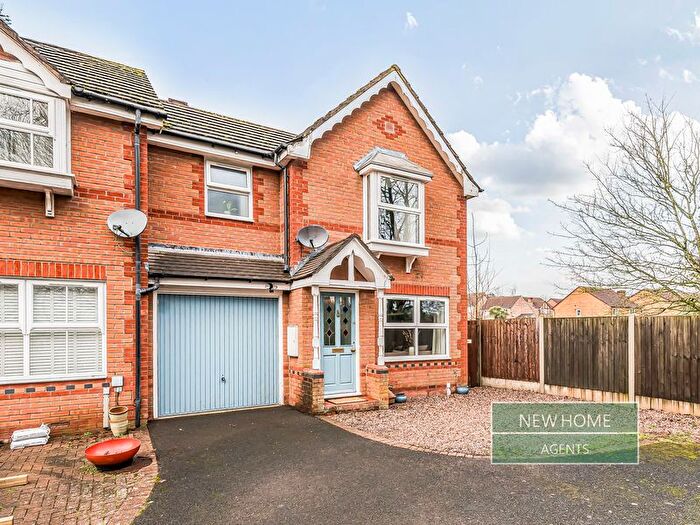
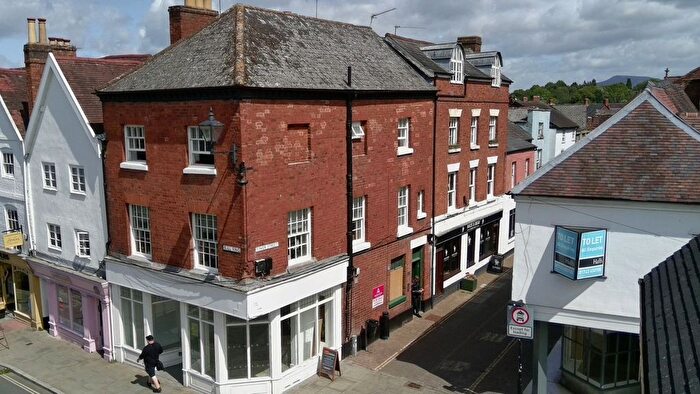
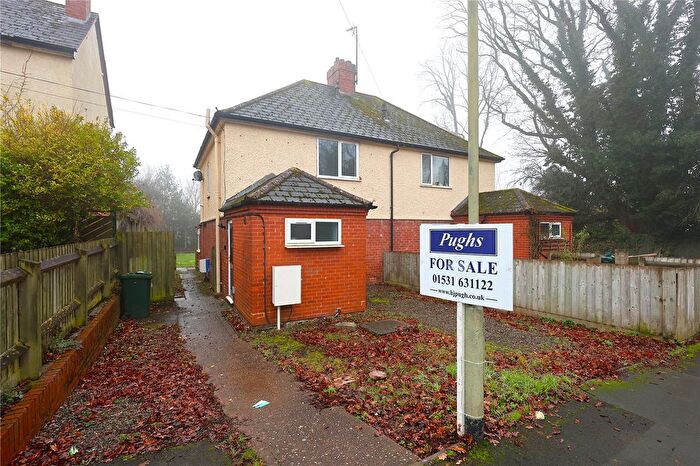
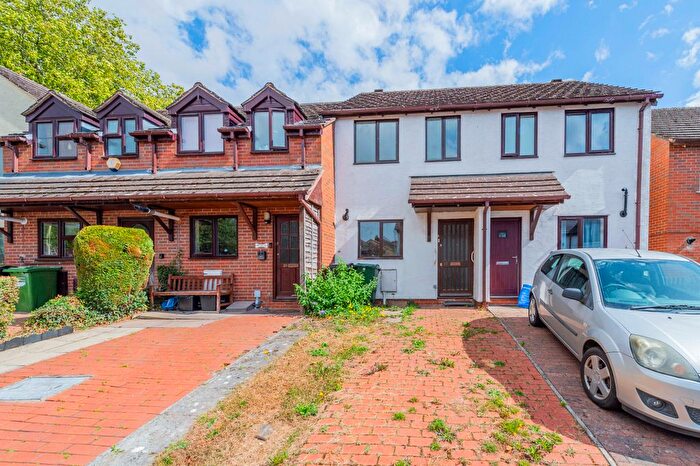
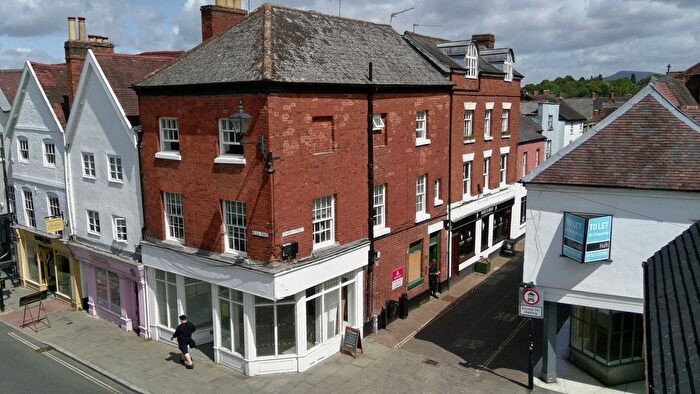
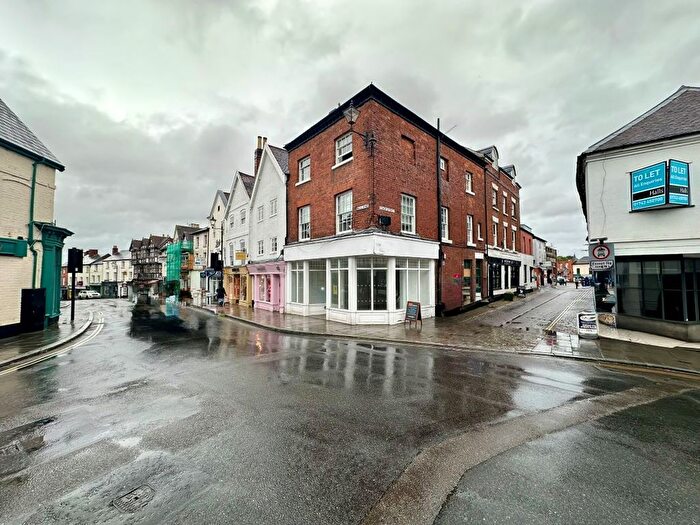
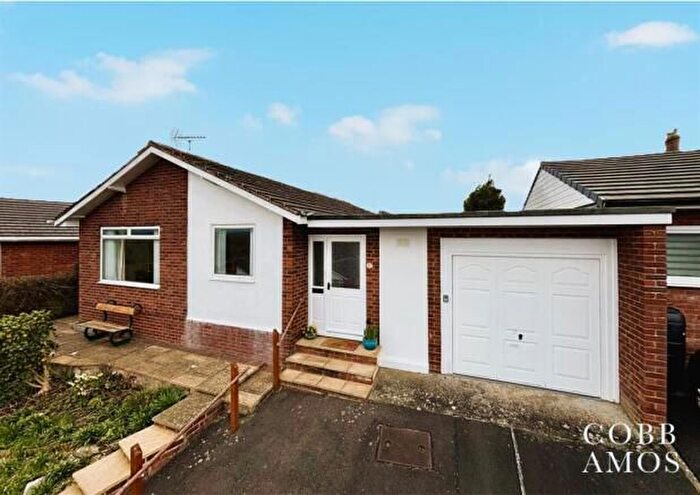
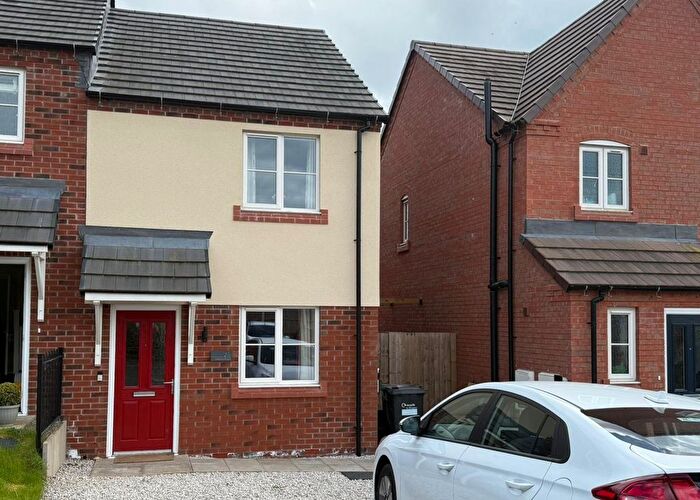
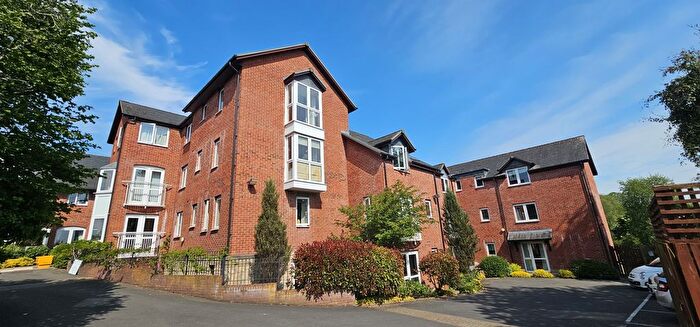
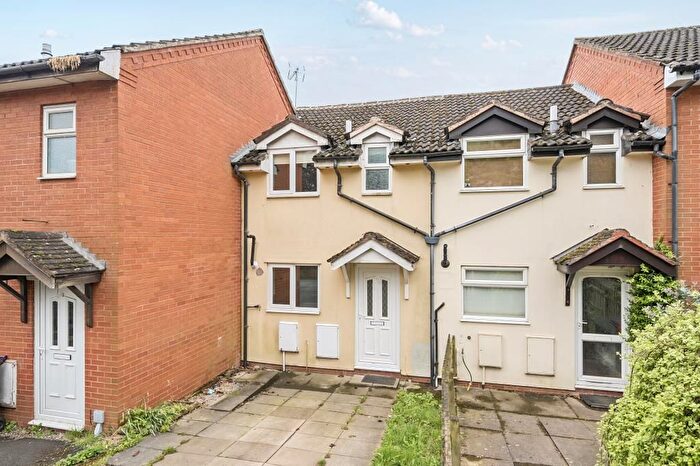
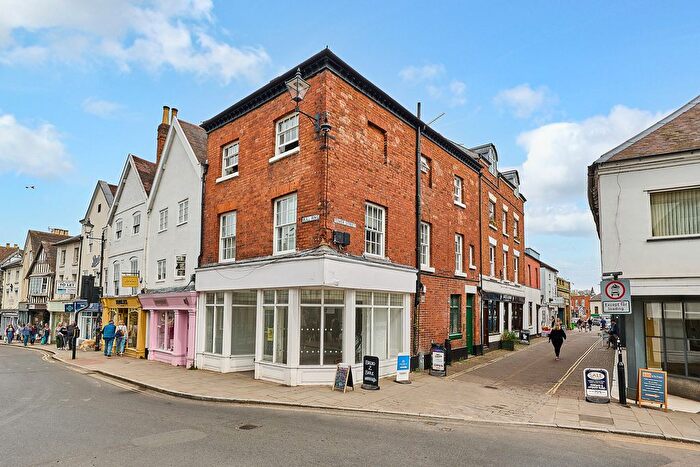
Previously listed properties in Ludlow East
Roads and Postcodes in Ludlow East
Navigate through our locations to find the location of your next house in Ludlow East, Ludlow for sale or to rent.
| Streets | Postcodes |
|---|---|
| Beech Close | SY8 2PD |
| Beech Gardens | SY8 1UT |
| Bitterley Close | SY8 1XP |
| Bromley Road | SY8 1QY |
| Cangeford Drive | SY8 1XL |
| Clee Gardens | SY8 1GY |
| Clee View | SY8 1HX SY8 1HY SY8 1HU |
| Clee View Close | SY8 1TH |
| Cold Weston Drive | SY8 1XR |
| Dodmore Lane | SY8 2NT |
| Downton View | SY8 1JE SY8 1JF SY8 1JG |
| Elm Walk | SY8 2LX |
| Gravel Hill | SY8 1QL SY8 1QR SY8 1QS SY8 1QW |
| Hamlet Close | SY8 2NW |
| Hamlet Road | SY8 2NP SY8 2NR |
| Hayton View | SY8 2NU |
| Henley Orchards | SY8 1TN SY8 1TW |
| Henley Road | SY8 1QZ SY8 1RA SY8 1RJ SY8 1UB |
| Hillside | SY8 1RB |
| Hopton Close | SY8 2PU |
| Housman Close | SY8 1SJ |
| Housman Crescent | SY8 1SG |
| Hucklemarsh Road | SY8 2PB SY8 2PW |
| Julian Road | SY8 1HA SY8 1HD SY8 1HB |
| Kershaw Close | SY8 1UA |
| Lacy Road | SY8 2NS |
| Lime Close | SY8 2PP |
| Livesey Avenue | SY8 1HN |
| Livesey Road | SY8 1EX SY8 1EY SY8 1EZ |
| Loughton Close | SY8 1XT |
| Maple Close | SY8 2PT |
| Milton Road | SY8 1SL SY8 1SN SY8 1SW |
| Mortimer Place | SY8 1SP |
| Orchard Gardens | SY8 1HE |
| Parys Road | SY8 1XX |
| Police Houses | SY8 1HT |
| Potter Close | SY8 1UD |
| Poyner Close | SY8 1RQ |
| Poyner Road | SY8 1QT |
| Quarry Gardens | SY8 1RD SY8 1RE SY8 1RF |
| Riddings Meadow | SY8 1EW |
| Riddings Road | SY8 1HR |
| Rock Lane | SY8 1SF SY8 1ST SY8 1SU |
| Rock Terrace | SY8 1SR SY8 1SS |
| Sandford Road | SY8 1SX |
| Sandpits Avenue | SY8 1SY SY8 1TA SY8 1TB |
| Sandpits Close | SY8 1SZ |
| Sandpits Road | SY8 1HG SY8 1HH SY8 1HL SY8 1HP SY8 1HQ SY8 1HW SY8 1HF SY8 1HJ |
| Sidney Road | SY8 1SH SY8 1SQ |
| St Julians Avenue | SY8 1ET SY8 1EU |
| St Margaret Road | SY8 1XN |
| St Milborough Close | SY8 1XS |
| Starstile Meadow | SY8 1QA |
| Station Drive | SY8 2AB |
| Sycamore Close | SY8 2PE |
| The Paddocks | SY8 1ER |
| The Wildings | SY8 1EP |
| Weyman Road | SY8 1QJ |
| Wheathill Close | SY8 1XQ |
| Wheeler Close | SY8 1GA |
| Wheeler Road | SY8 1JD |
| Whitbread Road | SY8 1HZ SY8 1JA SY8 1JB |
| Whitefriars | SY8 1RG |
Transport near Ludlow East
- FAQ
- Price Paid By Year
- Property Type Price
Frequently asked questions about Ludlow East
What is the average price for a property for sale in Ludlow East?
The average price for a property for sale in Ludlow East is £266,719. This amount is 13% lower than the average price in Ludlow. There are 152 property listings for sale in Ludlow East.
What streets have the most expensive properties for sale in Ludlow East?
The streets with the most expensive properties for sale in Ludlow East are Livesey Road at an average of £484,222, St Julians Avenue at an average of £477,500 and Poyner Road at an average of £469,000.
What streets have the most affordable properties for sale in Ludlow East?
The streets with the most affordable properties for sale in Ludlow East are The Wildings at an average of £110,150, Rock Lane at an average of £142,000 and The Paddocks at an average of £160,000.
Which train stations are available in or near Ludlow East?
Some of the train stations available in or near Ludlow East are Ludlow, Craven Arms and Broome.
Property Price Paid in Ludlow East by Year
The average sold property price by year was:
| Year | Average Sold Price | Price Change |
Sold Properties
|
|---|---|---|---|
| 2025 | £281,149 | 5% |
50 Properties |
| 2024 | £268,353 | 7% |
67 Properties |
| 2023 | £250,426 | -0,5% |
51 Properties |
| 2022 | £251,665 | 10% |
55 Properties |
| 2021 | £225,958 | 3% |
77 Properties |
| 2020 | £219,919 | 15% |
50 Properties |
| 2019 | £187,542 | -14% |
64 Properties |
| 2018 | £213,771 | 15% |
69 Properties |
| 2017 | £181,831 | 3% |
72 Properties |
| 2016 | £176,005 | -2% |
57 Properties |
| 2015 | £178,934 | 6% |
61 Properties |
| 2014 | £168,122 | -5% |
64 Properties |
| 2013 | £176,613 | 5% |
62 Properties |
| 2012 | £167,461 | -4% |
54 Properties |
| 2011 | £173,719 | 11% |
54 Properties |
| 2010 | £154,142 | -27% |
70 Properties |
| 2009 | £195,739 | -1% |
44 Properties |
| 2008 | £198,073 | 10% |
41 Properties |
| 2007 | £177,748 | 3% |
72 Properties |
| 2006 | £172,221 | 4% |
119 Properties |
| 2005 | £165,339 | 5% |
51 Properties |
| 2004 | £157,827 | 19% |
70 Properties |
| 2003 | £127,116 | 12% |
60 Properties |
| 2002 | £111,434 | 11% |
103 Properties |
| 2001 | £99,701 | 28% |
125 Properties |
| 2000 | £72,226 | 12% |
104 Properties |
| 1999 | £63,313 | 6% |
79 Properties |
| 1998 | £59,326 | 7% |
55 Properties |
| 1997 | £55,182 | 11% |
67 Properties |
| 1996 | £49,144 | 8% |
76 Properties |
| 1995 | £45,191 | - |
50 Properties |
Property Price per Property Type in Ludlow East
Here you can find historic sold price data in order to help with your property search.
The average Property Paid Price for specific property types in the last three years are:
| Property Type | Average Sold Price | Sold Properties |
|---|---|---|
| Semi Detached House | £269,334.00 | 54 Semi Detached Houses |
| Detached House | £390,703.00 | 43 Detached Houses |
| Terraced House | £205,277.00 | 60 Terraced Houses |
| Flat | £104,359.00 | 11 Flats |

