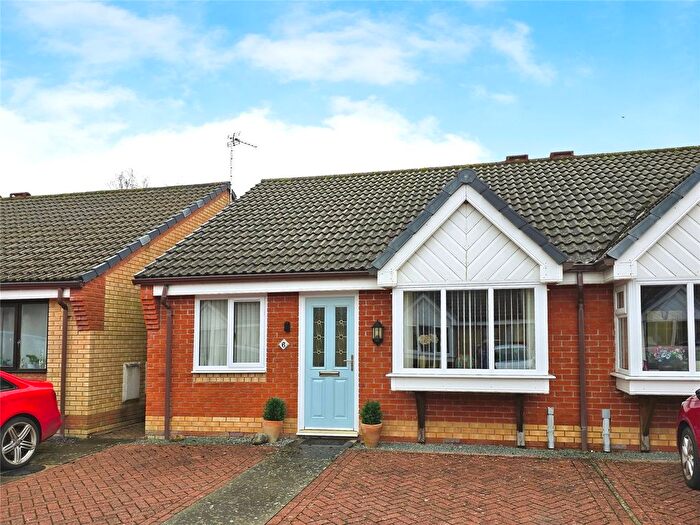
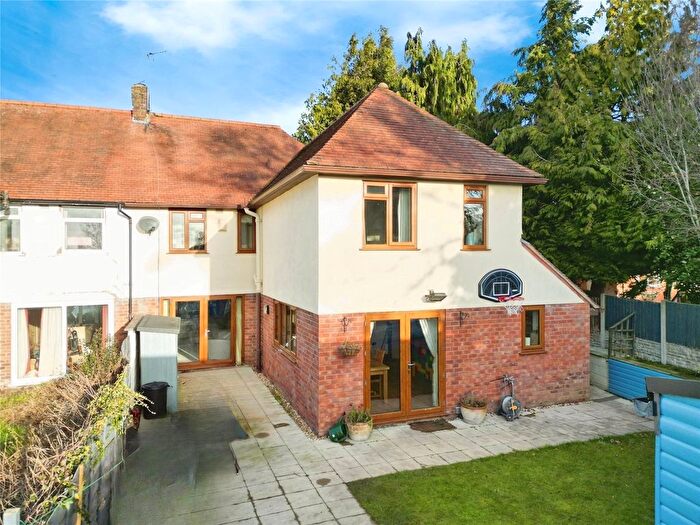
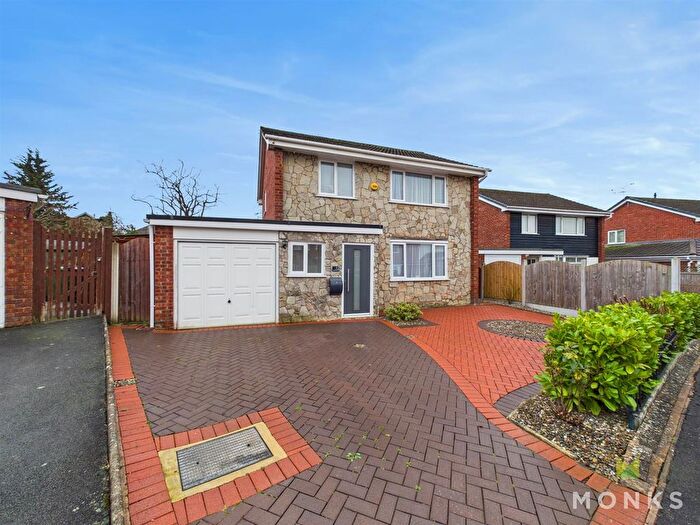
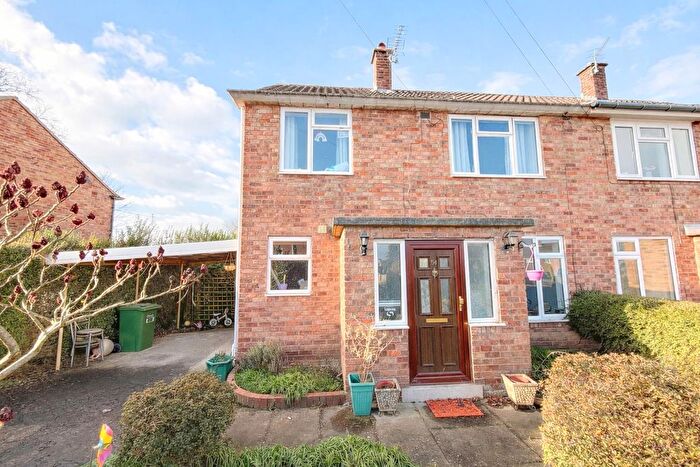
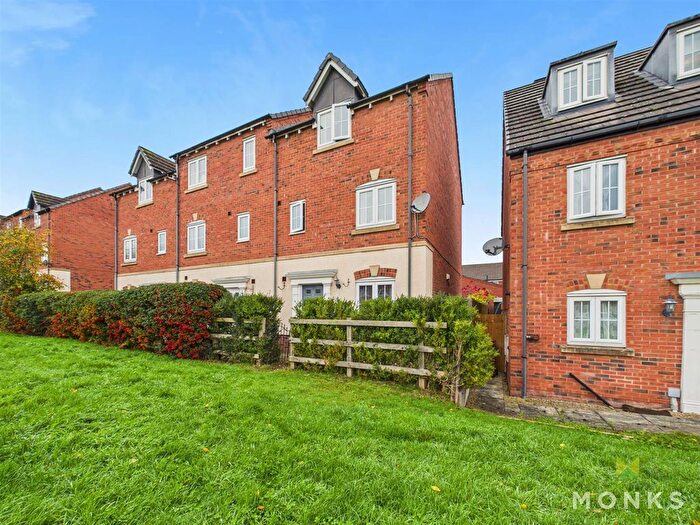
Houses for sale & to rent in Oswestry East, Oswestry
House Prices in Oswestry East
Properties in Oswestry East have an average house price of £211,228.00 and had 298 Property Transactions within the last 3 years¹.
Oswestry East is an area in Oswestry, Shropshire with 3,855 households², where the most expensive property was sold for £460,000.00.
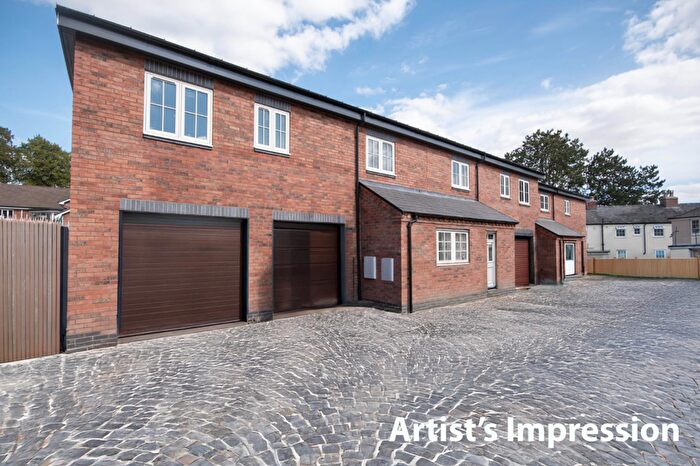
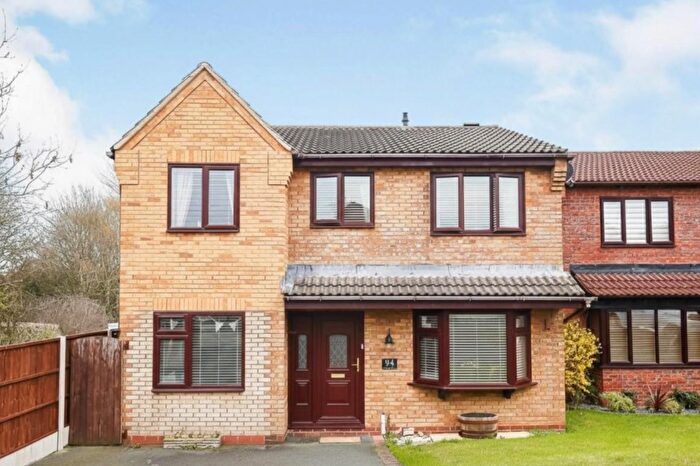
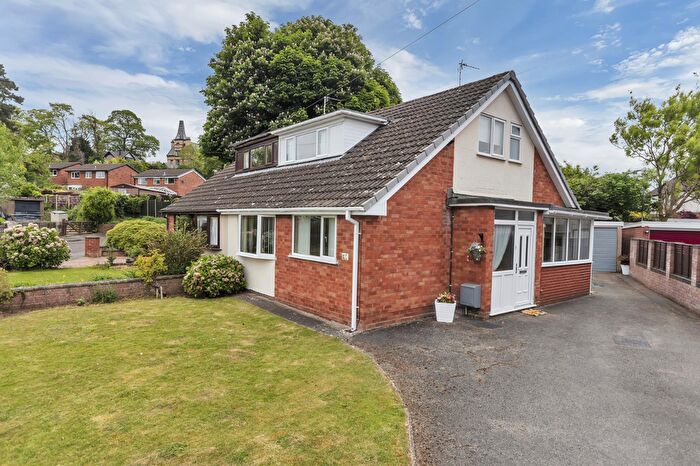
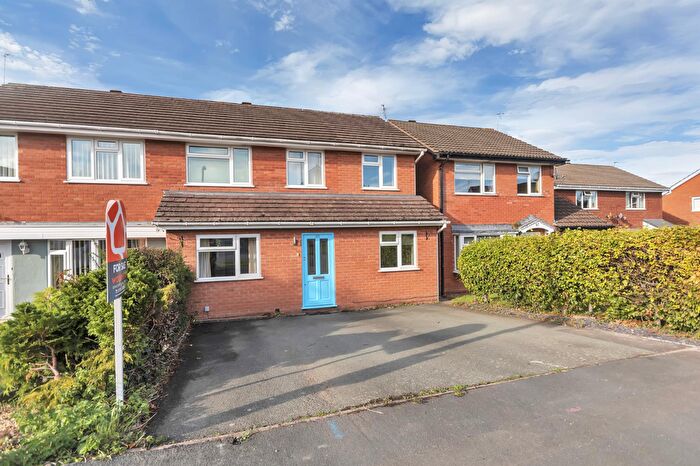
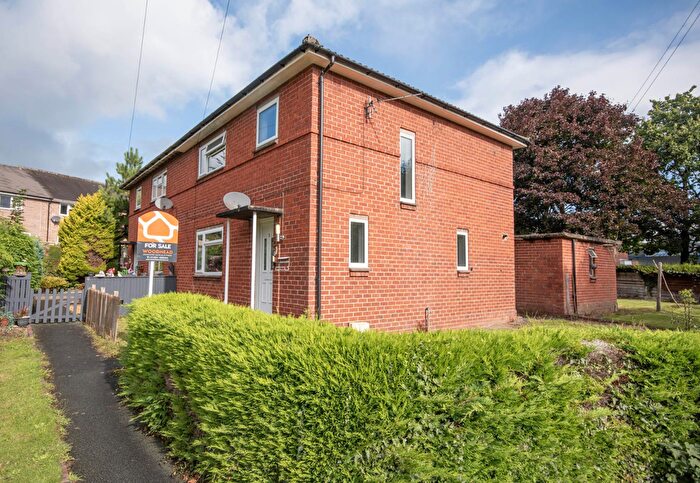
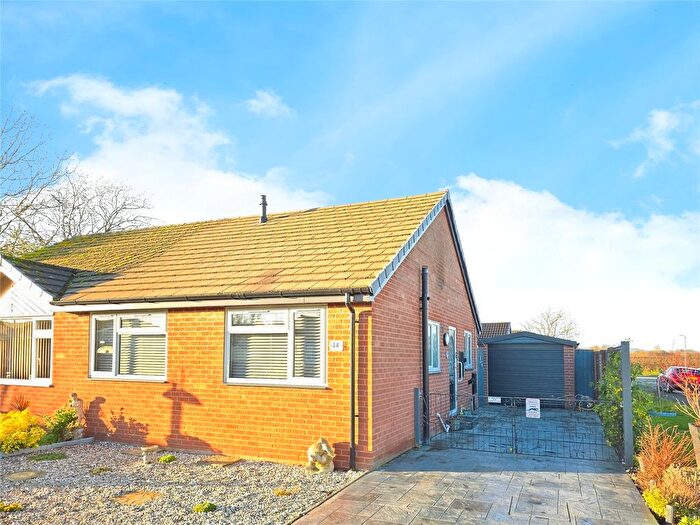
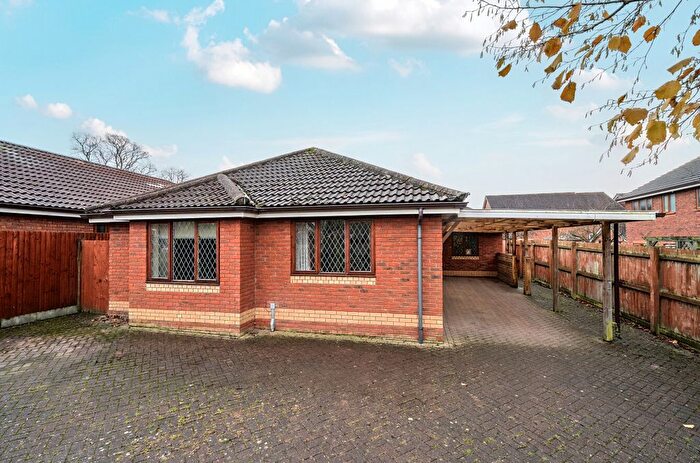
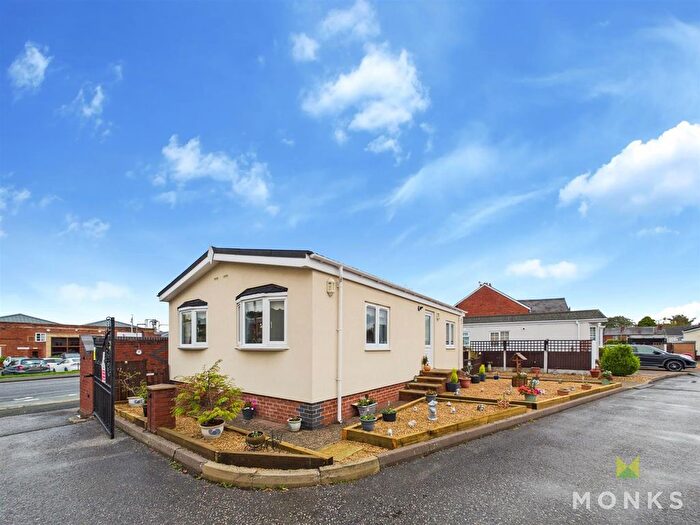
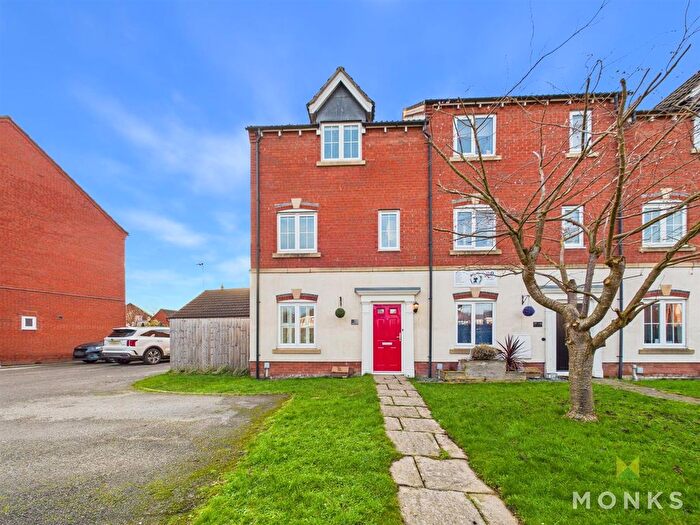
Properties for sale in Oswestry East
Previously listed properties in Oswestry East
Roads and Postcodes in Oswestry East
Navigate through our locations to find the location of your next house in Oswestry East, Oswestry for sale or to rent.
| Streets | Postcodes |
|---|---|
| Maesbury Road Industrial Estate | SY10 8NL SY10 8TN |
| Ambleside Road | SY11 2YJ |
| Ardmillan Close | SY11 2JZ |
| Ardmillan Court | SY11 2JG |
| Ardmillan Lane | SY11 2JY SY11 2JX |
| Ascot Close | SY11 2UP |
| Ascot Road | SY11 2RE |
| Aston Close | SY11 2XT SY11 2XU |
| Aston Way | SY11 2XY |
| Balmoral Close | SY11 2XL |
| Balmoral Crescent | SY11 2XG SY11 2XH SY11 2XQ SY11 2XZ |
| Barber Close | SY11 2UE |
| Barnfield Close | SY11 2TS |
| Beech Grove | SY11 2PT SY11 2PU SY11 2FF |
| Berwyn Villas | SY11 1JB |
| Biffen Road | SY11 2SN |
| Blackfriars | SY11 2DS SY11 2DT SY11 2DU |
| Blenheim Close | SY11 2UN |
| Border Close | SY11 2TT |
| Bridgeman Road | SY11 2JP SY11 2JR |
| Broadlands Way | SY11 2YD |
| Brookhouse Road | SY11 2JN SY11 2JW |
| Bryn Glas | SY11 2JH |
| Buckingham Close | SY11 2XJ |
| Cabin Lane | SY11 2LL SY11 2LS SY11 2LY SY11 2PF SY11 2DZ SY11 2LQ |
| Cae Melin Avenue | SY11 2US |
| Cambrian Court | SY11 1HH |
| Cambrian Drive | SY11 1HE SY11 1HF |
| Campbell Close | SY11 2XW |
| Canterbury Mews | SY11 2UW |
| Charles Parry Close | SY11 2TU |
| Chaucer Close | SY11 2UL |
| Chaucer Road | SY11 2DP SY11 2DR |
| Cherry Tree Drive | SY11 2QF SY11 2QG SY11 2QH SY11 2QQ SY11 2QJ |
| Chestnut Avenue | SY11 2QT SY11 2QU SY11 2QX SY11 2QY |
| College Road | SY11 2RZ SY11 2SA SY11 2SB SY11 2SG SY11 2SH SY11 2SQ |
| Combs La Ville Close | SY11 1UB |
| Copper Beech Court | SY11 2NH |
| Coppice Drive | SY11 1EX SY11 1EY SY11 1EZ |
| Cornovii Gardens | SY11 1JG |
| Crampton Court | SY11 2YP |
| Croxon Rise | SY11 2YQ |
| Diamond Avenue | SY11 2YR |
| Eaton Fields | SY11 2YU |
| Elgar Close | SY11 2LZ |
| Elm Close | SY11 2UR |
| Epsom Close | SY11 2PG |
| Ffynnon Gardens | SY11 2TY |
| Fir Grove | SY11 2QZ SY11 2RA |
| Friars Avenue | SY11 2JJ |
| Friars Close | SY11 2LR |
| Gatcombe Gardens | SY11 2YG |
| Glovers Meadow | SY10 8NH |
| Gobowen Road | SY11 1BX SY11 1GB SY11 1HT SY11 1HU SY10 7JU SY11 1HS |
| Gower Place | SY11 2DF SY11 2EH |
| Greenbank Close | SY11 2YH |
| Greyfriars | SY11 2DX SY11 2DY |
| Greystones Way | SY11 2SJ |
| Grosvenor Road | SY11 2PE |
| Guinevere Close | SY11 1UD |
| Harlech Close | SY11 2EJ |
| Harlech Court | SY11 2EX |
| Harlech Road | SY11 2EA |
| Hawthorn Grove | SY11 2PZ SY11 2QB |
| Hazel Grove | SY11 2PX SY11 2PY SY11 2XB |
| Heather Close | SY11 2UU |
| Henley Close | SY11 2SW |
| Henley Drive | SY11 2RF |
| Henry Jones Road | SY11 2YT |
| Highgrove | SY11 2YF |
| Holly Green | SY11 2QA |
| Honeysuckle Drive | SY11 2NX |
| Jasmine Close | SY11 1UE |
| Jasmine Gardens | SY11 1UA |
| Judge Meadow | SY11 2FG |
| Kay Close | SY11 2YS |
| Kensington Close | SY11 2XR |
| Knights Way | SY11 1UF |
| Laburnum Drive | SY11 2QP SY11 2QR SY11 2QW SY11 2GD |
| Langland Road | SY11 2DN SY11 2DW SY11 2DL |
| Lilac Grove | SY11 2SD |
| Lime Grove | SY11 2QD SY11 2QE |
| Llwyn Road | SY11 1EL SY11 1EN |
| Llys Avenue | SY11 2XE |
| Llys Close | SY11 2UZ |
| Llys Court | SY11 2UY |
| Llys Place | SY11 2UX |
| Llys Road | SY11 2UT SY11 2XD |
| Longueville Drive | SY11 2YN |
| Maes Y Clawdd | SY10 8NN |
| Malory Road | SY11 2DJ |
| Mandir Close | SY11 2GB |
| Maple Avenue | SY11 2SE SY11 2SF |
| Maple Court | SY11 2GA |
| Maplehurst Drive | SY11 1JQ |
| Meadow Close | SY11 2EB |
| Meadow Lea | SY11 2ED |
| Meadow Rise | SY11 2EE |
| Middleton Close | SY11 2XS |
| Middleton Road | SY11 2LA SY11 2LF SY11 2LH SY11 2LJ SY11 2PR SY11 2PS SY11 2XA SY11 2XX SY11 4LU SY11 2FE SY11 2LG SY11 2PP |
| Mile End Business Park | SY10 8GB |
| Minshall Place | SY11 2YW |
| Monkmoor Avenue | SY11 2LD |
| Monkmoor Close | SY11 2DB |
| Monkmoor Court | SY11 2XF |
| Monkmoor Road | SY11 2JQ SY11 2LB |
| New Park Road | SY11 1JF |
| Oak Drive | SY11 2RU SY11 2RX SY11 2RY |
| Offa Drive | SY11 1HA |
| Osbourne Close | SY11 2YE |
| Oswald Court | SY11 2TQ |
| Park Terrace | SY11 1JA |
| Pine Grove | SY11 2QS |
| Plas Ffynnon Way | SY11 2TZ |
| Plas Newydd Close | SY11 2TA |
| Powis Avenue | SY11 2JS SY11 2JT |
| Prince Charles Close | SY11 2LX |
| Prince Charles Road | SY11 2LT SY11 2LU |
| Queen Elizabeth Close | SY11 2UH |
| Queen Elizabeth Drive | SY11 2UQ SY11 2UF |
| Radfords Field | SY10 8RA |
| Roundwood Close | SY11 2YB |
| Sandringham Avenue | SY11 2UJ |
| Shelf Bank Close | SY11 2UG |
| Shelf Bank Cottages | SY11 2DA |
| Shrewsbury Road | SY11 2RT SY11 4JE SY11 4QA SY11 4QB |
| Smale Rise | SY11 2YL |
| Southgate Close | SY11 2RR |
| St James Close | SY11 2XN |
| Summerfield Close | SY11 2YA |
| Sycamore Drive | SY11 2RS |
| The Green | SY11 2QL SY11 2QN |
| The Tradestop | SY10 8NU |
| Thomas Savin Road | SY11 1GA |
| Unicorn Road | SY11 2DD SY11 2DG SY11 2DH SY11 2UD SY11 1JT SY11 2DE SY11 2DQ SY11 2WA |
| Varley Rise | SY11 1FF |
| Walford Road | SY11 2JU SY11 2LE |
| Wats Drive | SY11 1ET |
| Weaver Close | SY11 2NW |
| Wedge Mews | SY11 2NP |
| Western Drive | SY11 1HB SY11 1HD |
| Whitefriars | SY11 2LN SY11 2LP SY11 2LW |
| Whitfield Close | SY11 2XP |
| Whittington Road | SY11 1HY SY11 1JD SY11 1HZ SY11 1JE SY11 1JH |
| Wilfred Owen Avenue | SY11 2NB |
| Wilfred Owen Close | SY11 2ND |
| Wilfred Owen Road | SY11 2NA |
| Windsor Close | SY11 2UA |
| Windsor Road | SY11 2UB |
| Woodlands Close | SY11 2TX |
| Woodside | SY11 1EP |
| Woodside Court | SY11 1ER |
Transport near Oswestry East
- FAQ
- Price Paid By Year
- Property Type Price
Frequently asked questions about Oswestry East
What is the average price for a property for sale in Oswestry East?
The average price for a property for sale in Oswestry East is £211,228. This amount is 21% lower than the average price in Oswestry. There are 385 property listings for sale in Oswestry East.
What streets have the most expensive properties for sale in Oswestry East?
The streets with the most expensive properties for sale in Oswestry East are Broadlands Way at an average of £375,000, Plas Newydd Close at an average of £355,000 and Wilfred Owen Avenue at an average of £340,000.
What streets have the most affordable properties for sale in Oswestry East?
The streets with the most affordable properties for sale in Oswestry East are Park Terrace at an average of £90,333, Eaton Fields at an average of £110,000 and Llys Court at an average of £132,500.
Which train stations are available in or near Oswestry East?
Some of the train stations available in or near Oswestry East are Gobowen, Chirk and Ruabon.
Property Price Paid in Oswestry East by Year
The average sold property price by year was:
| Year | Average Sold Price | Price Change |
Sold Properties
|
|---|---|---|---|
| 2025 | £222,038 | 5% |
99 Properties |
| 2024 | £210,248 | 5% |
110 Properties |
| 2023 | £200,415 | -2% |
89 Properties |
| 2022 | £204,627 | 7% |
127 Properties |
| 2021 | £190,815 | 13% |
161 Properties |
| 2020 | £166,601 | 10% |
138 Properties |
| 2019 | £150,395 | -3% |
147 Properties |
| 2018 | £154,188 | 0,3% |
118 Properties |
| 2017 | £153,699 | 3% |
138 Properties |
| 2016 | £148,829 | 2% |
153 Properties |
| 2015 | £146,511 | 4% |
171 Properties |
| 2014 | £140,079 | 6% |
144 Properties |
| 2013 | £131,013 | 2% |
123 Properties |
| 2012 | £127,882 | -1% |
108 Properties |
| 2011 | £129,234 | -6% |
90 Properties |
| 2010 | £137,026 | 5% |
114 Properties |
| 2009 | £129,865 | -12% |
120 Properties |
| 2008 | £145,553 | 1% |
86 Properties |
| 2007 | £144,315 | -1% |
203 Properties |
| 2006 | £145,396 | 11% |
244 Properties |
| 2005 | £128,986 | 3% |
163 Properties |
| 2004 | £125,039 | 19% |
195 Properties |
| 2003 | £101,239 | 21% |
225 Properties |
| 2002 | £79,578 | 18% |
231 Properties |
| 2001 | £65,195 | 10% |
257 Properties |
| 2000 | £58,969 | 8% |
203 Properties |
| 1999 | £54,116 | 10% |
220 Properties |
| 1998 | £48,772 | 5% |
190 Properties |
| 1997 | £46,336 | 3% |
184 Properties |
| 1996 | £44,862 | -3% |
187 Properties |
| 1995 | £46,228 | - |
155 Properties |
Property Price per Property Type in Oswestry East
Here you can find historic sold price data in order to help with your property search.
The average Property Paid Price for specific property types in the last three years are:
| Property Type | Average Sold Price | Sold Properties |
|---|---|---|
| Flat | £115,555.00 | 9 Flats |
| Semi Detached House | £193,843.00 | 143 Semi Detached Houses |
| Detached House | £272,869.00 | 94 Detached Houses |
| Terraced House | £164,166.00 | 52 Terraced Houses |

