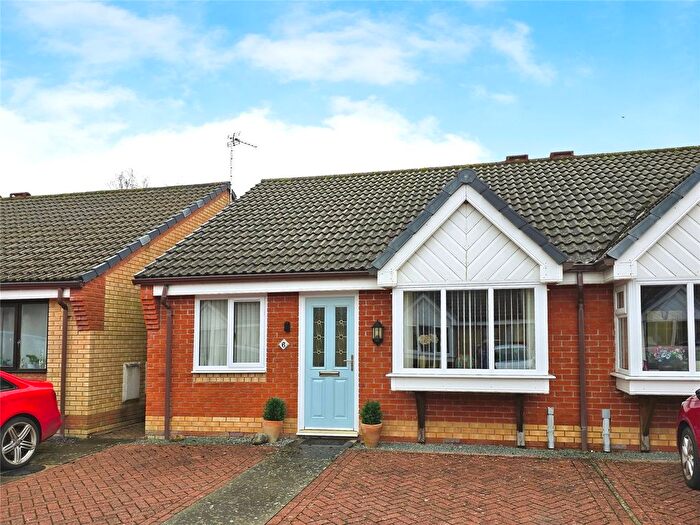
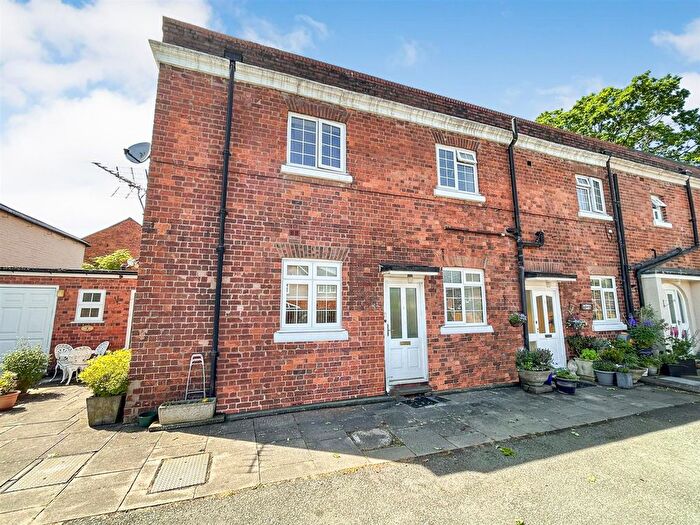
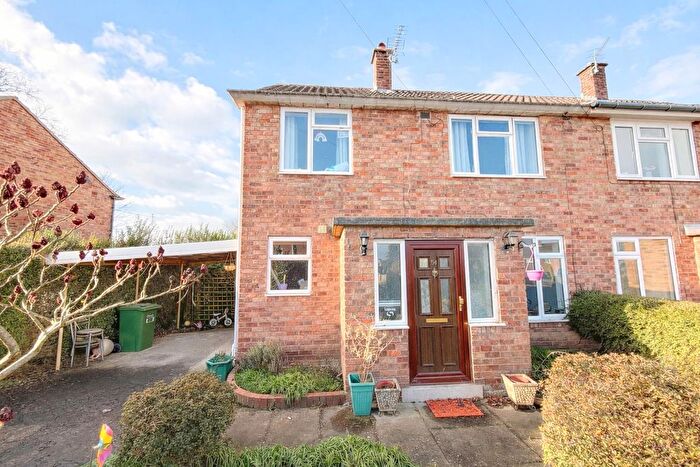
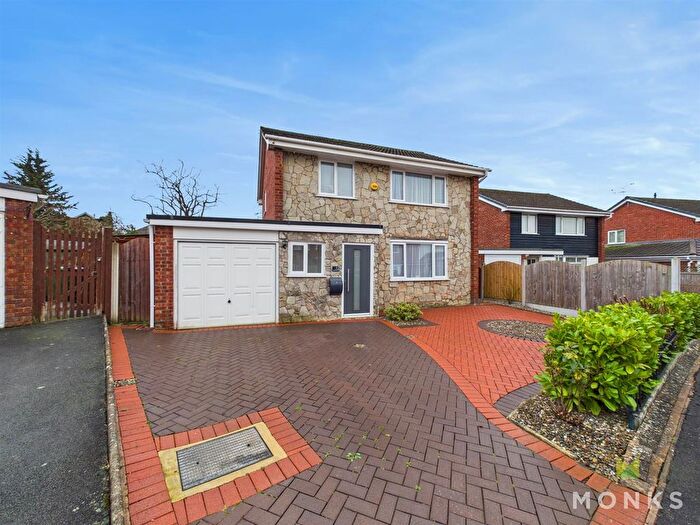
Houses for sale & to rent in Oswestry South, Oswestry
House Prices in Oswestry South
Properties in Oswestry South have an average house price of £245,627.00 and had 208 Property Transactions within the last 3 years¹.
Oswestry South is an area in Oswestry, Shropshire with 1,994 households², where the most expensive property was sold for £920,000.00.
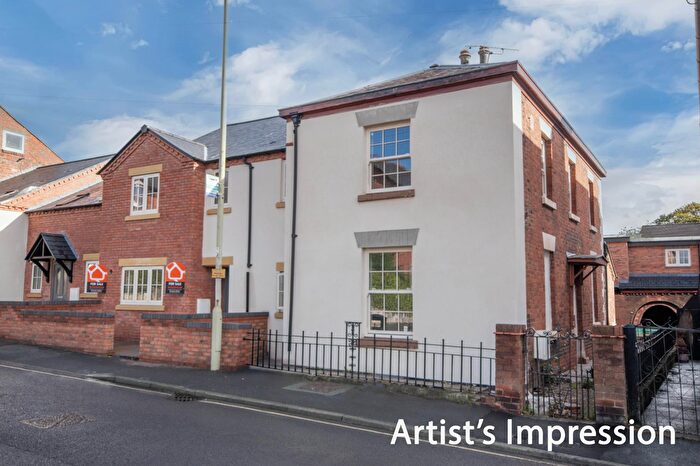
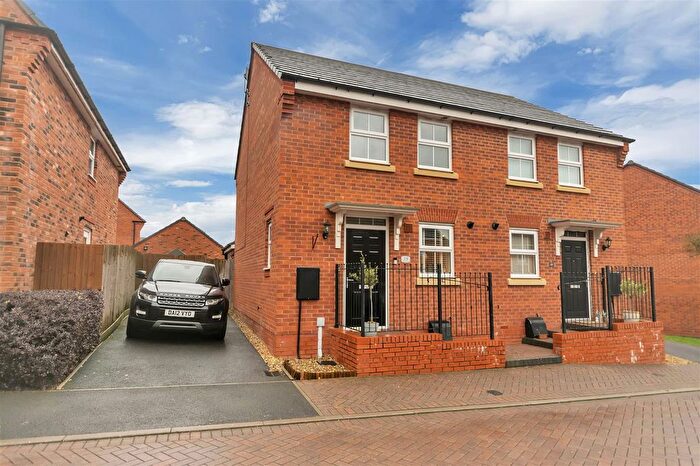
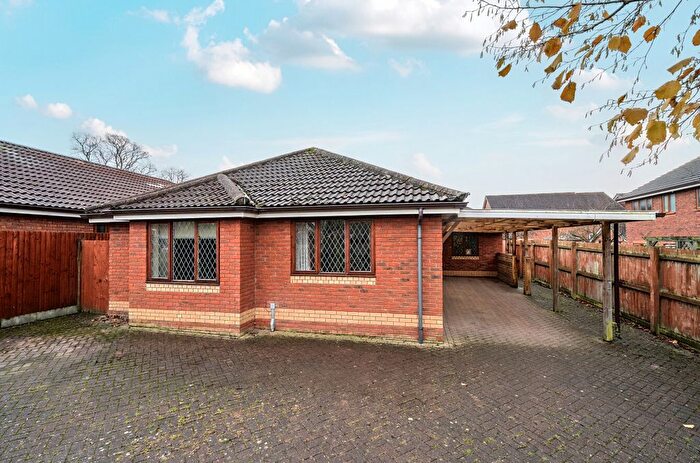
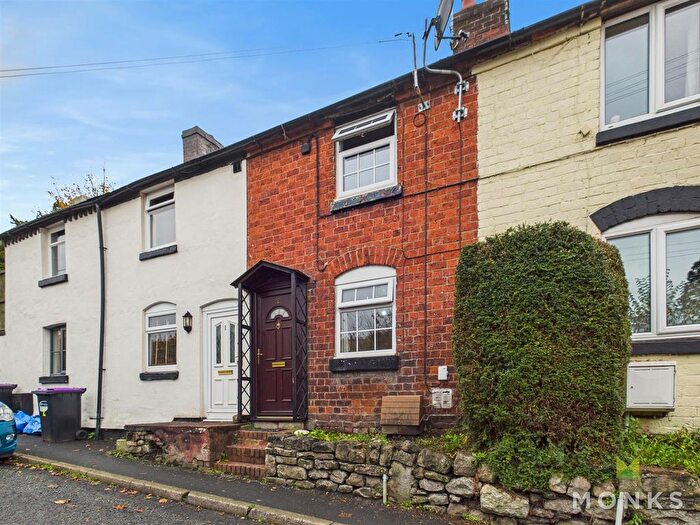
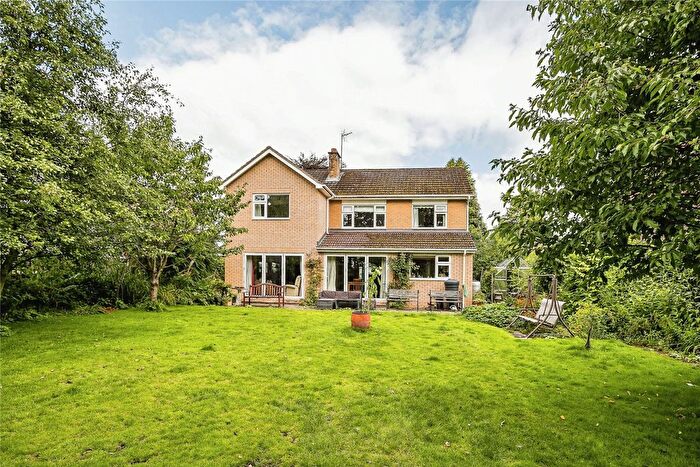
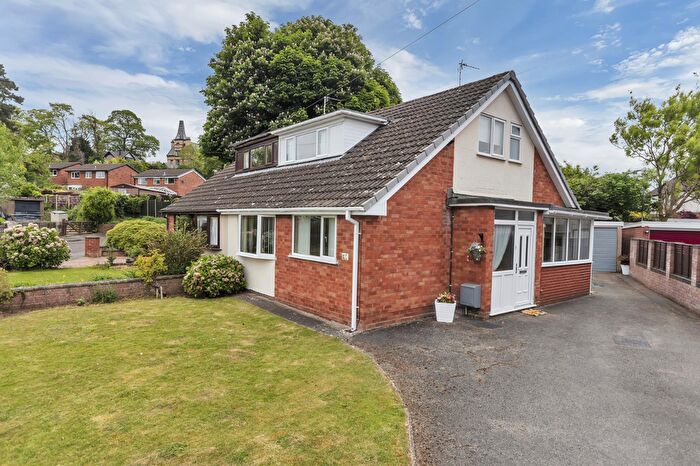
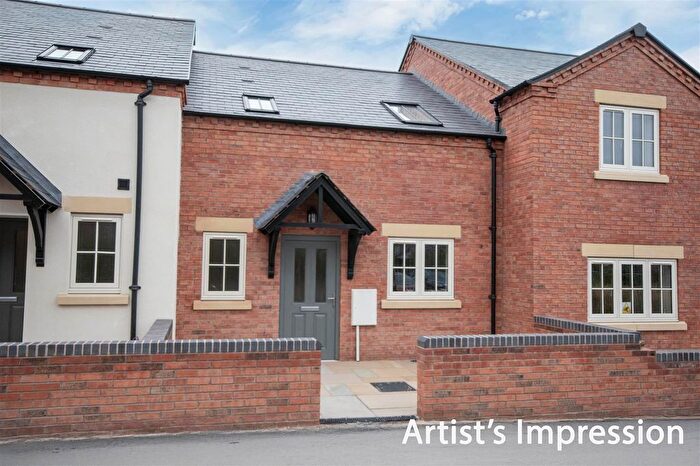
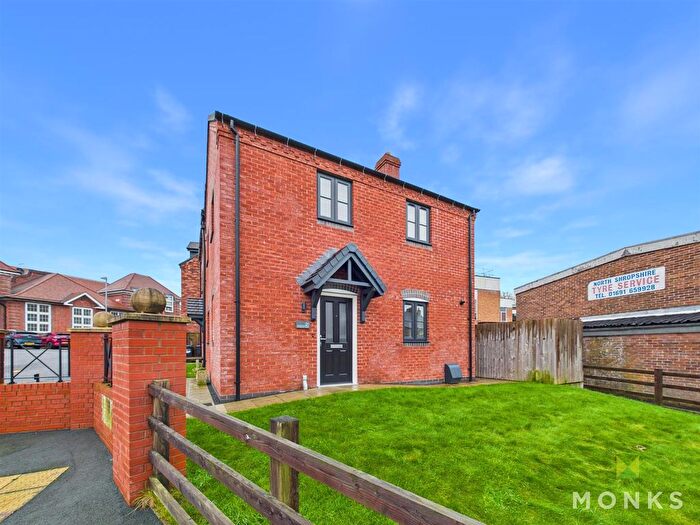
Properties for sale in Oswestry South
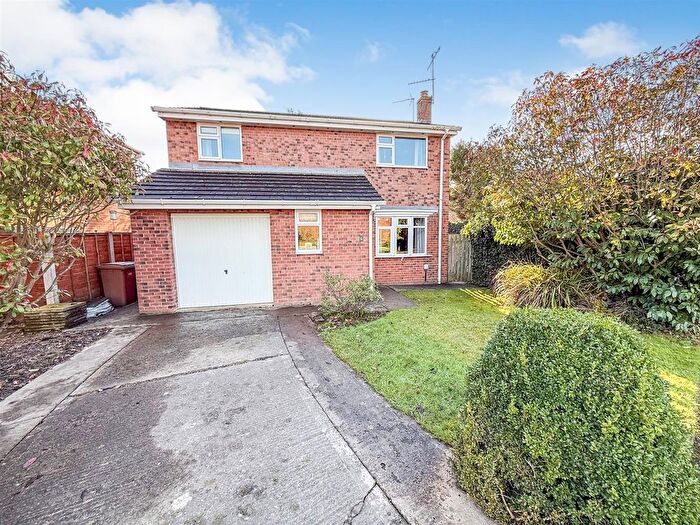
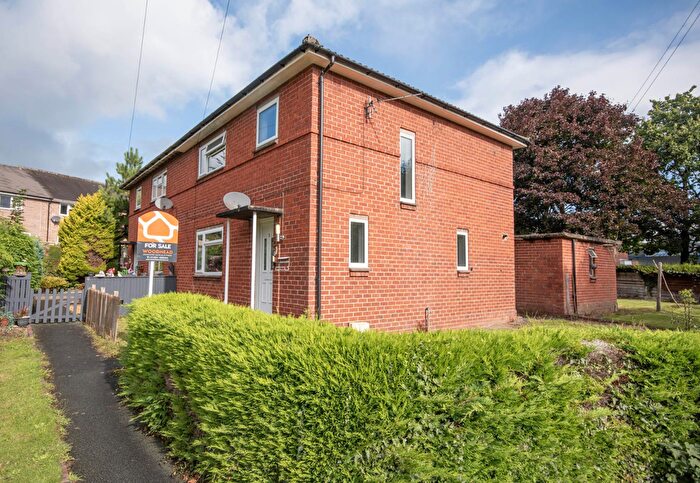
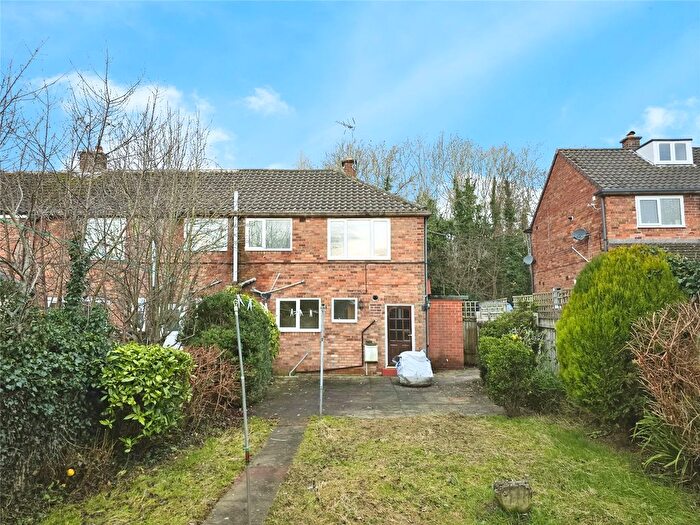
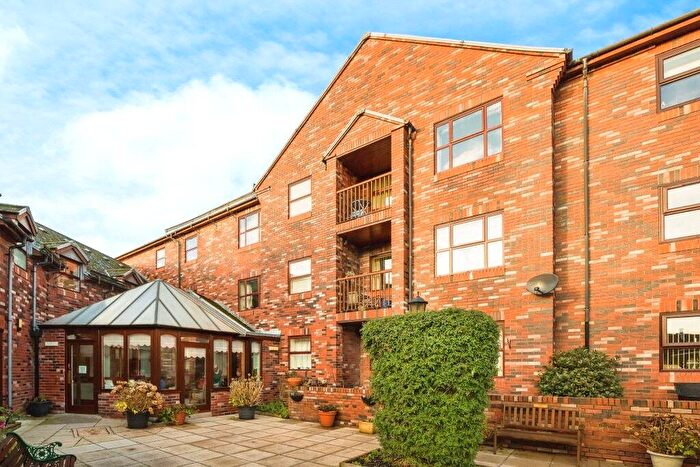
Previously listed properties in Oswestry South
Roads and Postcodes in Oswestry South
Navigate through our locations to find the location of your next house in Oswestry South, Oswestry for sale or to rent.
| Streets | Postcodes |
|---|---|
| Albion Hill | SY11 1QA |
| Arthur Street | SY11 1JN SY11 1JR |
| Bailey Head | SY11 1PZ |
| Bailey Street | SY11 1PS SY11 1PU SY11 1PX |
| Bay Cottages | SY11 2PJ |
| Beatrice Street | SY11 1QG SY11 1QD SY11 1QE SY11 1QN SY11 1QW |
| Bentley Drive | SY11 1TQ |
| Beresford Gardens | SY11 2SL |
| Black Gate Street | SY11 2EF |
| Breidden Close | SY11 1TT |
| Broomhall Close | SY10 7HF |
| Broomhall Lane | SY10 7HG SY10 7HQ |
| Bryn Rise | SY11 1TU |
| Brynhafod Lane | SY11 1SH |
| Castle House Mews | SY11 1DQ |
| Castle Street | SY11 1JY SY11 1JZ |
| Castle View | SY11 1LH |
| Caxton Place | SY11 1QP |
| Church Street | SY11 2SP SY11 2SY SY11 2SZ SY11 2SS SY11 2ST SY11 2SU SY11 2SX |
| Church Terrace | SY11 2TE |
| Coney Green | SY11 2JL |
| Croeswylan Close | SY10 9PS |
| Croeswylan Crescent | SY10 9PP SY10 9PW |
| Croeswylan Lane | SY10 9PN SY10 9PR SY10 9PT SY10 9RR |
| Cross Street | SY11 2NF SY11 2NG |
| Eden Court | SY11 1QB |
| Eden Street | SY11 1QY |
| Edward Street | SY11 2BL SY11 2BN |
| English Walls | SY11 2PA |
| Ferrers Road | SY11 2EY SY11 2EZ |
| Ffynnon Court | SY11 2RH |
| Fitzalan Road | SY11 1RX |
| High Fawr Avenue | SY11 1TG |
| High Fawr Close | SY11 1TE |
| High Lea Close | SY11 1SX |
| Holbache Road | SY11 1RP SY11 1RY |
| Horse Market | SY11 1JS |
| Jemmett Close | SY11 2TR |
| Jennings Road | SY11 1RU |
| King Street | SY11 1QX |
| Lakeholme Gardens | SY11 1RJ |
| Leg Street | SY11 2NL SY11 2NN |
| Leighton Place | SY11 2HN |
| Llanforda Close | SY11 1SZ |
| Llanforda Mead | SY11 1TS |
| Llanforda Rise | SY11 1SY |
| Llys Lane | SY11 2PH |
| Lord Street | SY11 1LE |
| Lower Brook Street | SY11 2HJ SY11 2HG SY11 2HL |
| Lower Fawr | SY11 1TR |
| Lower Minster | SY11 1SE |
| Lutton Close | SY11 2GZ SY11 2TH SY11 2BF |
| Lyndale Villas | SY11 2EU |
| Madog Place | SY11 1QJ |
| Maserfield | SY11 1RZ SY11 1SA SY11 1SB |
| Maserfield Close | SY11 1TA |
| Middleton Road | SY11 2PN SY11 2RB SY11 2RD |
| Morda Close | SY11 2BA |
| Morda Road | SY11 2AS SY11 2AT SY11 2AU SY11 2AW SY11 2AX SY11 2AY SY11 2AR |
| New Street | SY11 1PY |
| Oerley Close | SY11 1TF |
| Oerley Way | SY11 1TD |
| Old Chapel Court | SY11 2PD |
| Olwen Terrace | SY11 1LQ |
| Orchard Street | SY11 1QZ |
| Oswald Mews | SY11 2TF |
| Oswald Place | SY11 2FH |
| Oswald Road | SY11 1RE SY11 1DZ SY11 1RB SY11 1RD |
| Oswald Row | SY11 1QL |
| Oswalds Close | SY11 2TD |
| Oswalds Well Lane | SY11 2TP |
| Park Street | SY11 2HD SY11 2HE |
| Park Street Close | SY11 2HH |
| Penylan Lane | SY11 2AG SY11 2AQ SY11 2AJ |
| Police Houses | SY11 2HF |
| Powis Place | SY11 1JU |
| Primrose Court | SY11 2AH |
| Queens Close | SY11 2JA |
| Queens Court | SY11 2YX |
| Queens Park | SY11 2JD |
| Queens Park Gardens | SY11 2HZ |
| Queens Road | SY11 2HY SY11 2JB |
| Regent Court | SY11 2BU |
| Roft Street | SY11 2EN SY11 2EP SY11 2ET SY11 2FD SY11 2ER |
| Salop Road | SY11 2NR SY11 2RJ SY11 2RL SY11 2NQ SY11 2NU SY11 2NZ SY11 2RN SY11 2RP |
| Salter Close | SY11 2EW |
| School View | SY11 2TN |
| Shaw Park | SY11 2EQ |
| Smithfield Road | SY11 2EL |
| Smithfield Street | SY11 2EG |
| Stanley Place | SY11 2RG |
| Station Road | SY11 1RA |
| Stewart Road | SY11 2HA SY11 2HB |
| The Cross | SY11 1PJ SY11 1PN SY11 1PP SY11 1PW SY11 1RQ SY11 2SR |
| Trefonen Road | SY11 2TW |
| Upper Brook Street | SY11 2TB SY11 2TG SY11 2TJ SY11 2TL |
| Upper Church Street | SY11 2AA SY11 2AD SY11 2AE SY11 2AF |
| Upper Well Close | SY11 1TW |
| Vicarage Court | SY11 2NJ |
| Vicarage Drive | SY11 2AL |
| Victoria Close | SY11 2BX |
| Victoria Crescent | SY11 2RW |
| Victoria Fields | SY11 2BT |
| Victoria Green | SY11 2BY |
| Victoria Parade | SY11 2ES |
| Victoria Road | SY11 2HP SY11 2HS SY11 2HT SY11 2HU SY11 2BZ SY11 2HR SY11 2HW SY11 2HX SY11 2JE SY11 2JF SY11 2PQ |
| Victoria Street | SY11 2BP SY11 2BW |
| Watkin Drive | SY11 1SQ |
| Welsh Walls | SY11 1AP SY11 1RN SY11 1RW |
| West Street | SY11 2BS |
| Weston Avenue | SY11 2BH SY11 2BJ |
| Weston Lane | SY11 2BB SY11 2BD SY11 2BG SY11 2BQ |
| Whiteminster | SY11 1SF |
| William Felton Mews | SY11 2RQ |
| Willow Mews | SY11 1LF SY11 1PH |
| Willow Street | SY11 1AD SY11 1AF SY11 1AQ SY11 1AA SY11 1AG SY11 1JL SY11 1PR |
| Wilmot Drive | SY11 2BE |
| Wilmot Road | SY11 2AZ |
Transport near Oswestry South
- FAQ
- Price Paid By Year
- Property Type Price
Frequently asked questions about Oswestry South
What is the average price for a property for sale in Oswestry South?
The average price for a property for sale in Oswestry South is £245,627. This amount is 8% lower than the average price in Oswestry. There are 465 property listings for sale in Oswestry South.
What streets have the most expensive properties for sale in Oswestry South?
The streets with the most expensive properties for sale in Oswestry South are Morda Close at an average of £672,300, Queens Park at an average of £658,000 and Weston Lane at an average of £568,333.
What streets have the most affordable properties for sale in Oswestry South?
The streets with the most affordable properties for sale in Oswestry South are Caxton Place at an average of £80,000, Orchard Street at an average of £88,583 and Lord Street at an average of £100,000.
Which train stations are available in or near Oswestry South?
Some of the train stations available in or near Oswestry South are Gobowen, Chirk and Ruabon.
Property Price Paid in Oswestry South by Year
The average sold property price by year was:
| Year | Average Sold Price | Price Change |
Sold Properties
|
|---|---|---|---|
| 2025 | £254,637 | -3% |
75 Properties |
| 2024 | £263,545 | 19% |
71 Properties |
| 2023 | £214,208 | -2% |
62 Properties |
| 2022 | £218,646 | -1% |
89 Properties |
| 2021 | £221,770 | 9% |
111 Properties |
| 2020 | £200,784 | 21% |
89 Properties |
| 2019 | £157,635 | -40% |
86 Properties |
| 2018 | £221,383 | 13% |
74 Properties |
| 2017 | £192,690 | -3% |
83 Properties |
| 2016 | £198,309 | 3% |
83 Properties |
| 2015 | £192,052 | 8% |
92 Properties |
| 2014 | £177,241 | -5% |
87 Properties |
| 2013 | £185,227 | 8% |
84 Properties |
| 2012 | £170,952 | 1% |
51 Properties |
| 2011 | £169,140 | -3% |
51 Properties |
| 2010 | £174,498 | 3% |
57 Properties |
| 2009 | £169,949 | -25% |
59 Properties |
| 2008 | £211,885 | 6% |
60 Properties |
| 2007 | £199,988 | 5% |
193 Properties |
| 2006 | £189,608 | 5% |
163 Properties |
| 2005 | £180,294 | 6% |
116 Properties |
| 2004 | £168,867 | 20% |
117 Properties |
| 2003 | £135,116 | 33% |
111 Properties |
| 2002 | £89,869 | 8% |
108 Properties |
| 2001 | £82,544 | 13% |
92 Properties |
| 2000 | £71,504 | 20% |
98 Properties |
| 1999 | £57,455 | -1% |
98 Properties |
| 1998 | £58,254 | 7% |
89 Properties |
| 1997 | £54,105 | -10% |
109 Properties |
| 1996 | £59,273 | 8% |
88 Properties |
| 1995 | £54,827 | - |
65 Properties |
Property Price per Property Type in Oswestry South
Here you can find historic sold price data in order to help with your property search.
The average Property Paid Price for specific property types in the last three years are:
| Property Type | Average Sold Price | Sold Properties |
|---|---|---|
| Flat | £124,685.00 | 27 Flats |
| Semi Detached House | £220,728.00 | 26 Semi Detached Houses |
| Detached House | £374,151.00 | 75 Detached Houses |
| Terraced House | £174,046.00 | 80 Terraced Houses |

