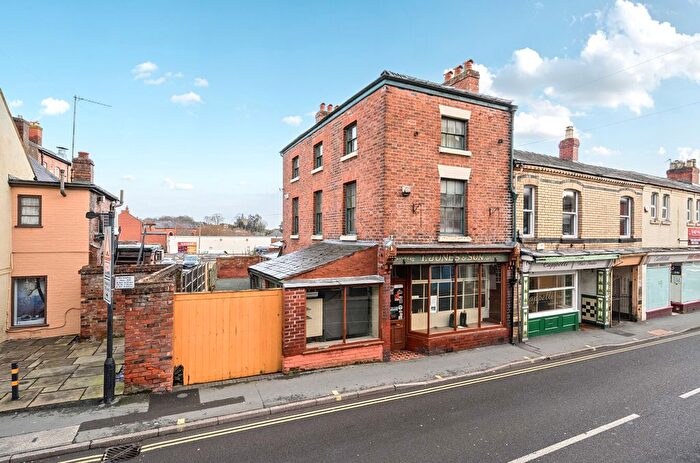
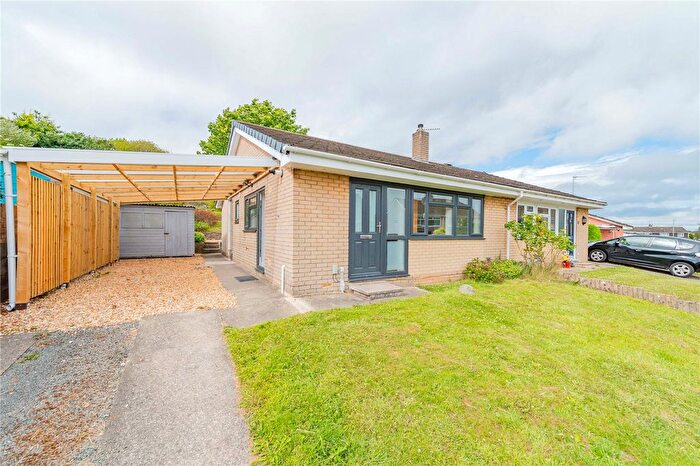
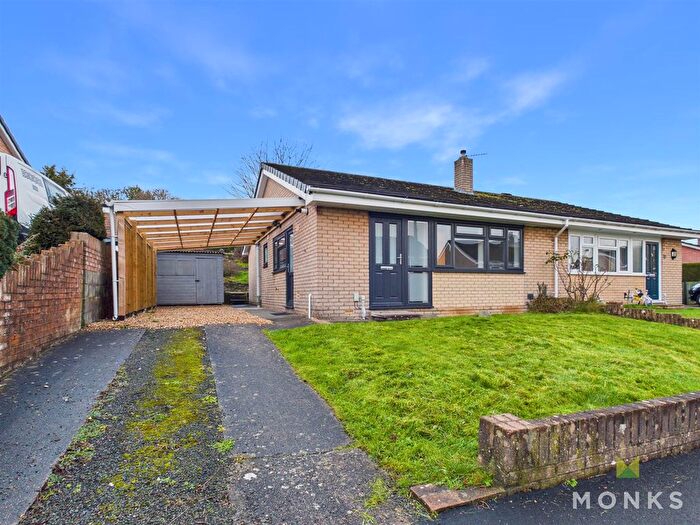
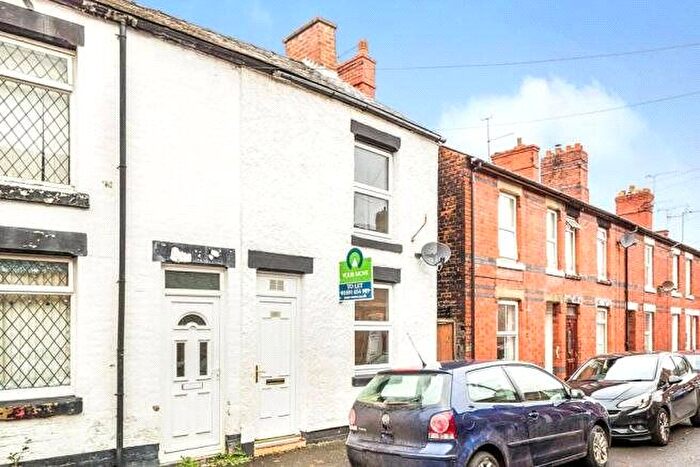
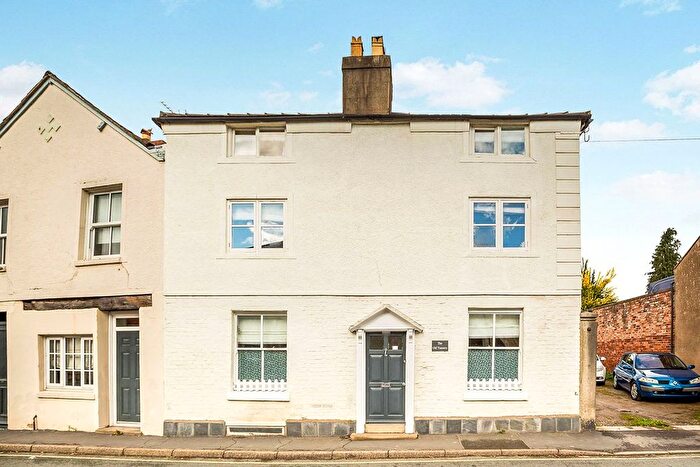
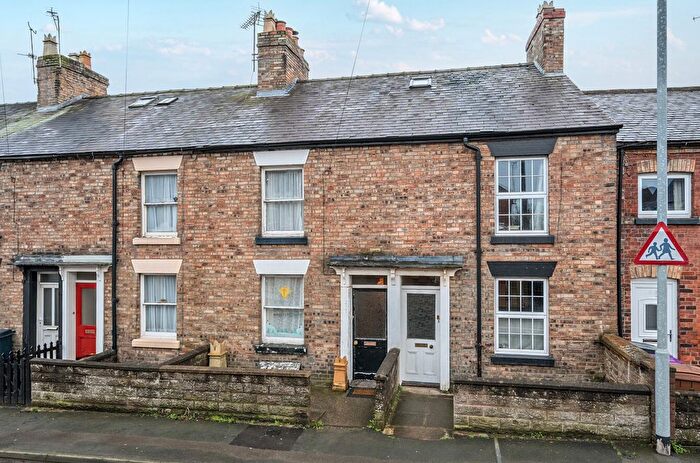
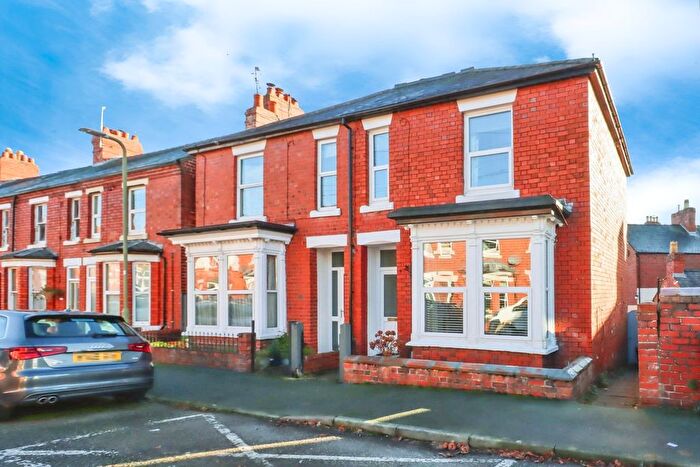
Houses for sale & to rent in Oswestry West, Oswestry
House Prices in Oswestry West
Properties in Oswestry West have an average house price of £216,757.00 and had 177 Property Transactions within the last 3 years¹.
Oswestry West is an area in Oswestry, Shropshire with 1,811 households², where the most expensive property was sold for £775,000.00.
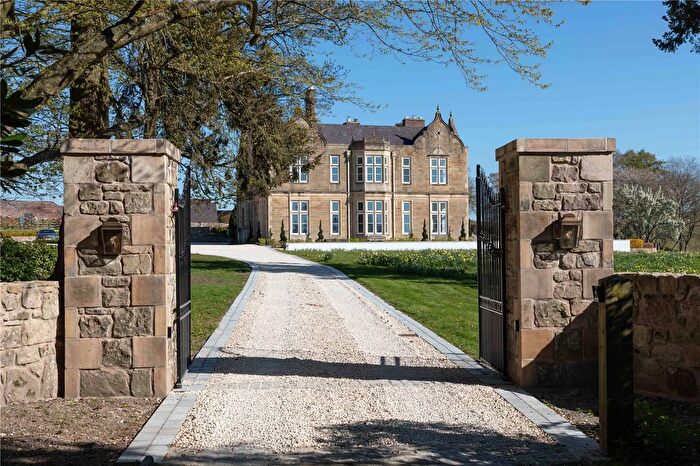
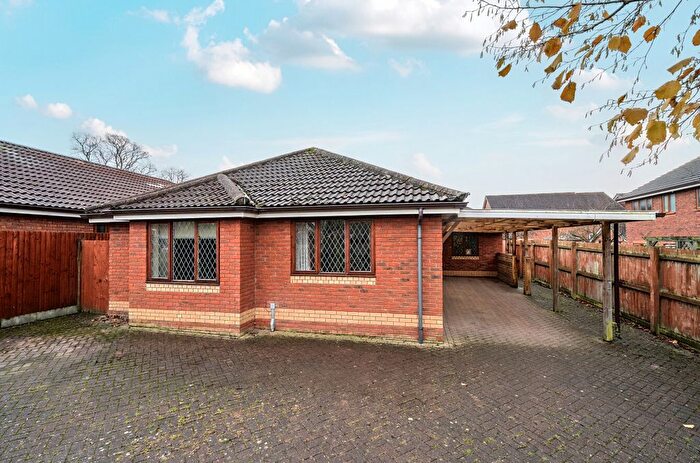
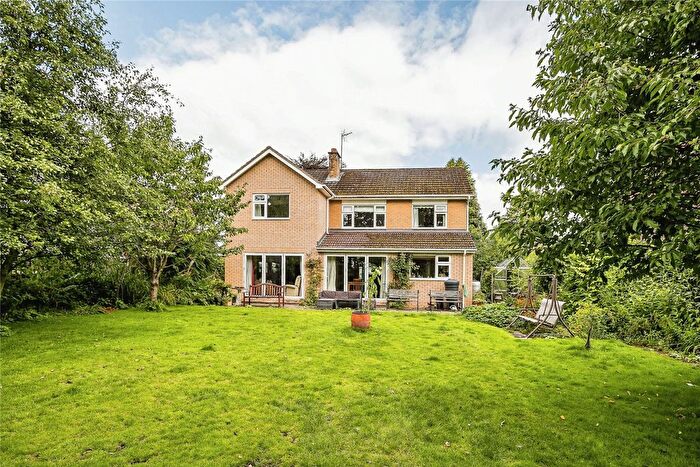
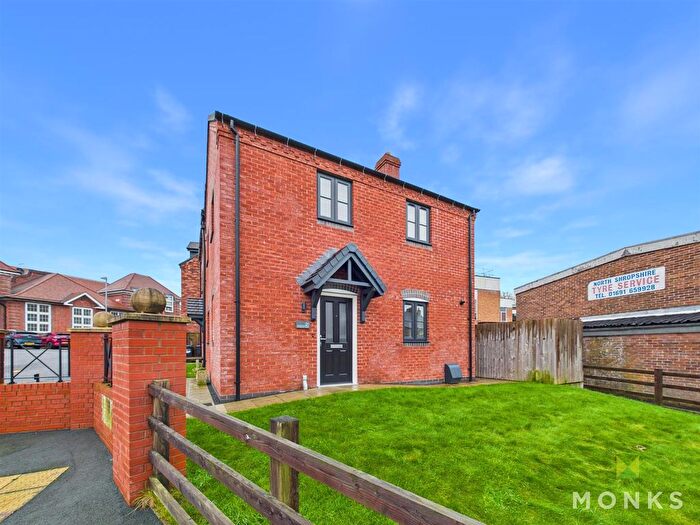
Properties for sale in Oswestry West
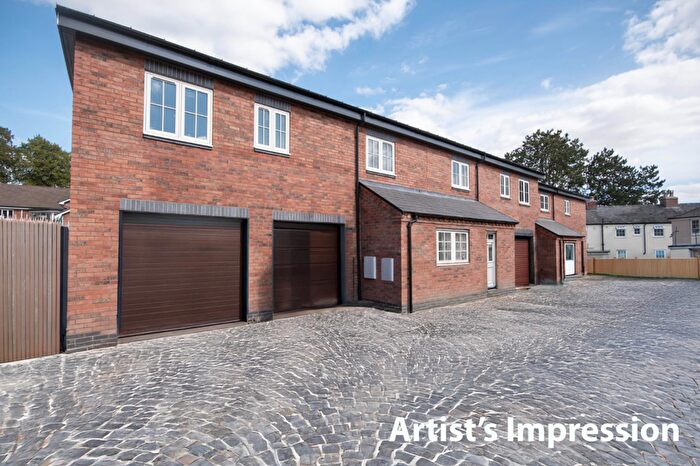
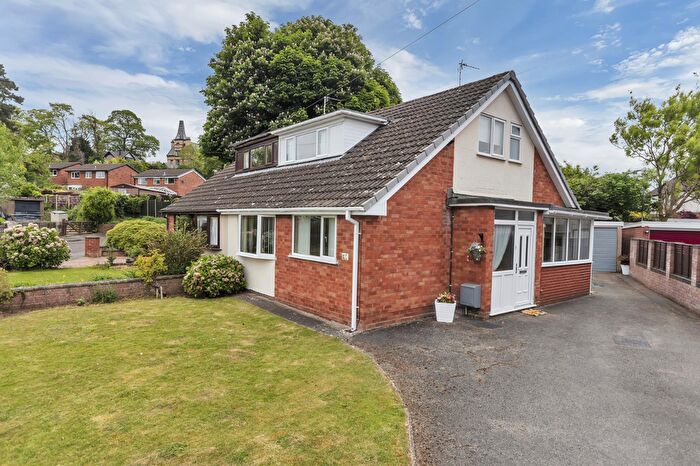
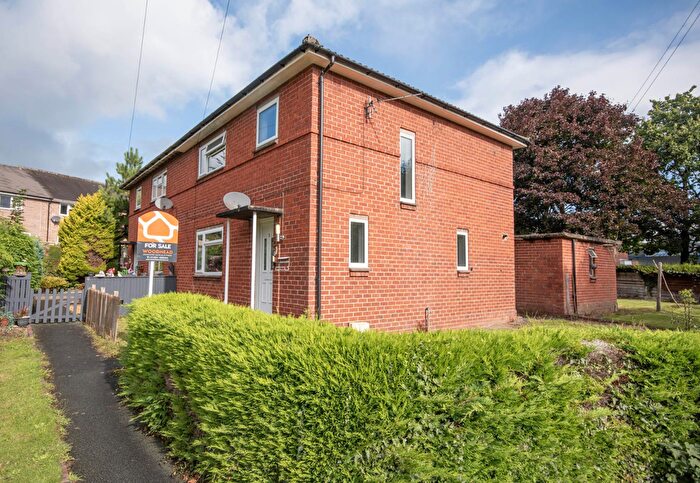
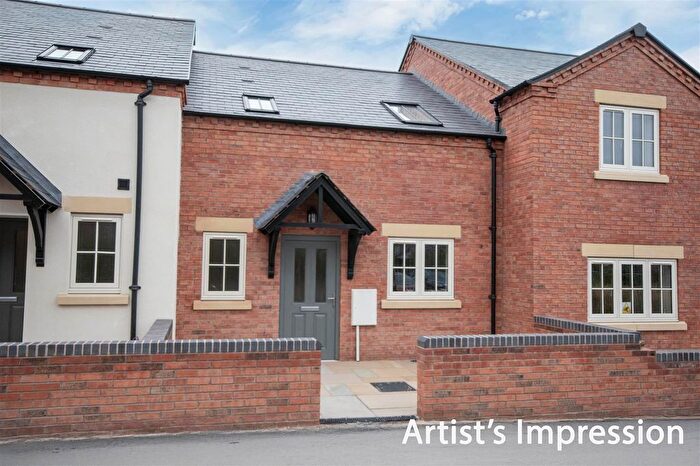
Previously listed properties in Oswestry West
Roads and Postcodes in Oswestry West
Navigate through our locations to find the location of your next house in Oswestry West, Oswestry for sale or to rent.
| Streets | Postcodes |
|---|---|
| Albert Mews | SY11 1LP |
| Albert Road | SY11 1NF SY11 1NH SY11 1NJ SY11 1NQ |
| Alexandra Road | SY11 1LU |
| Arundel Road | SY11 1AR SY11 1AS SY11 1AT |
| Ash Road | SY11 1NB |
| Beatrice Street | SY11 1HL SY11 1HP SY11 1HW SY11 1QR |
| Bradley Fields | SY11 1SP |
| Brynhafod Drive | SY11 1SG |
| Brynhafod Road | SY11 1RR SY11 1RT SY11 1RS |
| Caer Road | SY11 1EA SY11 1EB SY11 1ED |
| Cambrian Place | SY11 1QU |
| Castle Street | SY11 1LA |
| Castlefields | SY11 1DD |
| Cranbrook Drive | SY11 1NY |
| Crestwood Bungalows | SY11 1DL |
| Crestwood Court | SY11 1DB |
| Denham Drive | SY11 1NU |
| Denmark Place | SY11 1NG |
| Drill Hall Cottages | SY11 1AN |
| Findon Drive | SY11 1NX |
| Fort View | SY11 1EG |
| Garden View | SY11 1FE |
| Gatacre Avenue | SY11 1DP SY11 1DR |
| Gatacre Road | SY11 1DN |
| Gate Street | SY11 1EH |
| Gittin Street | SY11 1DS SY11 1DU SY11 1DX SY11 1DY SY11 1FD SY11 1DT |
| Glanaber Terrace | SY11 1LN |
| Green End | SY11 1BT SY11 1BU |
| Hafod Close | SY11 1UT |
| Hampton Close | SY11 1SL |
| Hampton Fields | SY11 1TJ SY11 1TL |
| Hampton Rise | SY11 1ST SY11 1SU |
| Hampton Road | SY11 1SJ SY11 1SN SY11 1SW |
| Hayes Close | SY11 1TN |
| Hayes View | SY11 1TP |
| High Fawr Avenue | SY11 1TB |
| Hignett Place | SY11 1ES |
| Hillside | SY11 1DW |
| Holbache Gardens | SY11 1BF |
| Hurdsman Street | SY11 1LY |
| Liverpool Road | SY11 1NN SY11 1NW |
| Liverpool Road West | SY11 1BJ SY11 1PE |
| Lizbeth Close | SY11 1BZ |
| Lloyd Street | SY11 1NL |
| Llwyn Fields | SY11 1HG |
| Llwyn Road | SY11 1EJ SY11 1EW |
| Llwyn Terrace | SY11 1HR |
| Lorne Street | SY11 1ND SY11 1NE |
| Lower Hafod | SY11 1UX |
| Mount Crescent | SY11 1SR SY11 1SS |
| Mount Drive | SY11 1BG SY11 1BQ |
| Mount Rise | SY11 1HJ |
| Mount Road | SY11 1BB SY11 1BE SY11 1BD |
| Oak Street | SY11 1LJ SY11 1LL SY11 1LW SY11 1GD SY11 1LR SY11 1FB |
| Oakhurst Avenue | SY11 1BP SY11 1BS |
| Oakhurst Road | SY11 1BH SY11 1BL |
| Old Fort Road | SY11 1EE SY11 1EF SY11 1EQ |
| Park Avenue | SY11 1AU SY11 1AX SY11 1AY SY11 1AZ SY11 1BA SY11 1FA |
| Park Drive | SY11 1BN SY11 1BW |
| Prince Street | SY11 1LB SY11 1LD |
| Sefton Place | SY11 1PB |
| South View | SY11 1PF |
| Swan Lane | SY11 1DH |
| Thornhurst Avenue | SY11 1NR |
| Union Place | SY11 1HN |
| Upper Ash Road | SY11 1LG SY11 1PL SY11 1PQ |
| Upper Lord Street | SY11 1LT |
| Vyrnwy Place | SY11 1PA |
| Vyrnwy Road | SY11 1NP SY11 1NS SY11 1NT SY11 1NZ |
| Welsh Walls | SY11 1AW |
| Willow Street | SY11 1AJ SY11 1AL |
| Windridge Court | SY11 1HQ |
| York Fields | SY11 1PD |
| York Street | SY11 1LS SY11 1LX SY11 1NA |
| SY11 1DA SY11 1DE SY11 1DF SY11 1DG SY11 1SD |
Transport near Oswestry West
- FAQ
- Price Paid By Year
- Property Type Price
Frequently asked questions about Oswestry West
What is the average price for a property for sale in Oswestry West?
The average price for a property for sale in Oswestry West is £216,757. This amount is 19% lower than the average price in Oswestry. There are 412 property listings for sale in Oswestry West.
What streets have the most expensive properties for sale in Oswestry West?
The streets with the most expensive properties for sale in Oswestry West are Park Drive at an average of £500,000, Mount Drive at an average of £471,333 and Oakhurst Road at an average of £398,750.
What streets have the most affordable properties for sale in Oswestry West?
The streets with the most affordable properties for sale in Oswestry West are Swan Lane at an average of £105,000, Hurdsman Street at an average of £107,000 and Albert Mews at an average of £127,000.
Which train stations are available in or near Oswestry West?
Some of the train stations available in or near Oswestry West are Gobowen, Chirk and Ruabon.
Property Price Paid in Oswestry West by Year
The average sold property price by year was:
| Year | Average Sold Price | Price Change |
Sold Properties
|
|---|---|---|---|
| 2025 | £202,111 | -17% |
51 Properties |
| 2024 | £235,783 | 12% |
67 Properties |
| 2023 | £207,811 | 2% |
59 Properties |
| 2022 | £202,635 | 5% |
60 Properties |
| 2021 | £191,676 | 15% |
77 Properties |
| 2020 | £163,849 | -6% |
42 Properties |
| 2019 | £173,044 | 15% |
46 Properties |
| 2018 | £147,842 | -14% |
59 Properties |
| 2017 | £168,654 | 5% |
67 Properties |
| 2016 | £161,064 | 2% |
61 Properties |
| 2015 | £157,439 | -7% |
75 Properties |
| 2014 | £169,231 | 12% |
55 Properties |
| 2013 | £148,502 | -9% |
42 Properties |
| 2012 | £161,385 | -1% |
53 Properties |
| 2011 | £162,321 | 9% |
41 Properties |
| 2010 | £148,390 | 5% |
42 Properties |
| 2009 | £140,463 | 4% |
48 Properties |
| 2008 | £135,292 | -18% |
61 Properties |
| 2007 | £159,879 | 12% |
88 Properties |
| 2006 | £140,292 | 12% |
104 Properties |
| 2005 | £123,128 | 10% |
71 Properties |
| 2004 | £110,921 | 13% |
78 Properties |
| 2003 | £96,203 | 9% |
109 Properties |
| 2002 | £87,777 | 22% |
144 Properties |
| 2001 | £68,134 | 25% |
117 Properties |
| 2000 | £51,130 | 1% |
89 Properties |
| 1999 | £50,838 | 3% |
82 Properties |
| 1998 | £49,080 | 13% |
70 Properties |
| 1997 | £42,593 | -9% |
79 Properties |
| 1996 | £46,455 | 4% |
97 Properties |
| 1995 | £44,725 | - |
80 Properties |
Property Price per Property Type in Oswestry West
Here you can find historic sold price data in order to help with your property search.
The average Property Paid Price for specific property types in the last three years are:
| Property Type | Average Sold Price | Sold Properties |
|---|---|---|
| Semi Detached House | £198,434.00 | 38 Semi Detached Houses |
| Detached House | £356,055.00 | 45 Detached Houses |
| Terraced House | £159,534.00 | 86 Terraced Houses |
| Flat | £135,393.00 | 8 Flats |

