
Houses for sale in Bowbrook, Shrewsbury
House Prices in Bowbrook
Properties in Bowbrook have an average house price of £258k and had 333 Property Transactions within the last 3 years¹.
Bowbrook is an area in Shrewsbury, Shropshire with 2,088 households², where the most expensive property was sold for £745k.
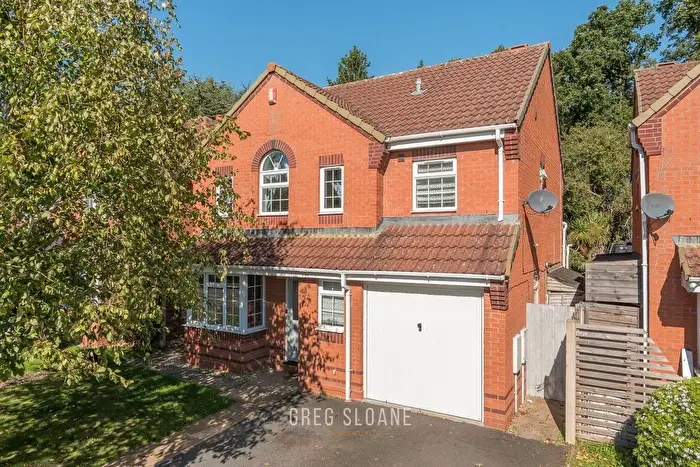
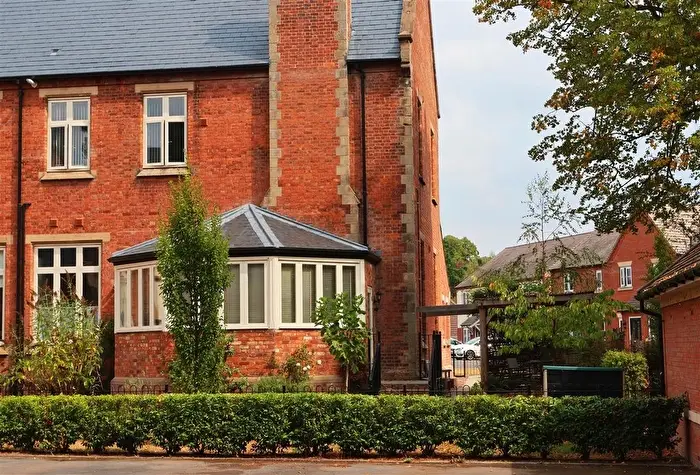
Properties for sale in Bowbrook

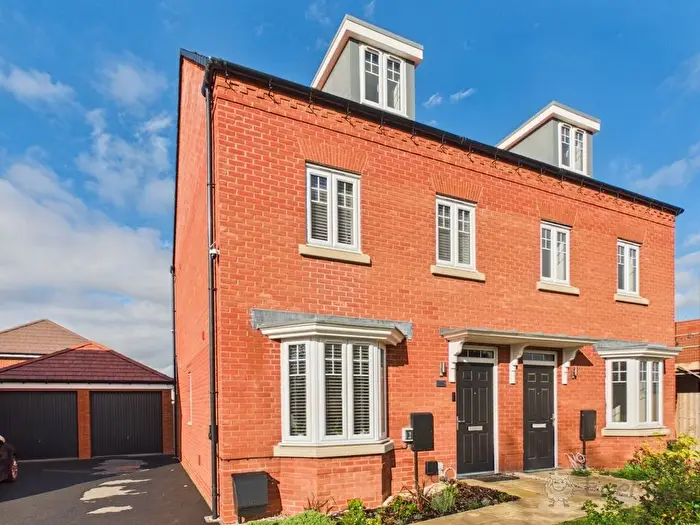

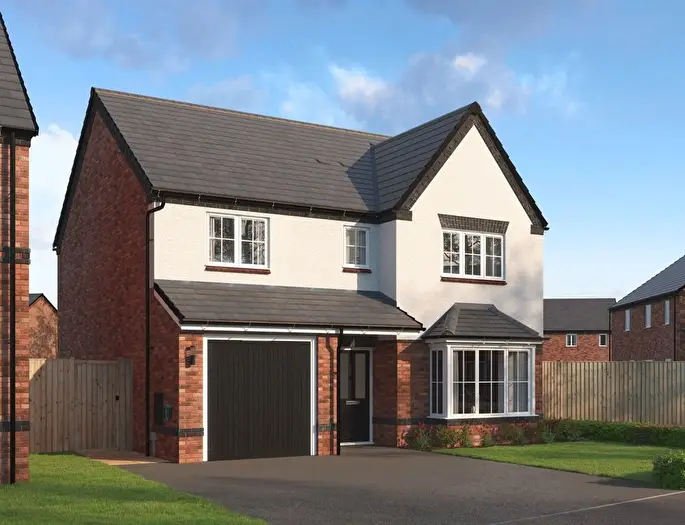
 3 Bedrooms
 2 Bathrooms


If you are looking to sell your house, let it out, or receive a property valuation, an expert can help you.
Click the button below to get started.






Roads and Postcodes in Bowbrook
Navigate through our locations to find the location of your next house in Bowbrook, Shrewsbury for sale or to rent.
| Streets | Postcodes |
|---|---|
| Badgers Way | SY3 5AB |
| Barn Owl Way | SY3 5FA |
| Barn Pool Crescent | SY3 8DJ SY3 8DQ |
| Blakeway Mews | SY3 5AR |
| Bligny Crescent | SY3 5FE |
| Bowbrook Grange | SY3 8XT |
| Bradman Drive | SY3 5FZ |
| Briery Lane | SY3 5DN |
| Bromley Road | SY3 5AZ |
| Carlton Close | SY3 5JA |
| Cartwright Close | SY3 5FY |
| Cavendish Close | SY3 5PG |
| Chadderton Close | SY3 5HR |
| Chapel Hill | SY3 5AT |
| Chapel Lane | SY3 5BX |
| Clayton Way | SY3 5AL |
| Coach Road | SY3 5AU |
| Collingwood Drive | SY3 5HP |
| Coney Green | SY3 5AP |
| Copthorne Road | SY3 8DR |
| Corner Farm Drive | SY3 5DY |
| Corner Lane | SY3 5BZ |
| Cotes Crescent | SY3 5AS |
| Cresswell Court | SY3 8SN |
| Deane Close | SY3 5AF |
| Earls Hill View | SY3 5HA |
| Earlswood | SY3 5JB |
| Edgecombe Way | SY3 8DG |
| Edgefield Green | SY3 5HB SY3 5HD |
| Edinburgh Drive | SY3 8DH SY3 8DP |
| Farfield Close | SY3 5LD |
| Felcourt Drive | SY3 5LB |
| Fenton Close | SY3 5AE |
| Fernlea Croft | SY3 5DS |
| Findon Way | SY3 5NA |
| Florence Close | SY3 5PD |
| Foxley Grove | SY3 5DF |
| Frinton Close | SY3 5NB |
| Gains Avenue | SY3 5AN SY3 5BA SY3 5DQ SY3 5EJ SY3 5EL |
| Grantley Avenue | SY3 5LA |
| Greystone Court | SY3 5EW |
| Harpers Meadow | SY3 5HS |
| Hebden Grove | SY3 8TU |
| High Oaks | SY3 5AX |
| Holsworth Park | SY3 5HJ |
| Hurstead Court | SY3 8DD |
| Kelsall Drive | SY3 5HE |
| Kirkland Avenue | SY3 5LF |
| Knowsley Drive | SY3 5DH |
| Lambourn Drive | SY3 5ND SY3 5NE SY3 5NF |
| Leeswood Court | SY3 5HQ |
| Leighton Park | SY3 5FS SY3 5FT |
| Longacre Mews | SY3 5DT |
| Longhirst Gardens | SY3 5PF |
| Mayland Court | SY3 8DB |
| Melbourne Rise | SY3 5DA |
| Mitcham Court | SY3 5LG |
| Montrose Place | SY3 5EN |
| Morris Grove | SY3 5FP |
| Mytton Oak Road | SY3 8XQ SY5 8PH |
| Oak Lane | SY3 5BN SY3 5BT SY3 5BW |
| Oaklands | SY3 5BG |
| Oliver Road | SY3 5FX |
| Orsons Meadow | SY3 5DL |
| Painswick Close | SY3 5HH |
| Paxton Place | SY3 8TT |
| Pensfold | SY3 5HF |
| Pensfold Court | SY3 5FF |
| Pump Lane | SY3 5BL |
| Racecourse Lane | SY3 5LZ SY3 5BJ |
| Robinsford Close | SY3 5HN |
| Rothley Drive | SY3 5BB |
| Samuel Court | SY3 5DD |
| Sandown Crescent | SY3 8SL |
| Sapcote Lane | SY3 5DE |
| Saxon Court | SY3 5JD |
| Shackleton Way | SY3 8SW |
| Shelton Corner | SY3 8DL |
| Shelton Gardens | SY3 5AG SY3 5BF |
| Shepherds Lane | SY3 5EH SY3 5EQ SY3 5FR |
| Silverdale | SY3 5EY |
| Silverstone Close | SY3 5JE |
| Sion Drive | SY3 5DG |
| Somerby Drive | SY3 8DS |
| Squires Court | SY3 5DP |
| Squirrel Walk | SY3 5DU |
| Sycamore Cottages | SY3 5AJ |
| The Bridleway | SY3 5NP |
| The Dell | SY3 5HG |
| The Furlongs | SY3 5FU SY3 5FW SY3 5GA |
| The Keep | SY3 5DW |
| The Knolls | SY3 5DR |
| The Lees | SY3 5BD |
| The Orchard | SY3 5AW |
| The Paddocks | SY3 5EP SY3 5ER |
| The Ridings | SY3 5ES SY3 5ET |
| The Woolams | SY3 5BE |
| The Yeld | SY3 5DX |
| Thorns Grove | SY3 5BY |
| Tythe Cottages | SY3 5BH |
| Vaughans Cottages | SY3 5BQ |
| Waverton Way | SY3 5LE |
| Wellwood Close | SY3 5BP |
| Welshpool Road | SY3 5AD SY3 8BB SY3 5AA SY3 5AH SY3 5AQ SY3 5BU |
| West Edge | SY3 5EZ |
| White Bank | SY3 5AY |
| Whitecote Drive | SY3 5DB |
| Woodcrest | SY3 5EU SY3 5EX |
| Worrow Drive | SY3 5DJ |
| SY3 8BJ SY5 8QP SY3 5BS SY5 8PG |
Property price trends in Bowbrook
According to the latest Land Registry data, the average home in Bowbrook sold for £268,622 in 2026. That figure comes from 3,600 sales logged over the past 31 years.
Prices have moved up over the last three years. Compared with 2023, when the typical sale came in around £255,197, that's a rise of roughly 5.3%.
Looking back five years, average prices are up about 23.8% since 2021, a gain of around £51,566 in cash terms.
Zoom out to the past decade for the fuller picture. Back in 2016, homes here averaged £207,156, so the typical sold price has climbed about 29.7% since then, roughly 2.6% a year. Stretch the view to fifteen years and that annual pace edges up closer to 4.2%.
Frequently asked questions about Bowbrook
What is the average price for a property for sale in Bowbrook?
The average price for a property for sale in Bowbrook is £257,900. This amount is 17% lower than the average price in Shrewsbury. There are 217 property listings for sale in Bowbrook.
What streets have the most expensive properties for sale in Bowbrook?
The streets with the most expensive properties for sale in Bowbrook are Welshpool Road at an average of £560,000, Bradman Drive at an average of £517,500 and Cavendish Close at an average of £506,250.
What streets have the most affordable properties for sale in Bowbrook?
The streets with the most affordable properties for sale in Bowbrook are Briery Lane at an average of £93,498, Montrose Place at an average of £110,000 and Lambourn Drive at an average of £115,416.
Which train stations are available in or near Bowbrook?
Some of the train stations available in or near Bowbrook are Shrewsbury, Yorton and Wem.
Property Price Paid in Bowbrook by Year
The average sold property price by year was:
| Year | Average Sold Price | Price Change |
Sold Properties

|
|---|---|---|---|
| 2026 | £268,622 | 
-2% |
42 Properties |
| 2025 | £273,062 | 
10% |
76 Properties |
| 2024 | £246,392 |
-4% |
116 Properties |
| 2023 | £255,197 |
6% |
99 Properties |
| 2022 | £240,555 |
10% |
83 Properties |
| 2021 | £217,056 |
5% |
114 Properties |
| 2020 | £205,535 |
9% |
84 Properties |
| 2019 | £186,278 |
-16% |
123 Properties |
| 2018 | £216,866 |
9% |
166 Properties |
| 2017 | £197,792 |
-5% |
129 Properties |
Property Price per Property Type in Bowbrook
Here you can find historic sold price data in order to help with your property search.
The average Property Paid Price for specific property types in the last three years are:
| Property Type | Average Sold Price | Sold Properties |
|---|---|---|
| Detached House | £384,753.00 | 105 Detached Houses |
| Flat | £165,391.00 | 37 Flats |
| Semi Detached House | £246,596.00 | 100 Semi Detached Houses |
| Terraced House | £161,567.00 | 91 Terraced Houses |
