
Houses for sale & to rent in Quarry And Coton Hill, Shrewsbury
House Prices in Quarry And Coton Hill
Properties in Quarry And Coton Hill have an average house price of £268k and had 260 Property Transactions within the last 3 years¹.
Quarry And Coton Hill is an area in Shrewsbury, Shropshire with 2,070 households², where the most expensive property was sold for £2.25M.
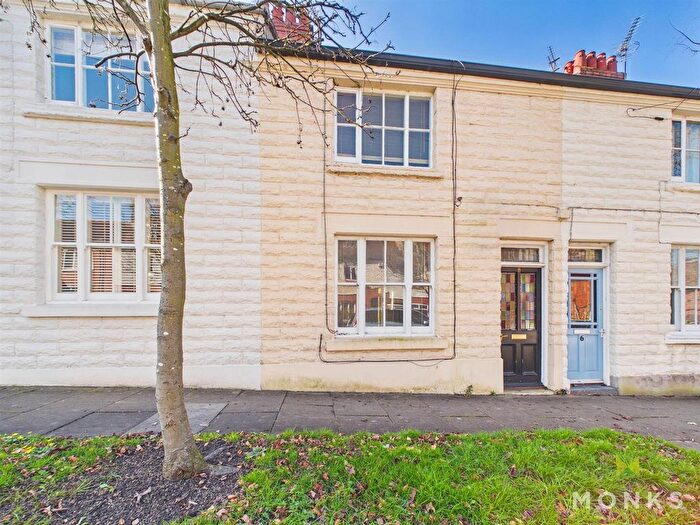
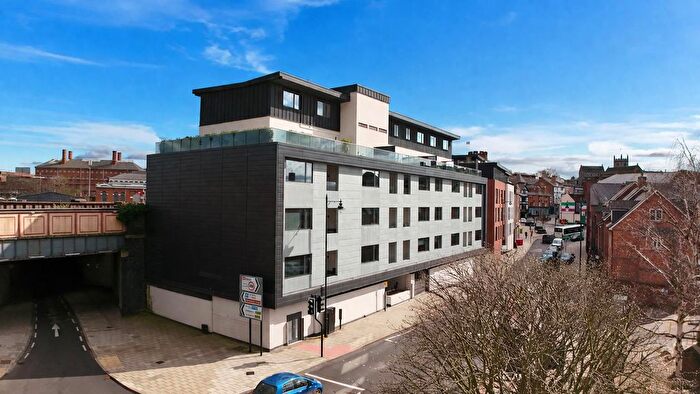
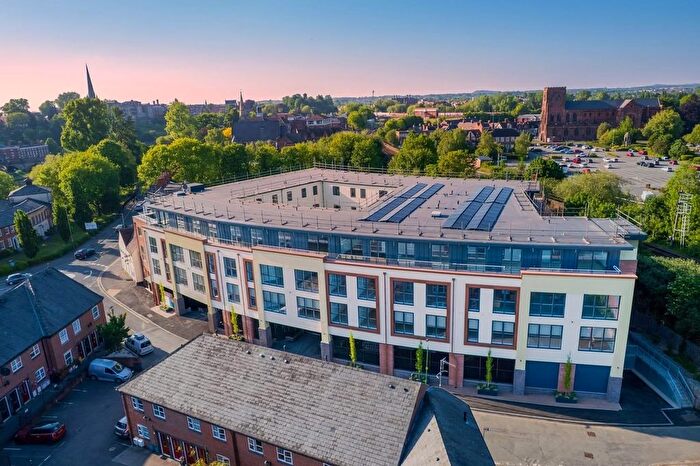
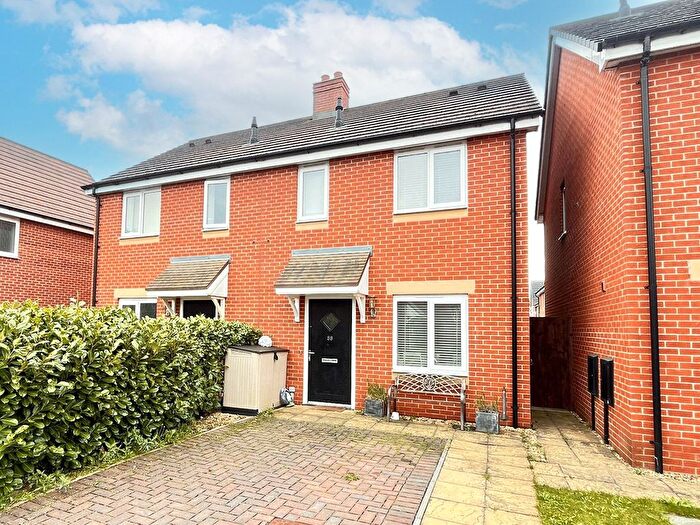
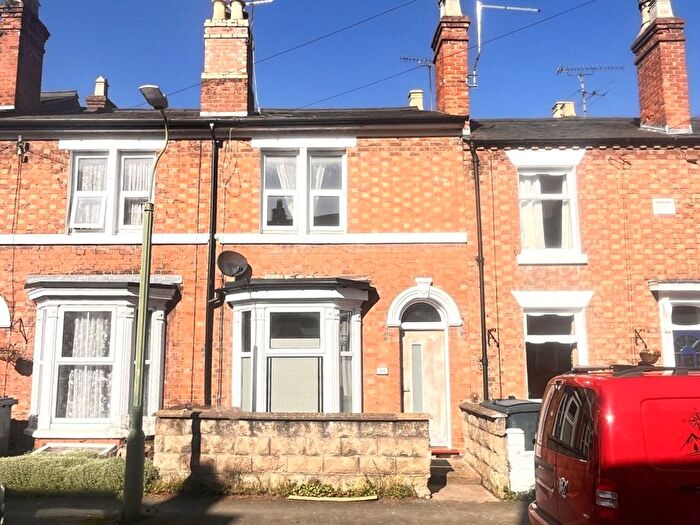
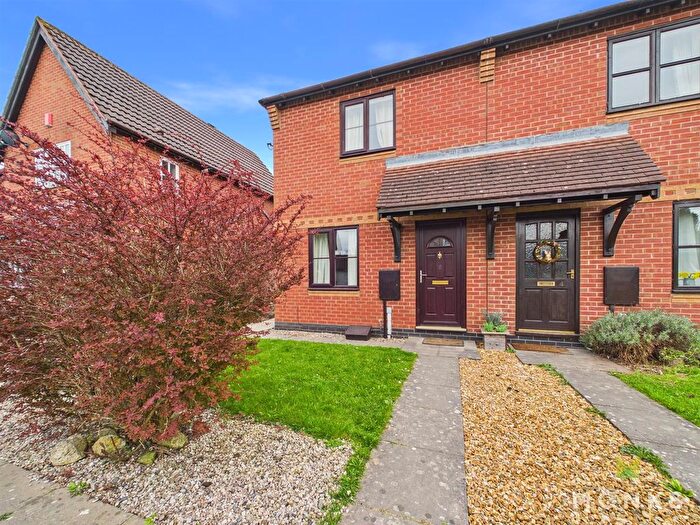
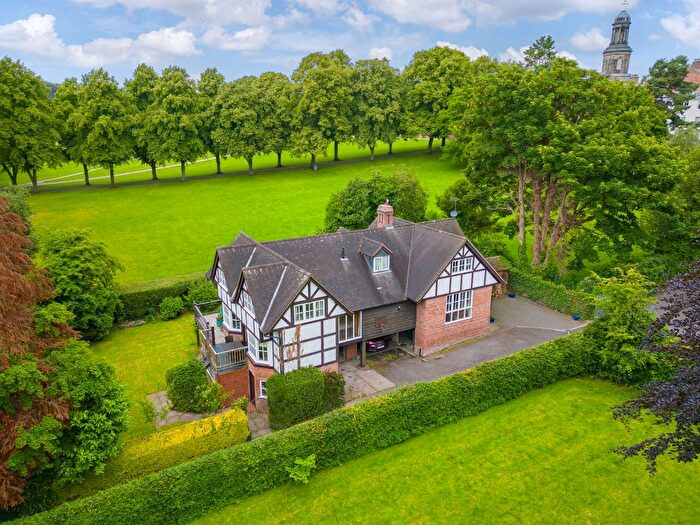
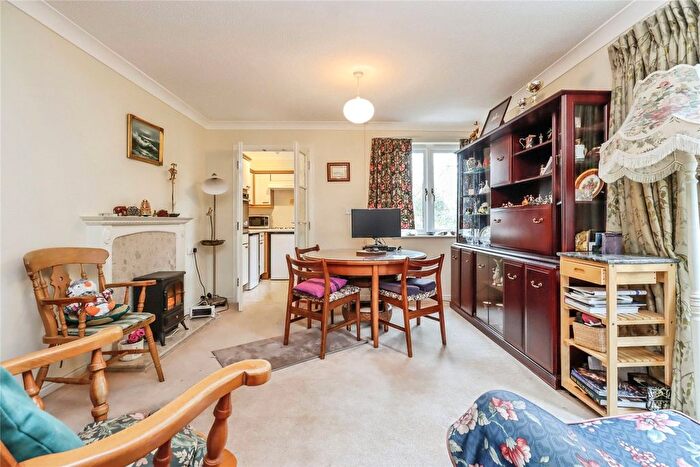
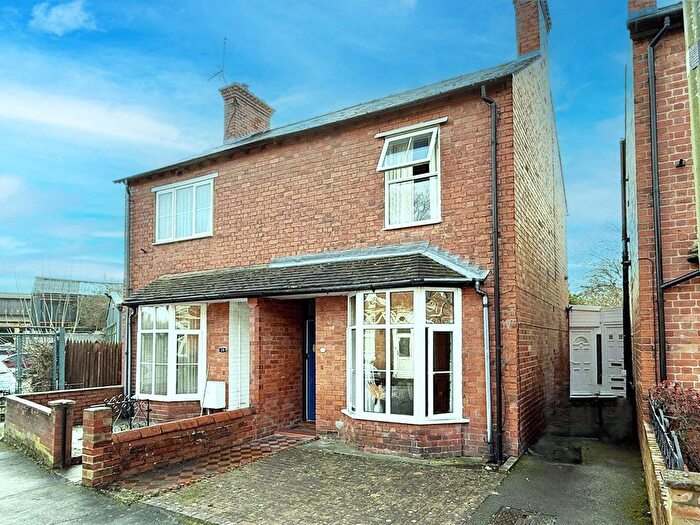
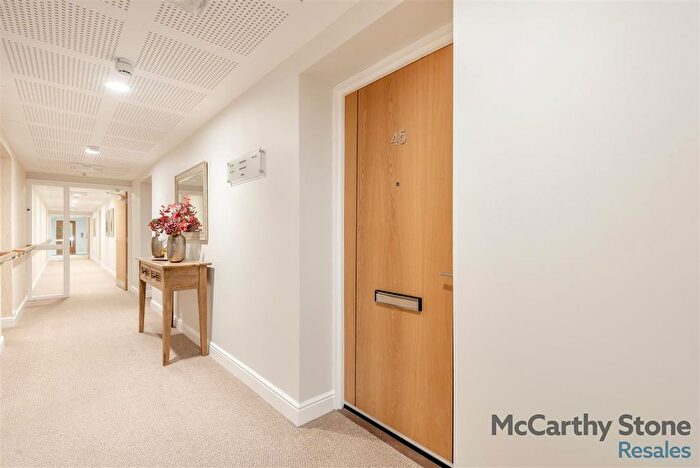
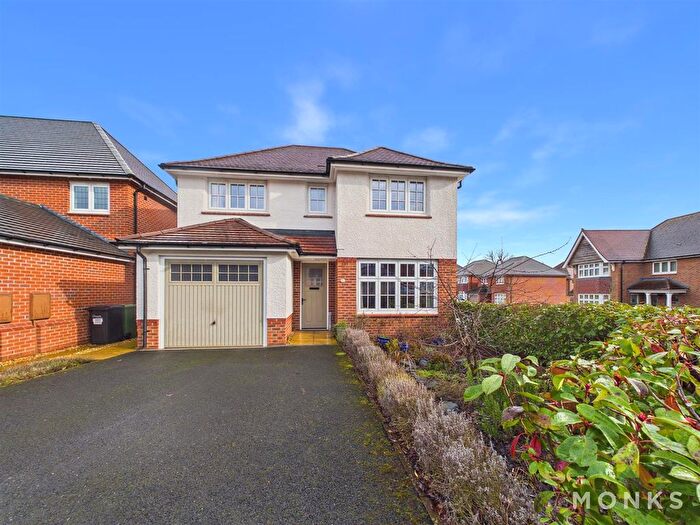
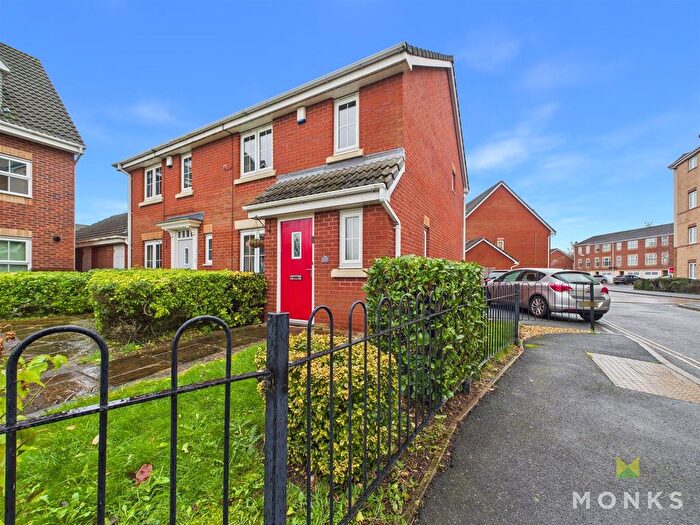
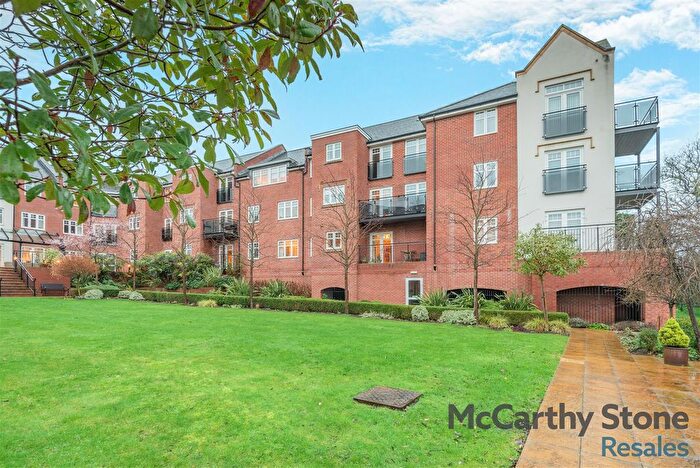
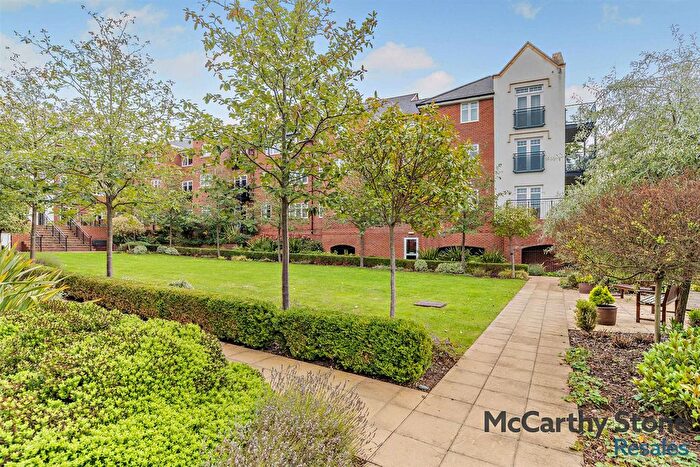
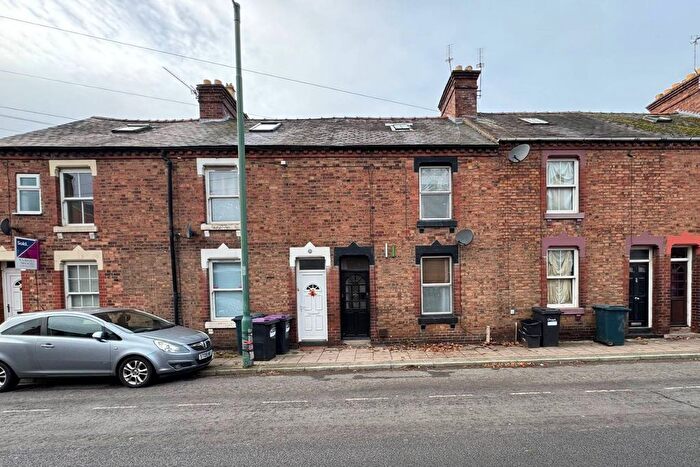
Properties for sale in Quarry And Coton Hill
![]()
If you are looking to sell your house, let it out, or receive a property valuation, an expert can help you.
Click the button below to get started.
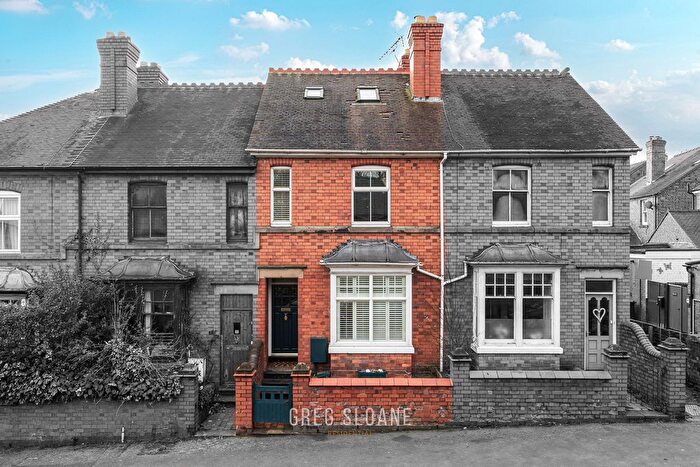
Previously listed properties in Quarry And Coton Hill
Roads and Postcodes in Quarry And Coton Hill
Navigate through our locations to find the location of your next house in Quarry And Coton Hill, Shrewsbury for sale or to rent.
Transport near Quarry And Coton Hill

- FAQ
- Price Paid By Year
- Property Type Price
Frequently asked questions about Quarry And Coton Hill
What is the average price for a property for sale in Quarry And Coton Hill?
The average price for a property for sale in Quarry And Coton Hill is £268,390. This amount is 13% lower than the average price in Shrewsbury. There are 197 property listings for sale in Quarry And Coton Hill.
What streets have the most expensive properties for sale in Quarry And Coton Hill?
The streets with the most expensive properties for sale in Quarry And Coton Hill are Castle Gates at an average of £2,250,000, Belmont at an average of £852,500 and Claremont Hill at an average of £732,500.
What streets have the most affordable properties for sale in Quarry And Coton Hill?
The streets with the most affordable properties for sale in Quarry And Coton Hill are Castle Foregate at an average of £123,611, English Bridge Court at an average of £128,000 and Westminster Close at an average of £128,750.
Which train stations are available in or near Quarry And Coton Hill?
Some of the train stations available in or near Quarry And Coton Hill are Shrewsbury, Yorton and Wellington.
Property Price Paid in Quarry And Coton Hill by Year
The average sold property price by year was:
| Year | Average Sold Price | Price Change |
Sold Properties
|
|---|---|---|---|
| 2026 | £220,000 | -34% |
1 Property |
| 2025 | £295,484 | 18% |
75 Properties |
| 2024 | £241,631 | -14% |
95 Properties |
| 2023 | £274,664 | 6% |
89 Properties |
| 2022 | £257,287 | -10% |
112 Properties |
| 2021 | £284,032 | 9% |
143 Properties |
| 2020 | £257,117 | 17% |
85 Properties |
| 2019 | £213,008 | -16% |
96 Properties |
| 2018 | £246,643 | 0,1% |
108 Properties |
| 2017 | £246,302 | 5% |
95 Properties |
| 2016 | £234,456 | 5% |
126 Properties |
| 2015 | £222,117 | 11% |
132 Properties |
| 2014 | £198,303 | 8% |
96 Properties |
| 2013 | £181,587 | -13% |
92 Properties |
| 2012 | £205,739 | 14% |
88 Properties |
| 2011 | £176,698 | 1% |
73 Properties |
| 2010 | £175,487 | 1% |
60 Properties |
| 2009 | £174,455 | -19% |
75 Properties |
| 2008 | £206,950 | 9% |
84 Properties |
| 2007 | £187,554 | 7% |
145 Properties |
| 2006 | £174,366 | -12% |
270 Properties |
| 2005 | £194,425 | 9% |
138 Properties |
| 2004 | £177,496 | 26% |
163 Properties |
| 2003 | £131,307 | 11% |
156 Properties |
| 2002 | £117,247 | 8% |
176 Properties |
| 2001 | £108,439 | 19% |
187 Properties |
| 2000 | £87,873 | 17% |
148 Properties |
| 1999 | £72,533 | 2% |
118 Properties |
| 1998 | £70,754 | 5% |
90 Properties |
| 1997 | £67,054 | 17% |
54 Properties |
| 1996 | £55,825 | -18% |
52 Properties |
| 1995 | £65,844 | - |
88 Properties |
Property Price per Property Type in Quarry And Coton Hill
Here you can find historic sold price data in order to help with your property search.
The average Property Paid Price for specific property types in the last three years are:
| Property Type | Average Sold Price | Sold Properties |
|---|---|---|
| Semi Detached House | £308,795.00 | 22 Semi Detached Houses |
| Detached House | £673,333.00 | 9 Detached Houses |
| Terraced House | £282,503.00 | 105 Terraced Houses |
| Flat | £219,878.00 | 124 Flats |