Houses for sale & to rent in Bagley, Shrewsbury
House Prices in Bagley
Properties in Bagley have an average house price of £241,506.00 and had 224 Property Transactions within the last 3 years¹.
Bagley is an area in Shrewsbury, Shropshire with 1,933 households², where the most expensive property was sold for £695,000.00.
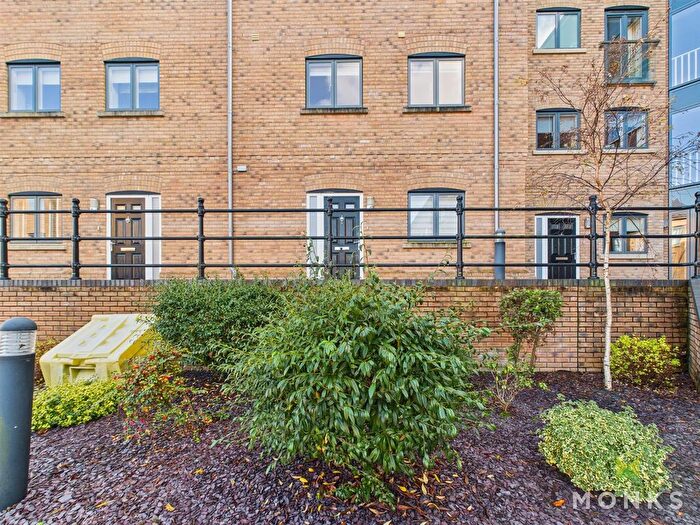
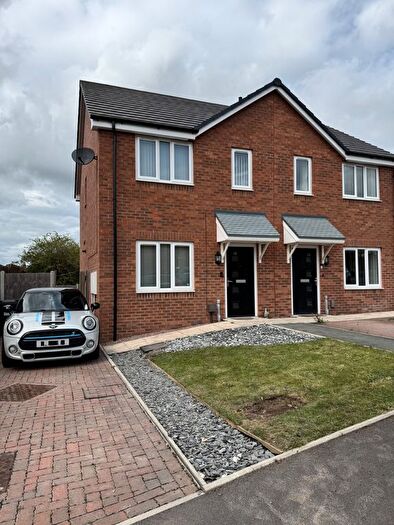
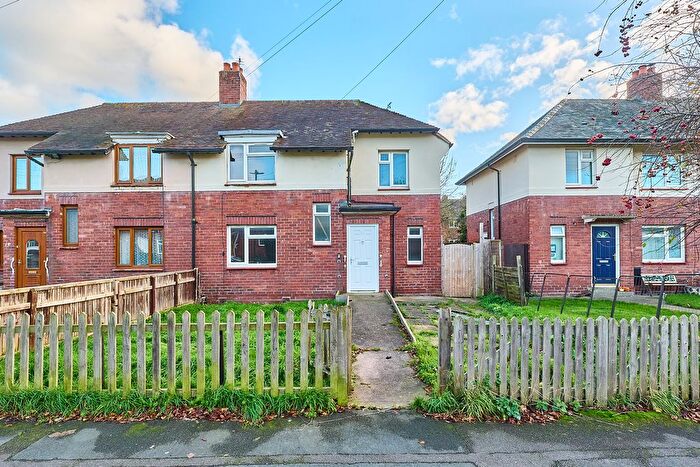
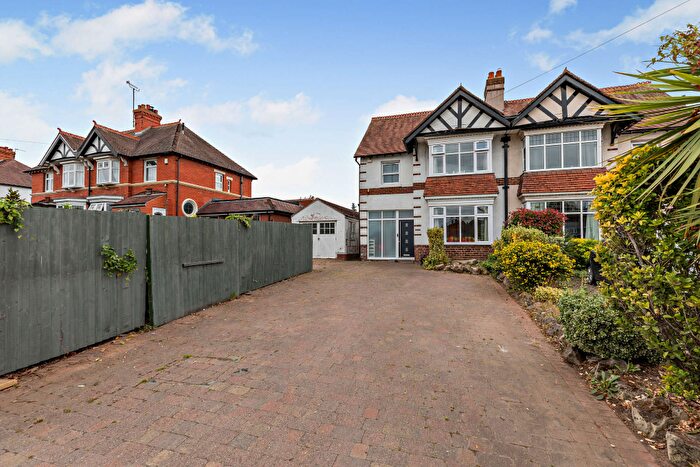
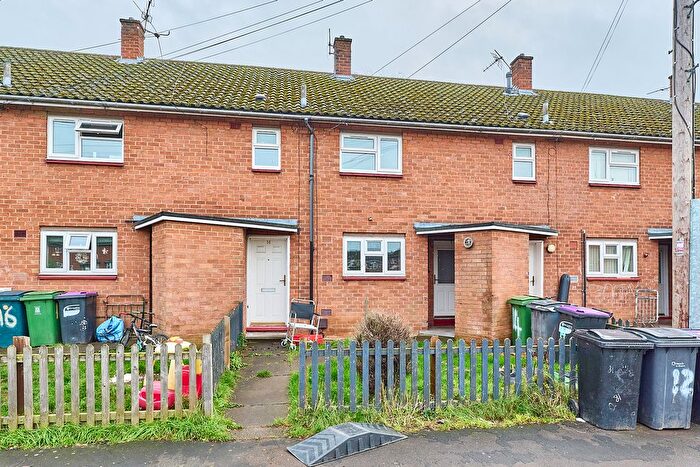
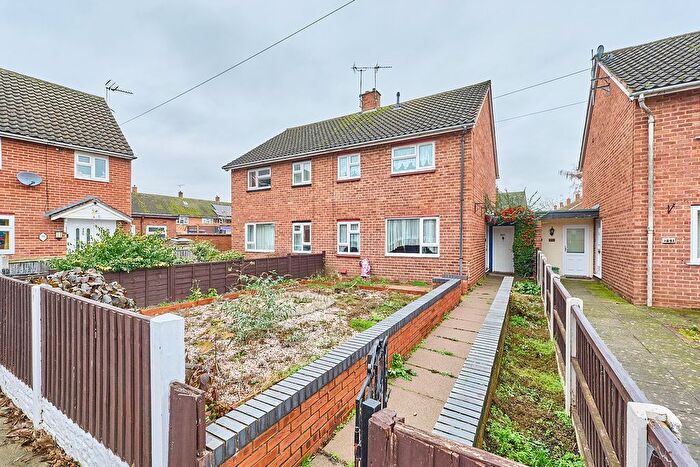
Properties for sale in Bagley
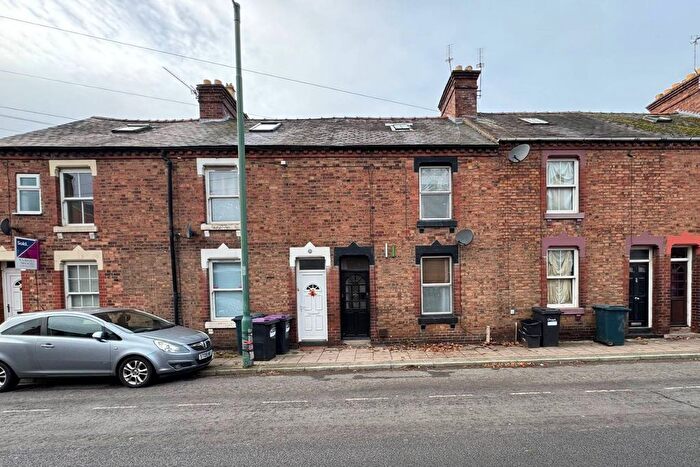
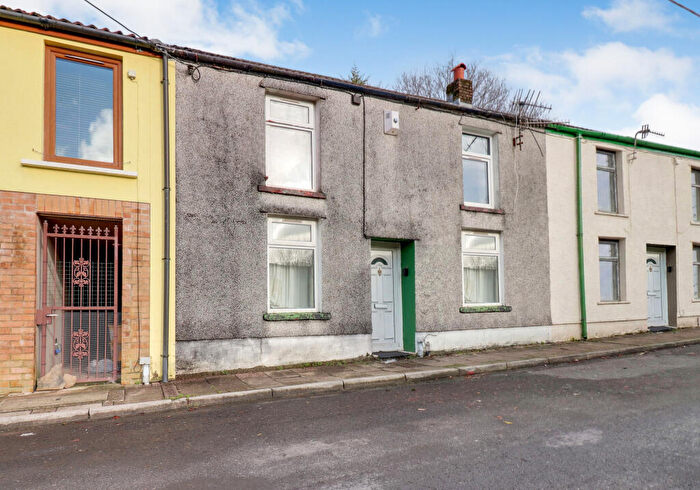
Previously listed properties in Bagley
Roads and Postcodes in Bagley
Navigate through our locations to find the location of your next house in Bagley, Shrewsbury for sale or to rent.
| Streets | Postcodes |
|---|---|
| Ashfields Road | SY1 3EE SY1 3EF SY1 3SB SY1 3SD |
| Ashford Drive | SY1 3HH |
| Barkstone Drive | SY1 3XT |
| Bayford Drive | SY1 3XQ |
| Beechwood Court | SY1 2RF |
| Berinsfield Close | SY1 3XZ |
| Berrington Drive | SY1 3HB |
| Boscobel Drive | SY1 3DN SY1 3DR SY1 3DS SY1 3DU SY1 3DW SY1 3HR SY1 3TT |
| Broadhaven Close | SY1 3XF |
| Butterwick Drive | SY1 3XE |
| Camross Drive | SY1 3XH |
| Cardington Drive | SY1 3HD |
| Carling Close | SY1 3RT |
| Castle Business Park | SY1 2EG |
| Cedars Drive | SY1 2RB SY1 2RD |
| Chalgrove | SY1 3YU |
| Chelwood Drive | SY1 3YZ |
| Coldridge Drive | SY1 3YT |
| Cressage Avenue | SY1 3DT |
| Crewe Bank Yard | SY1 2EB |
| Cross Hill | SY4 3AB |
| Cross Hill Cottages | SY1 3PB |
| Cunningham Way | SY1 3SR |
| Darfield | SY1 3XS |
| Ellesmere Drive | SY1 2QU |
| Ellesmere Road | SY1 2PJ SY1 2PR SY1 2PT SY1 2QP SY1 2QR SY1 2QS SY1 2QZ SY1 2RA SY1 2RE SY1 2QT SY1 2QX SY1 2QY SY1 2RJ SY1 2RQ SY1 3PA |
| Elm Street | SY1 2PU |
| Emscote | SY1 3YS |
| Falstaff Street | SY1 2QN |
| Farmlodge Lane | SY1 3ST |
| Gladstone Terrace | SY1 2QJ |
| Glendower Court | SY1 2RG |
| Greenfield Street | SY1 2PX SY1 2PY SY1 2QD SY1 2QE SY1 2QL |
| Greenfields Gardens | SY1 2RN SY1 2RP |
| Heathfield Close | SY1 3SN |
| Hemsworth Way | SY1 2AH |
| Hencote Lane | SY4 3AA |
| Hordley Avenue | SY1 3HJ |
| Hotspur Street | SY1 2PZ SY1 2QA SY1 2QB |
| Huffley Lane | SY4 3AE |
| Johnson Villas | SY1 2QW |
| Juniper Road | SY1 2BL SY1 2BN |
| Katesway | SY1 3YY |
| Kenley Avenue | SY1 3HA SY1 3HE |
| Kirkwood Court | SY1 3SX |
| L M S New Yard | SY1 2EN |
| Langtree Drive | SY1 3SA |
| Lapwood Drive | SY1 3XG |
| Leabank Close | SY1 3XU |
| Leighton Road | SY1 3EZ |
| Lockwood Drive | SY1 3SG |
| Longville Road | SY1 3HN |
| Ludford Drive | SY1 3DP |
| Lydham Road | SY1 3HL SY1 3HQ |
| Lymehurst Court | SY1 2PH |
| Maple Drive | SY1 3SE |
| Mount Pleasant Road | SY1 3EW SY1 3EY SY1 3HZ SY1 3JA SY1 3EL SY1 3EN SY1 3HX |
| Northumberland Place | SY1 2RL |
| Oakdale Drive | SY1 3ED |
| Oakhurst Drive | SY1 3DZ |
| Oakwood Drive | SY1 3DY SY1 3EA SY1 3EB |
| Penson Way | SY1 2AN SY1 2BF |
| Percy Street | SY1 2QF SY1 2QG SY1 2QQ |
| Percy Street North | SY1 2QH |
| Pinewood Close | SY1 3SF |
| Pitchford Road | SY1 3HS |
| Redfield | SY1 3XP |
| Reedham Road | SY1 3XW |
| Rowan Close | SY1 2BT |
| Salendine | SY1 3XJ |
| Sambrook Close | SY1 3XY |
| Tanfield | SY1 3XR |
| Tawnylea | SY1 3XL |
| Thornton Road | SY1 3SJ |
| Walnut Drive | SY1 3SQ |
| Watchcote | SY1 3YX |
| Westbury Road | SY1 3HF SY1 3HG SY1 3HP SY1 3HT SY1 3HU SY1 3HW |
| Westmoreland Mews | SY1 2RH |
| White Meadow Close | SY1 3SU |
| Willowdale Gardens | SY1 3SS |
| Winney Hill View | SY1 3SH |
| Wood Street | SY1 2PN |
| Wood Street Gardens | SY1 2PL |
| SY4 3AF SY4 3JB |
Transport near Bagley
- FAQ
- Price Paid By Year
- Property Type Price
Frequently asked questions about Bagley
What is the average price for a property for sale in Bagley?
The average price for a property for sale in Bagley is £241,506. This amount is 22% lower than the average price in Shrewsbury. There are 450 property listings for sale in Bagley.
What streets have the most expensive properties for sale in Bagley?
The streets with the most expensive properties for sale in Bagley are Juniper Road at an average of £420,250, Kirkwood Court at an average of £349,333 and Reedham Road at an average of £340,500.
What streets have the most affordable properties for sale in Bagley?
The streets with the most affordable properties for sale in Bagley are Barkstone Drive at an average of £139,285, Cross Hill Cottages at an average of £163,250 and Wood Street at an average of £163,640.
Which train stations are available in or near Bagley?
Some of the train stations available in or near Bagley are Shrewsbury, Yorton and Wem.
Property Price Paid in Bagley by Year
The average sold property price by year was:
| Year | Average Sold Price | Price Change |
Sold Properties
|
|---|---|---|---|
| 2025 | £252,861 | 2% |
67 Properties |
| 2024 | £247,541 | 9% |
78 Properties |
| 2023 | £225,917 | -11% |
79 Properties |
| 2022 | £250,081 | 12% |
89 Properties |
| 2021 | £221,105 | 5% |
109 Properties |
| 2020 | £209,645 | -18% |
65 Properties |
| 2019 | £247,238 | 7% |
83 Properties |
| 2018 | £229,662 | 6% |
130 Properties |
| 2017 | £216,459 | 20% |
159 Properties |
| 2016 | £172,545 | 6% |
116 Properties |
| 2015 | £162,888 | -4% |
92 Properties |
| 2014 | £169,529 | 9% |
106 Properties |
| 2013 | £154,728 | -7% |
80 Properties |
| 2012 | £165,581 | 7% |
70 Properties |
| 2011 | £154,639 | 1% |
50 Properties |
| 2010 | £153,149 | 5% |
89 Properties |
| 2009 | £146,217 | -3% |
100 Properties |
| 2008 | £151,188 | -10% |
55 Properties |
| 2007 | £166,039 | 6% |
96 Properties |
| 2006 | £155,628 | 7% |
136 Properties |
| 2005 | £144,968 | 4% |
111 Properties |
| 2004 | £139,653 | 12% |
130 Properties |
| 2003 | £122,779 | 23% |
130 Properties |
| 2002 | £95,021 | 17% |
151 Properties |
| 2001 | £79,241 | 13% |
159 Properties |
| 2000 | £68,698 | 9% |
133 Properties |
| 1999 | £62,843 | 12% |
181 Properties |
| 1998 | £55,327 | -6% |
114 Properties |
| 1997 | £58,724 | 2% |
161 Properties |
| 1996 | £57,771 | -4% |
207 Properties |
| 1995 | £59,865 | - |
134 Properties |
Property Price per Property Type in Bagley
Here you can find historic sold price data in order to help with your property search.
The average Property Paid Price for specific property types in the last three years are:
| Property Type | Average Sold Price | Sold Properties |
|---|---|---|
| Semi Detached House | £251,536.00 | 95 Semi Detached Houses |
| Detached House | £346,128.00 | 39 Detached Houses |
| Terraced House | £202,153.00 | 68 Terraced Houses |
| Flat | £134,363.00 | 22 Flats |

