
Houses for sale & to rent in SY5 8NP, Nobold Lane, Radbrook, Shrewsbury
House Prices in SY5 8NP, Nobold Lane, Radbrook
Properties in SY5 8NP have no sales history available within the last 3 years. SY5 8NP is a postcode in Nobold Lane located in Radbrook, an area in Shrewsbury, Shropshire, with 2 households².
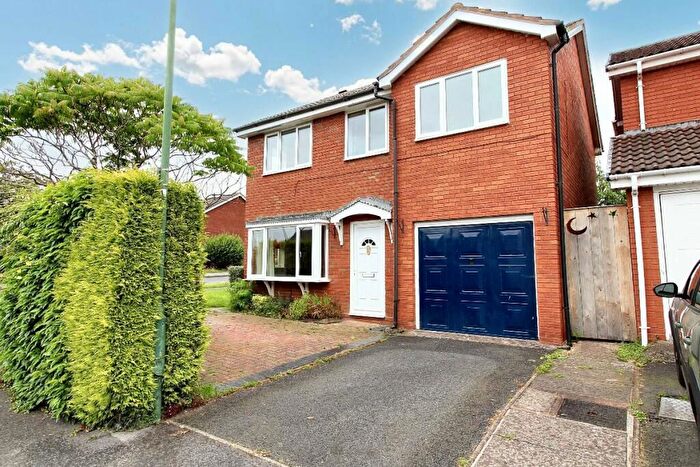
Previously listed properties near SY5 8NP, Nobold Lane

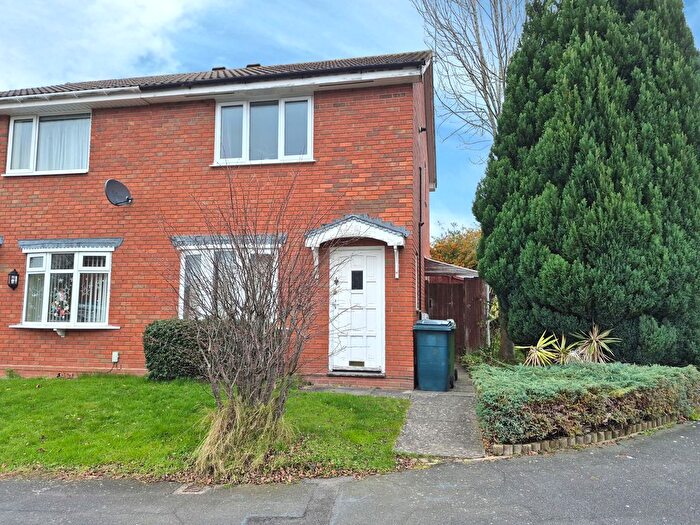

![]()
If you are looking to sell your house, let it out, or receive a property valuation, an expert can help you.
Click the button below to get started.


Price Paid in Nobold Lane, SY5 8NP, Radbrook
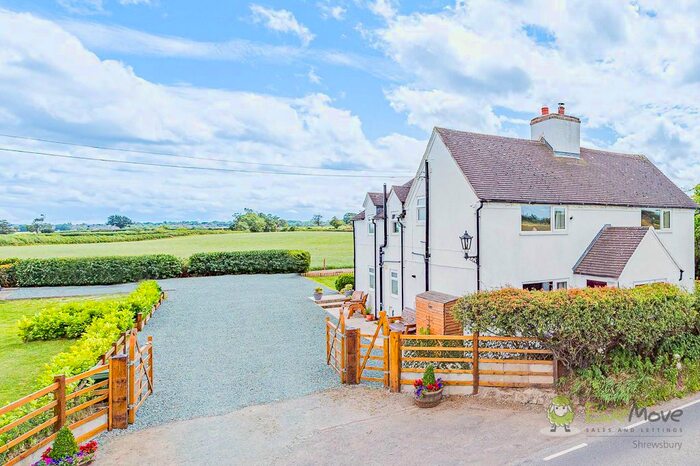
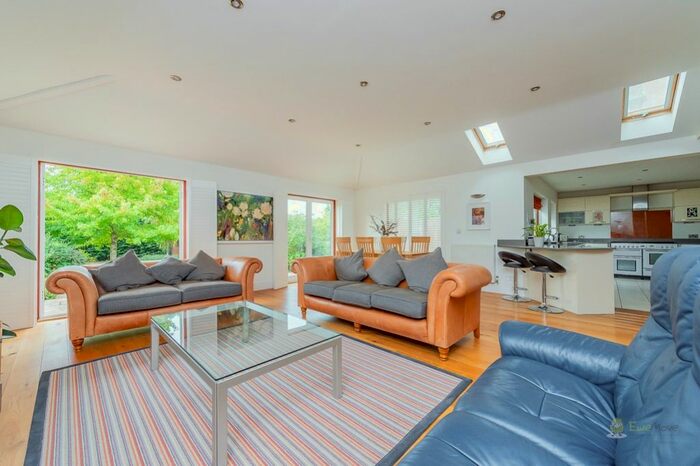
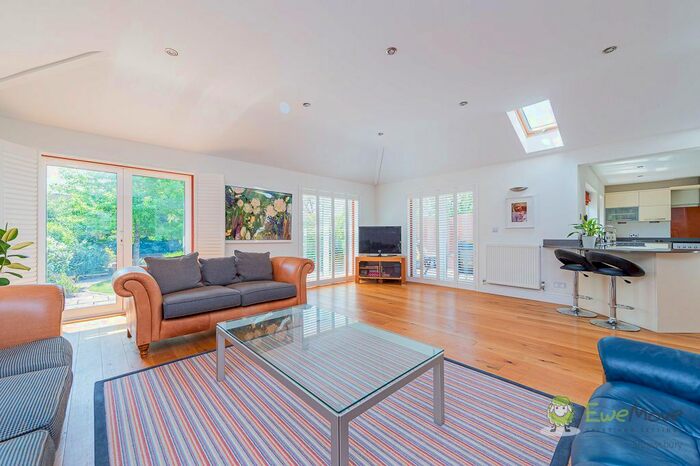
OXLEY COTTAGE Nobold Lane, SY5 8NP, Radbrook Shrewsbury
Property OXLEY COTTAGE has been sold 2 times. The last time it was sold was in 19/12/2018 and the sold price was £490,000.00.
This detached house, sold as a freehold on 19/12/2018, is a 200 sqm detached house with an EPC rating of C.
| Date | Price | Property Type | Tenure | Classification |
|---|---|---|---|---|
| 19/12/2018 | £490,000.00 | Detached House | freehold | Established Building |
| 26/02/1998 | £159,500.00 | Detached House | freehold | Established Building |
NOBOLD LODGE Nobold Lane, SY5 8NP, Radbrook Shrewsbury
Property NOBOLD LODGE has been sold 2 times. The last time it was sold was in 14/06/2002 and the sold price was £179,950.00.
This is a Detached House which was sold as a freehold in 14/06/2002
| Date | Price | Property Type | Tenure | Classification |
|---|---|---|---|---|
| 14/06/2002 | £179,950.00 | Detached House | freehold | Established Building |
| 05/02/1997 | £95,000.00 | Detached House | freehold | Established Building |
Postcodes in Nobold Lane, Radbrook
Navigate through other locations in Nobold Lane, Radbrook, Shrewsbury to see more property listings for sale or to rent.
Transport near SY5 8NP, Nobold Lane
-
 Shrewsbury Station
 -
Yorton Station
-
Church Stretton Station
-
Wellington Station
-
Wem Station
-
Oakengates Station
-
Telford Central Station
-
Prees Station
House price paid reports for SY5 8NP, Nobold Lane
Click on the buttons below to see price paid reports by year or property price:
- Price Paid By Year
Property Price Paid in SY5 8NP, Nobold Lane by Year
The average sold property price by year was:
| Year | Average Sold Price | Price Change |
Sold Properties
|
|---|---|---|---|
| 2018 | £490,000 | 63% |
1 Property |
| 2002 | £179,950 | 11% |
1 Property |
| 1998 | £159,500 | 40% |
1 Property |
| 1997 | £95,000 | - |
1 Property |