
Houses for sale & to rent in Shirley East, Solihull
House Prices in Shirley East
Properties in Shirley East have an average house price of £389k and had 472 Property Transactions within the last 3 years¹.
Shirley East is an area in Solihull, Solihull with 4,644 households², where the most expensive property was sold for £1.1M.
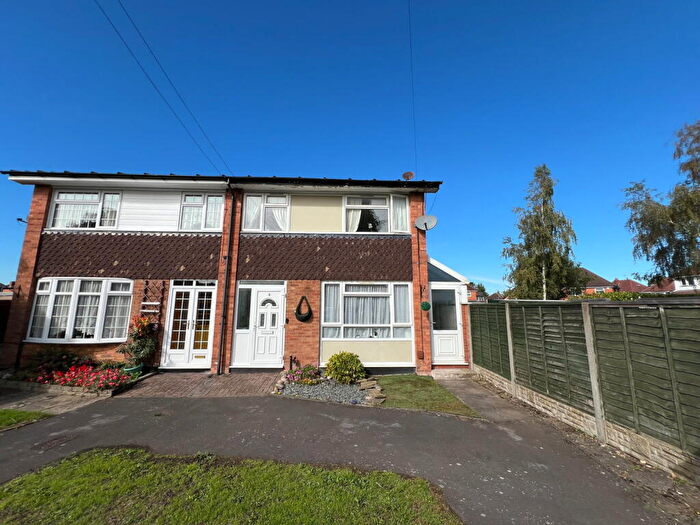
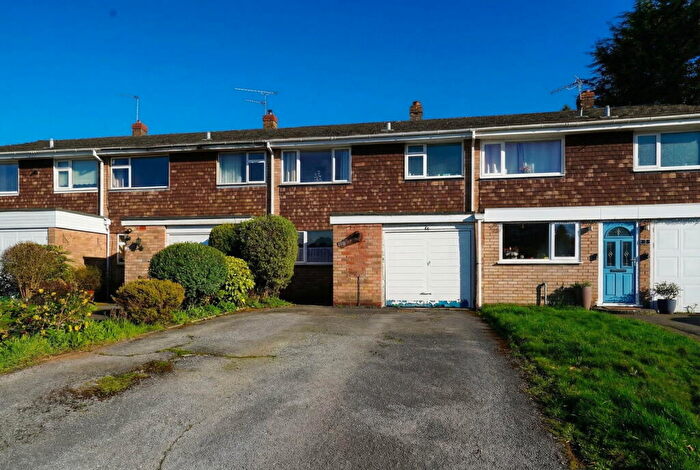
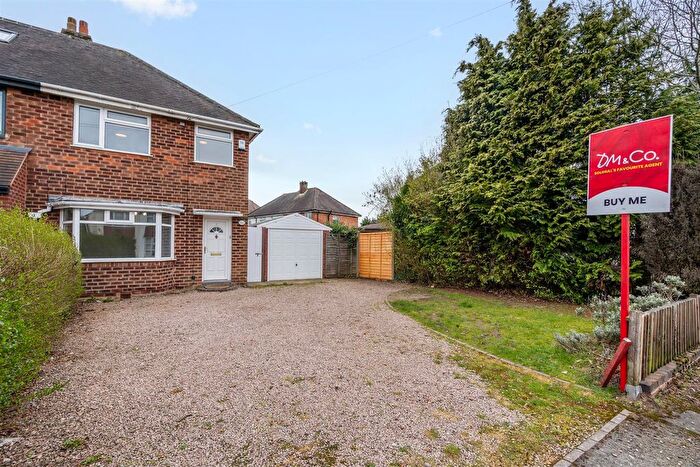
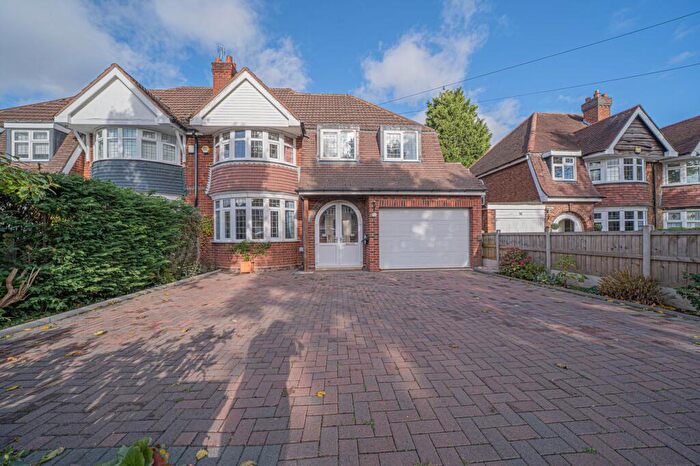
Properties for sale in Shirley East
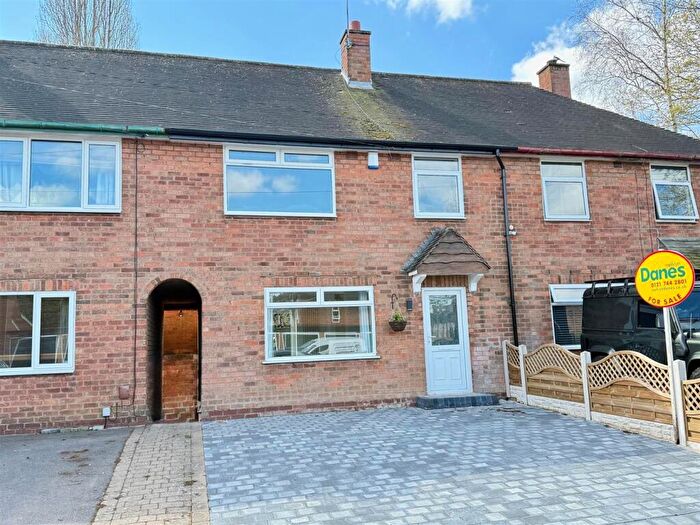

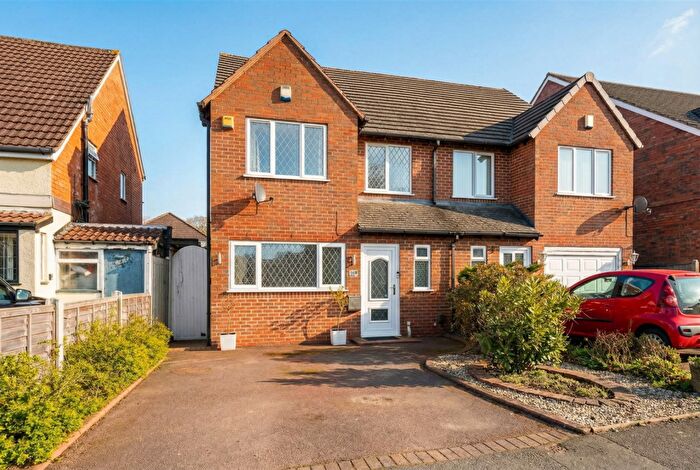
![]()
If you are looking to sell your house, let it out, or receive a property valuation, an expert can help you.
Click the button below to get started.


Roads and Postcodes in Shirley East
Navigate through our locations to find the location of your next house in Shirley East, Solihull for sale or to rent.
Transport near Shirley East
-
 Solihull Station
 -
Shirley Station
-
Yardley Wood Station
-
Olton Station
-
Whitlock's End Station
-
Hall Green Station
-
Widney Manor Station
-
Spring Road Station
-
Acocks Green Station
-
Wythall Station
- FAQ
- Price Paid By Year
- Property Type Price
Frequently asked questions about Shirley East
What is the average price for a property for sale in Shirley East?
The average price for a property for sale in Shirley East is £389,328. This amount is 5% lower than the average price in Solihull. There are 1,876 property listings for sale in Shirley East.
What streets have the most expensive properties for sale in Shirley East?
The streets with the most expensive properties for sale in Shirley East are Danford Lane at an average of £711,166, Rothwell Drive at an average of £701,500 and Nebsworth Close at an average of £660,000.
What streets have the most affordable properties for sale in Shirley East?
The streets with the most affordable properties for sale in Shirley East are Pailton Road at an average of £153,100, Green Hill Way at an average of £164,600 and Featherstone Close at an average of £185,625.
Which train stations are available in or near Shirley East?
Some of the train stations available in or near Shirley East are Solihull, Shirley and Yardley Wood.
Property Price Paid in Shirley East by Year
The average sold property price by year was:
| Year | Average Sold Price | Price Change |
Sold Properties
|
|---|---|---|---|
| 2026 | £363,333 | -6% |
3 Properties |
| 2025 | £385,947 | -1% |
144 Properties |
| 2024 | £389,256 | -1% |
165 Properties |
| 2023 | £392,934 | -4% |
160 Properties |
| 2022 | £407,506 | 11% |
191 Properties |
| 2021 | £363,279 | 8% |
260 Properties |
| 2020 | £334,141 | 3% |
173 Properties |
| 2019 | £325,784 | 5% |
193 Properties |
| 2018 | £310,075 | 5% |
202 Properties |
| 2017 | £294,014 | 1% |
217 Properties |
| 2016 | £292,113 | 8% |
172 Properties |
| 2015 | £269,828 | 6% |
204 Properties |
| 2014 | £252,679 | 5% |
212 Properties |
| 2013 | £241,027 | 4% |
175 Properties |
| 2012 | £231,909 | 1% |
135 Properties |
| 2011 | £229,702 | -1% |
132 Properties |
| 2010 | £232,364 | 9% |
126 Properties |
| 2009 | £210,858 | -8% |
129 Properties |
| 2008 | £228,593 | -6% |
125 Properties |
| 2007 | £242,860 | 1% |
245 Properties |
| 2006 | £240,682 | 7% |
287 Properties |
| 2005 | £224,884 | 4% |
181 Properties |
| 2004 | £215,718 | 9% |
185 Properties |
| 2003 | £196,509 | 15% |
230 Properties |
| 2002 | £166,306 | 19% |
299 Properties |
| 2001 | £134,682 | 11% |
253 Properties |
| 2000 | £119,240 | 9% |
203 Properties |
| 1999 | £108,383 | 11% |
200 Properties |
| 1998 | £96,838 | 8% |
196 Properties |
| 1997 | £88,707 | 1% |
221 Properties |
| 1996 | £88,031 | -5% |
221 Properties |
| 1995 | £92,810 | - |
163 Properties |
Property Price per Property Type in Shirley East
Here you can find historic sold price data in order to help with your property search.
The average Property Paid Price for specific property types in the last three years are:
| Property Type | Average Sold Price | Sold Properties |
|---|---|---|
| Flat | £173,497.00 | 61 Flats |
| Semi Detached House | £404,578.00 | 226 Semi Detached Houses |
| Detached House | £552,066.00 | 86 Detached Houses |
| Terraced House | £346,135.00 | 99 Terraced Houses |