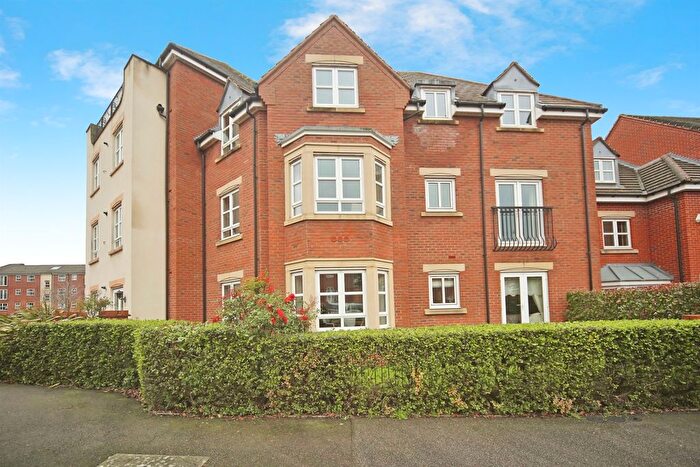
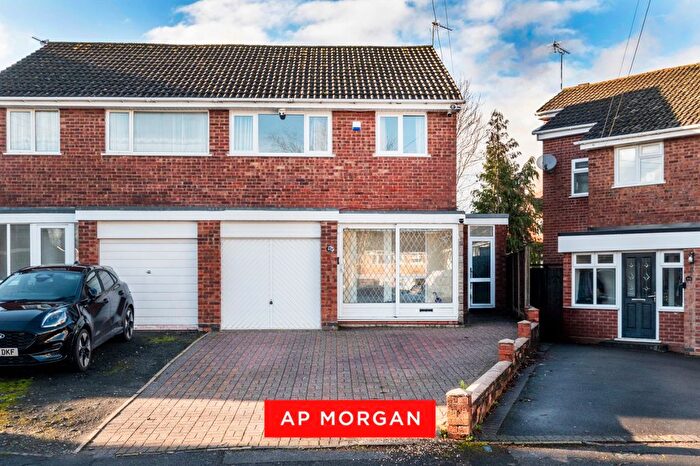
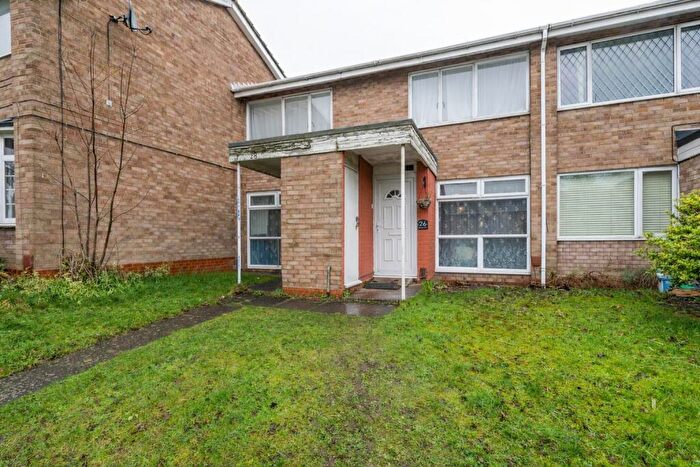
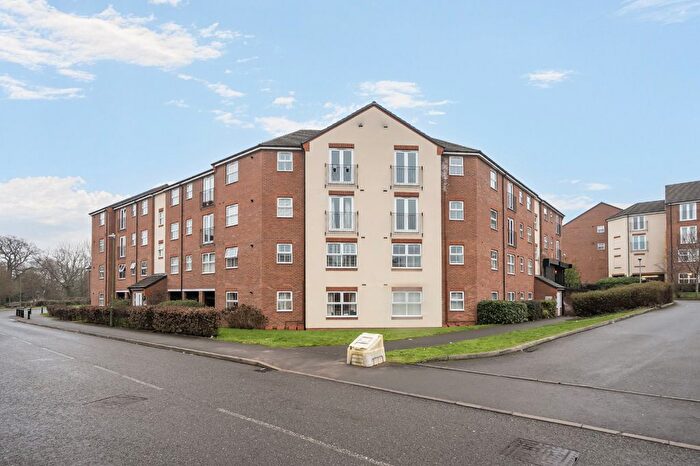
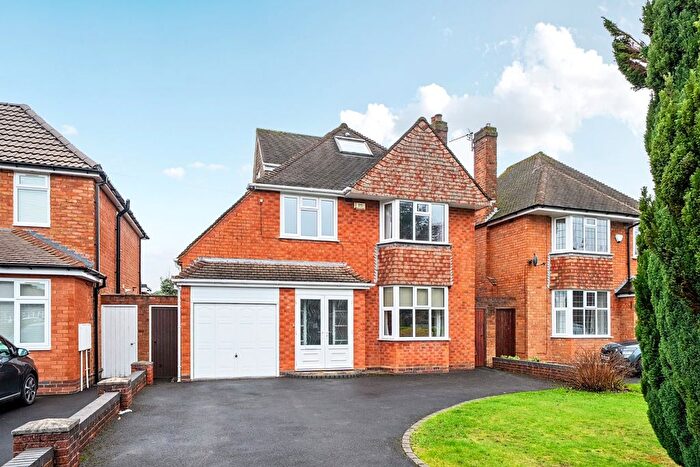
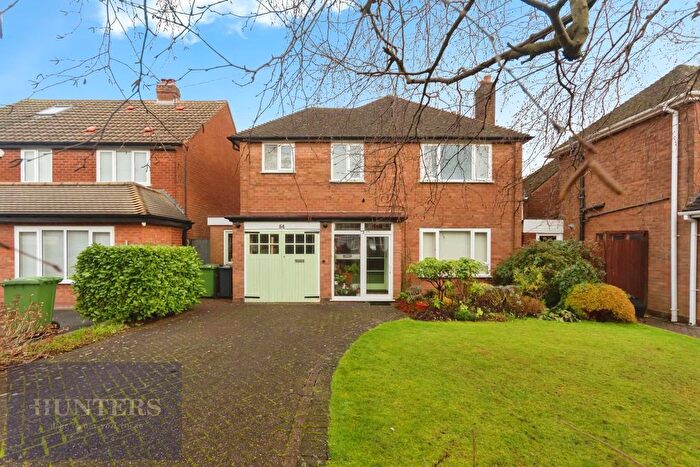
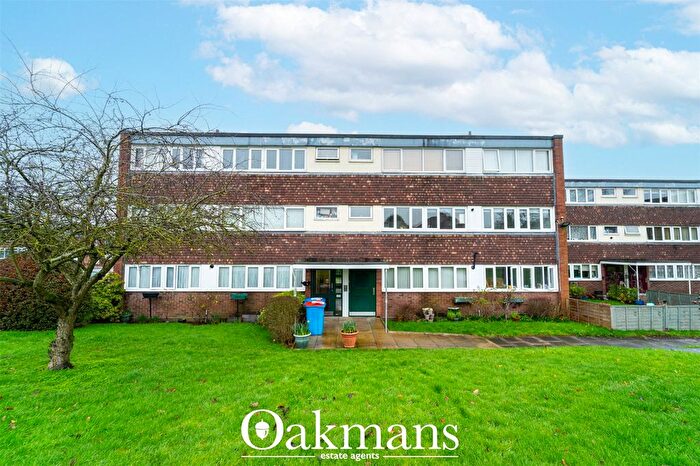
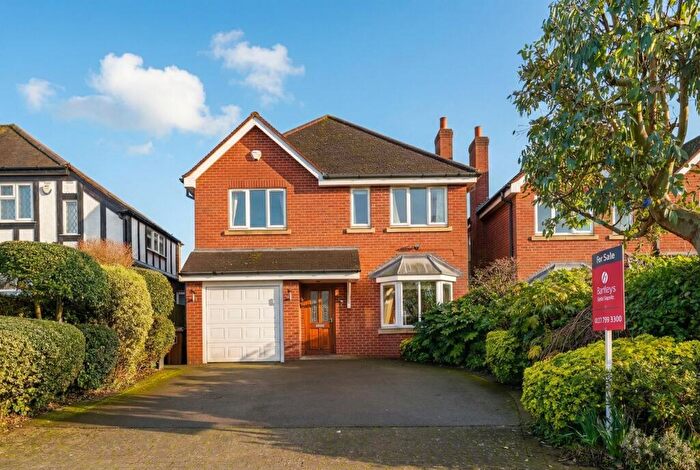
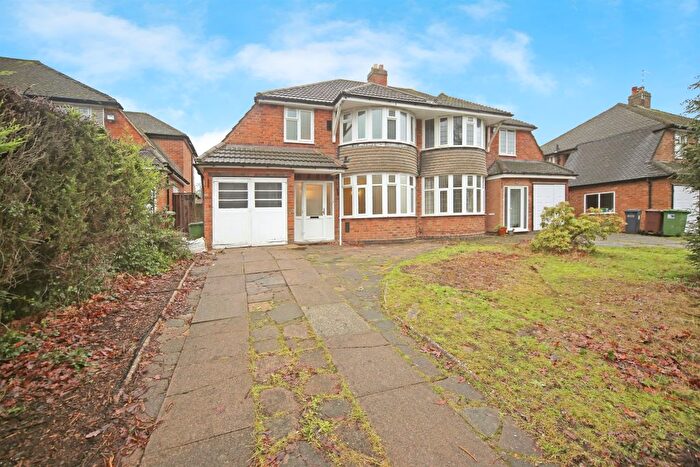
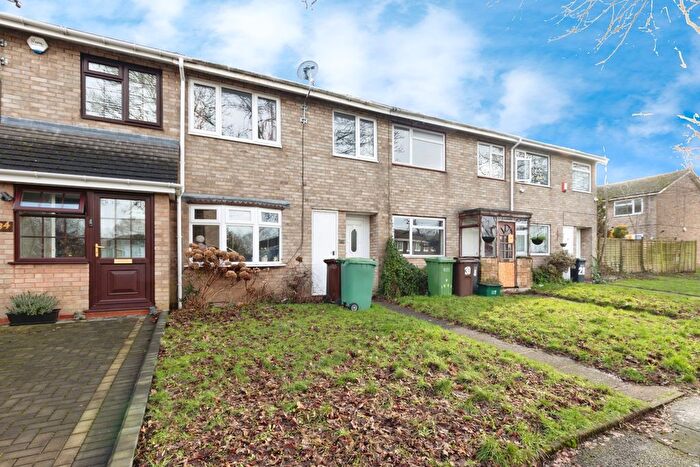
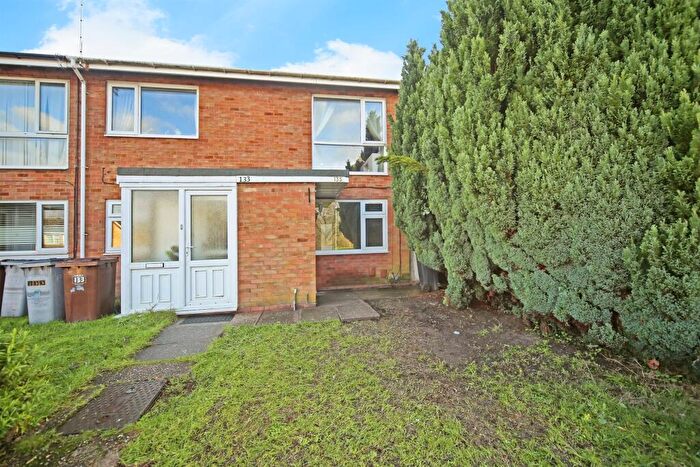
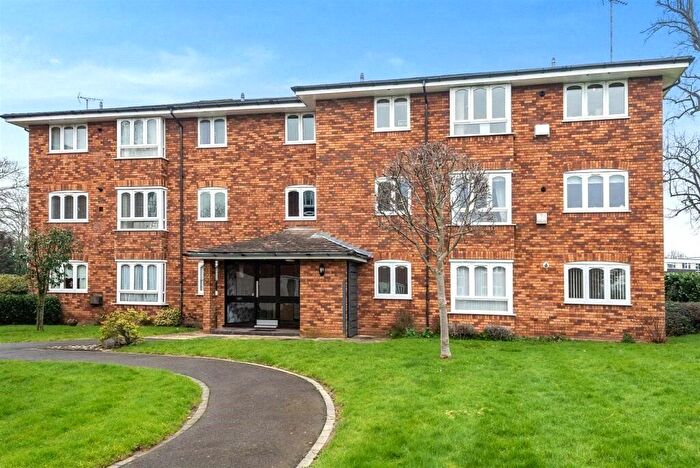
Houses for sale & to rent in Solihull, England
House Prices in Solihull
Properties in Solihull have
an average house price of
£371,767.00
and had 8,139 Property Transactions
within the last 3 years.¹
Solihull is a location in
England with
85,978 households², where the most expensive property was sold for £15,000,000.00.
Properties for sale in Solihull
Towns in Solihull
Navigate through our locations to find the location of your next house in Solihull, England for sale or to rent.
Transport in Solihull
Please see below transportation links in this area:
-
Solihull Station
-
Olton Station
-
Widney Manor Station
-
Birmingham International Station
-
Acocks Green Station
-
Marston Green Station
-
Hampton-In-Arden Station
- FAQ
- Price Paid By Year
- Property Type Price
Frequently asked questions about Solihull
What is the average price for a property for sale in Solihull?
The average price for a property for sale in Solihull is £371,767. This amount is 4% higher than the average price in England. There are more than 10,000 property listings for sale in Solihull.
What locations have the most expensive properties for sale in Solihull?
The locations with the most expensive properties for sale in Solihull are Kenilworth at an average of £659,791 and Coventry at an average of £476,125.
What locations have the most affordable properties for sale in Solihull?
The locations with the most affordable properties for sale in Solihull are Birmingham at an average of £229,004 and Solihull at an average of £408,250.
Which train stations are available in or near Solihull?
Some of the train stations available in or near Solihull are Solihull, Olton and Widney Manor.
Property Price Paid in Solihull by Year
The average sold property price by year was:
| Year | Average Sold Price | Price Change |
Sold Properties
|
|---|---|---|---|
| 2025 | £371,801 | -0,3% |
2,258 Properties |
| 2024 | £372,905 | 1% |
3,056 Properties |
| 2023 | £370,509 | -2% |
2,825 Properties |
| 2022 | £379,736 | 4% |
3,491 Properties |
| 2021 | £366,347 | 7% |
4,507 Properties |
| 2020 | £339,107 | 6% |
2,989 Properties |
| 2019 | £317,849 | 0,3% |
3,544 Properties |
| 2018 | £316,917 | 3% |
3,750 Properties |
| 2017 | £307,378 | 7% |
3,726 Properties |
| 2016 | £285,667 | 3% |
3,707 Properties |
| 2015 | £277,218 | 6% |
3,731 Properties |
| 2014 | £260,210 | 5% |
3,588 Properties |
| 2013 | £247,702 | 3% |
3,101 Properties |
| 2012 | £240,135 | 1% |
2,479 Properties |
| 2011 | £238,068 | -5% |
2,474 Properties |
| 2010 | £251,038 | 10% |
2,427 Properties |
| 2009 | £226,610 | -1% |
2,374 Properties |
| 2008 | £229,223 | -7% |
2,380 Properties |
| 2007 | £244,221 | 5% |
4,490 Properties |
| 2006 | £231,202 | 5% |
4,742 Properties |
| 2005 | £219,840 | 1% |
3,573 Properties |
| 2004 | £217,528 | 11% |
4,307 Properties |
| 2003 | £193,905 | 13% |
3,939 Properties |
| 2002 | £168,717 | 13% |
4,710 Properties |
| 2001 | £146,002 | 10% |
4,413 Properties |
| 2000 | £130,785 | 13% |
4,029 Properties |
| 1999 | £113,802 | 8% |
3,937 Properties |
| 1998 | £104,728 | 9% |
3,592 Properties |
| 1997 | £95,783 | 9% |
3,959 Properties |
| 1996 | £86,851 | 0,5% |
3,602 Properties |
| 1995 | £86,447 | - |
3,033 Properties |
Property Price per Property Type in Solihull
Here you can find historic sold price data in order to help with your property search.
The average Property Paid Price for specific property types in the last three years are:
| Property Type | Average Sold Price | Sold Properties |
|---|---|---|
| Semi Detached House | £353,928.00 | 2,869 Semi Detached Houses |
| Terraced House | £256,136.00 | 1,676 Terraced Houses |
| Detached House | £659,835.00 | 1,936 Detached Houses |
| Flat | £183,152.00 | 1,658 Flats |

