
Houses for sale & to rent in Shirley West, Solihull
House Prices in Shirley West
Properties in Shirley West have an average house price of £293k and had 653 Property Transactions within the last 3 years¹.
Shirley West is an area in Solihull, Solihull with 5,035 households², where the most expensive property was sold for £876k.
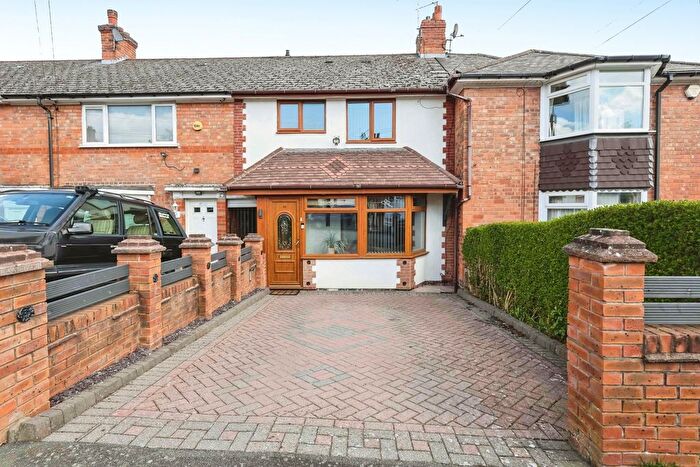
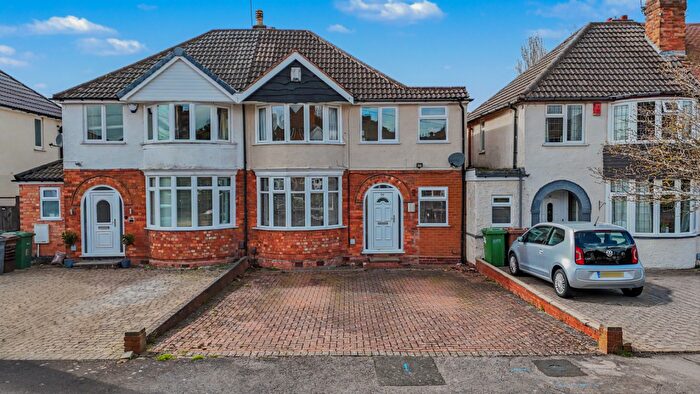
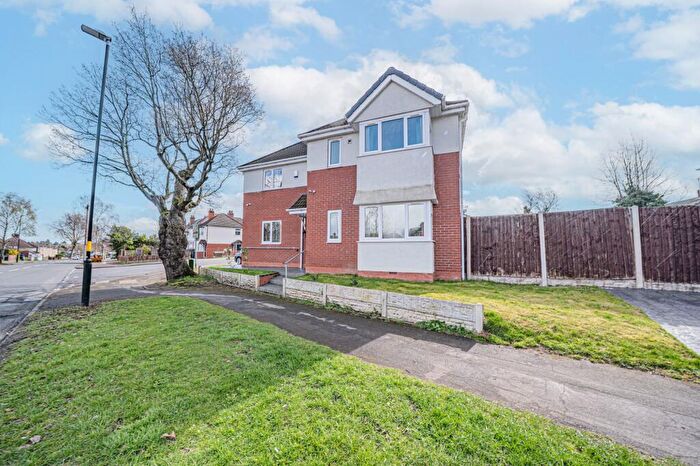
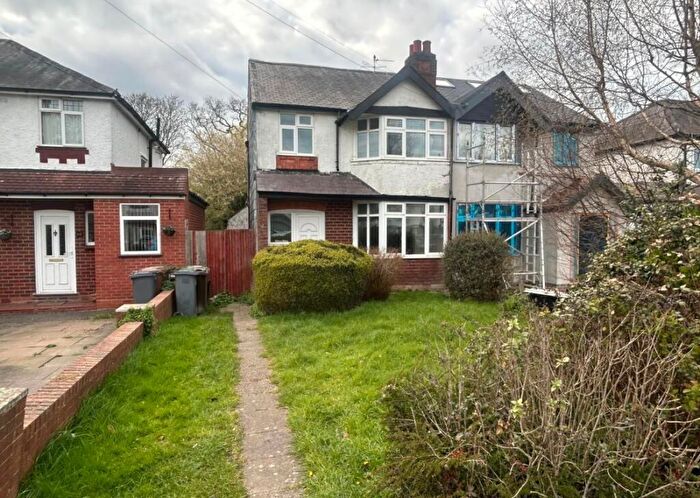
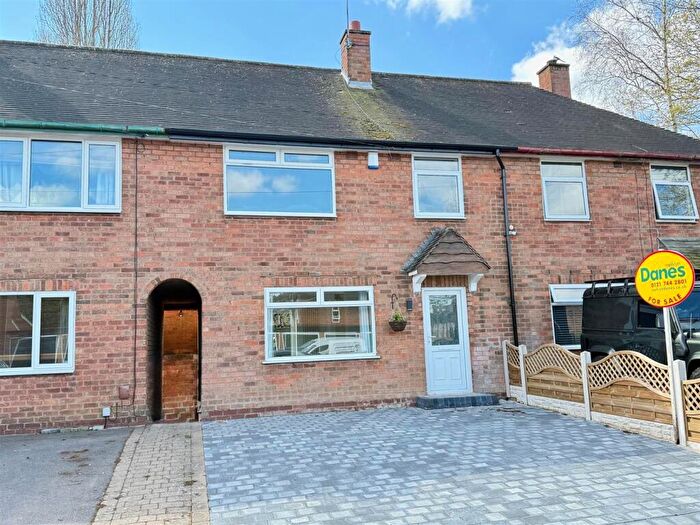
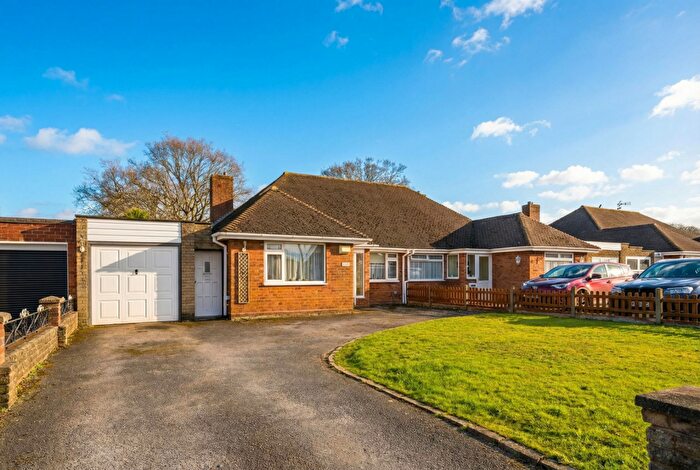
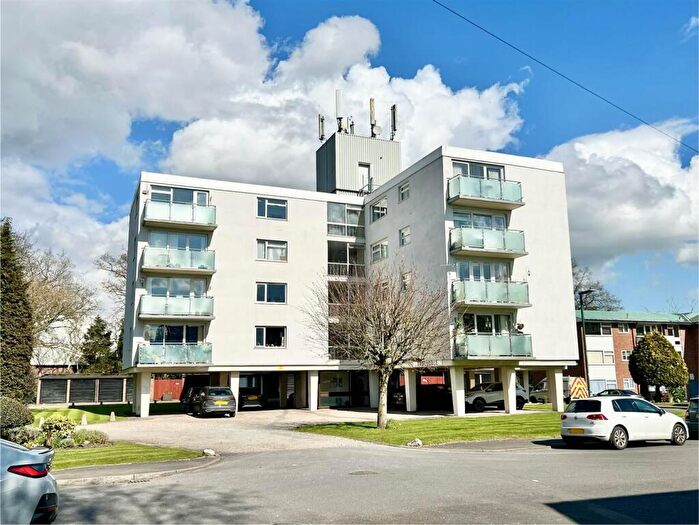
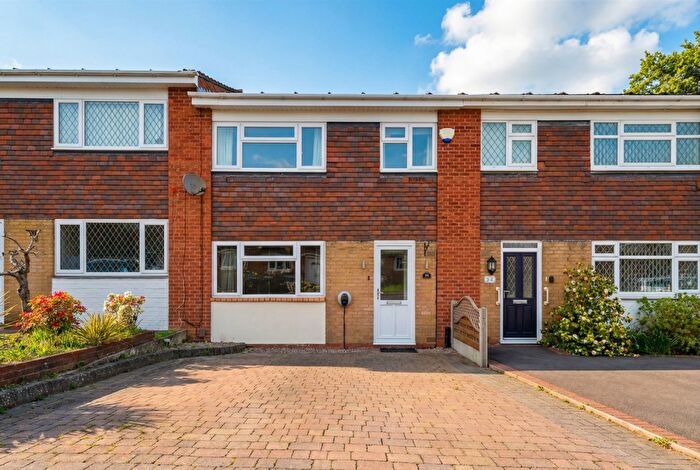
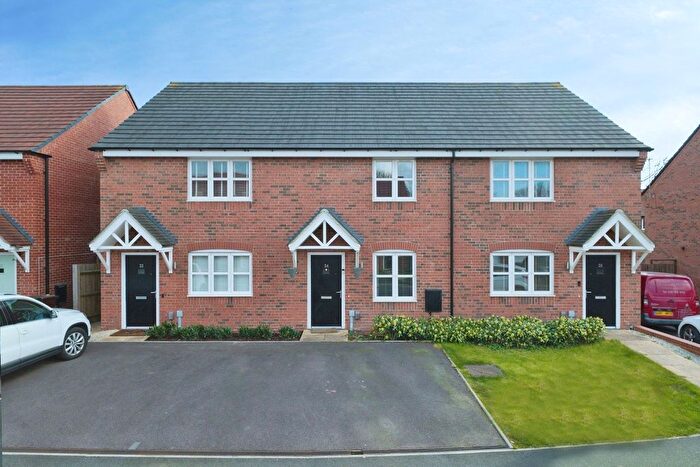
Properties for sale in Shirley West
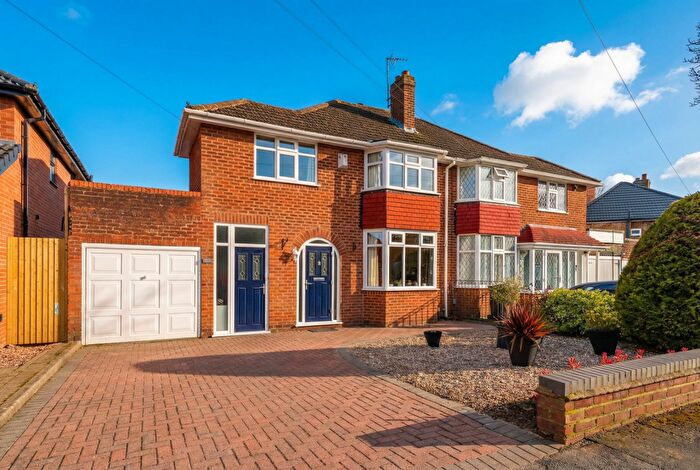


![]()
If you are looking to sell your house, let it out, or receive a property valuation, an expert can help you.
Click the button below to get started.


Roads and Postcodes in Shirley West
Navigate through our locations to find the location of your next house in Shirley West, Solihull for sale or to rent.
Transport near Shirley West
-
 Shirley Station
 -
Yardley Wood Station
-
Whitlock's End Station
-
Hall Green Station
-
Wythall Station
-
Solihull Station
-
Spring Road Station
-
Olton Station
-
Earlswood (West Midlands) Station
- FAQ
- Price Paid By Year
- Property Type Price
Frequently asked questions about Shirley West
What is the average price for a property for sale in Shirley West?
The average price for a property for sale in Shirley West is £292,776. This amount is 28% lower than the average price in Solihull. There are 6,576 property listings for sale in Shirley West.
What streets have the most expensive properties for sale in Shirley West?
The streets with the most expensive properties for sale in Shirley West are Sandy Hill Rise at an average of £690,000, Poppy Place at an average of £546,500 and Burman Road at an average of £468,400.
What streets have the most affordable properties for sale in Shirley West?
The streets with the most affordable properties for sale in Shirley West are Lambscote Close at an average of £114,167, Trinity Way at an average of £153,370 and Atherstone Close at an average of £158,050.
Which train stations are available in or near Shirley West?
Some of the train stations available in or near Shirley West are Shirley, Yardley Wood and Whitlock's End.
Property Price Paid in Shirley West by Year
The average sold property price by year was:
| Year | Average Sold Price | Price Change |
Sold Properties
|
|---|---|---|---|
| 2026 | £155,000 | -101% |
1 Property |
| 2025 | £312,295 | 7% |
186 Properties |
| 2024 | £289,180 | 3% |
221 Properties |
| 2023 | £281,763 | -8% |
245 Properties |
| 2022 | £304,079 | 13% |
213 Properties |
| 2021 | £265,629 | 2% |
349 Properties |
| 2020 | £259,660 | 2% |
254 Properties |
| 2019 | £253,902 | 3% |
250 Properties |
| 2018 | £245,998 | 5% |
264 Properties |
| 2017 | £234,836 | 2% |
205 Properties |
| 2016 | £229,977 | 5% |
279 Properties |
| 2015 | £218,660 | 10% |
366 Properties |
| 2014 | £195,906 | 10% |
218 Properties |
| 2013 | £175,872 | 0,2% |
183 Properties |
| 2012 | £175,467 | -3% |
150 Properties |
| 2011 | £180,111 | 1% |
151 Properties |
| 2010 | £178,785 | 9% |
169 Properties |
| 2009 | £163,133 | -10% |
161 Properties |
| 2008 | £179,442 | -2% |
149 Properties |
| 2007 | £183,247 | 5% |
293 Properties |
| 2006 | £174,281 | -9% |
313 Properties |
| 2005 | £189,333 | 10% |
215 Properties |
| 2004 | £170,699 | 12% |
258 Properties |
| 2003 | £149,464 | 22% |
247 Properties |
| 2002 | £116,899 | 12% |
294 Properties |
| 2001 | £102,458 | 11% |
246 Properties |
| 2000 | £91,320 | 17% |
272 Properties |
| 1999 | £76,053 | 5% |
241 Properties |
| 1998 | £72,574 | 9% |
249 Properties |
| 1997 | £66,275 | 4% |
260 Properties |
| 1996 | £63,301 | 8% |
221 Properties |
| 1995 | £58,339 | - |
186 Properties |
Property Price per Property Type in Shirley West
Here you can find historic sold price data in order to help with your property search.
The average Property Paid Price for specific property types in the last three years are:
| Property Type | Average Sold Price | Sold Properties |
|---|---|---|
| Flat | £170,666.00 | 165 Flats |
| Semi Detached House | £325,709.00 | 350 Semi Detached Houses |
| Detached House | £420,415.00 | 64 Detached Houses |
| Terraced House | £298,890.00 | 74 Terraced Houses |