
Houses for sale in Solihull, Solihull
House Prices in Solihull
Properties in Solihull have an average house price of £409k and had 6,310 Property Transactions within the last 3 years.¹
Solihull is an area in Solihull with 58,587 households², where the most expensive property was sold for £15M.
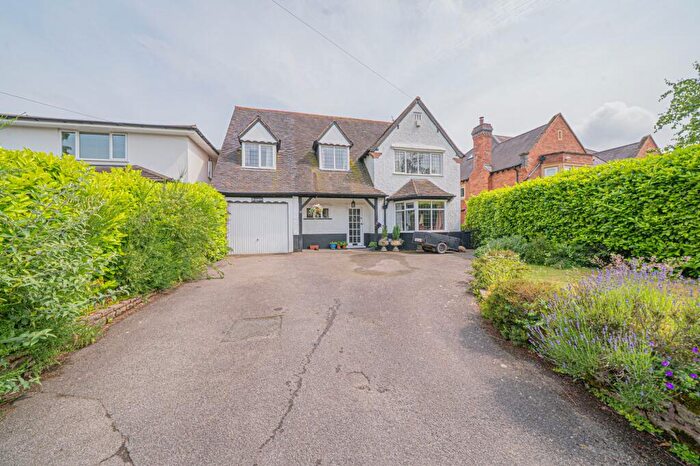
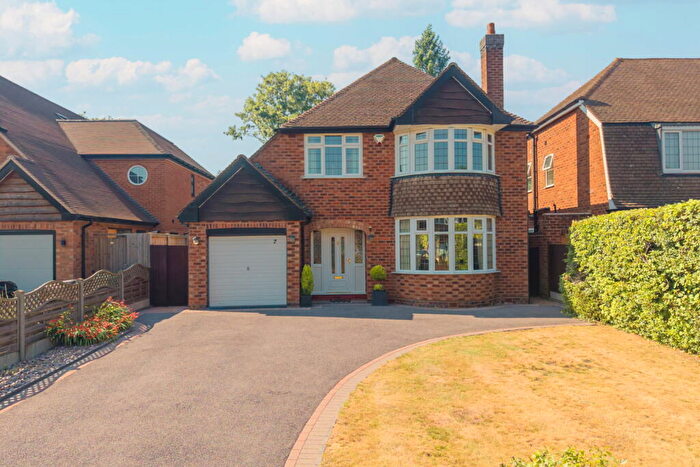
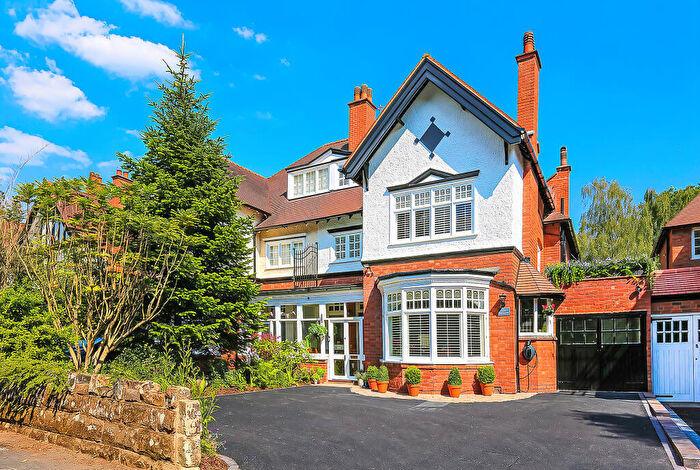
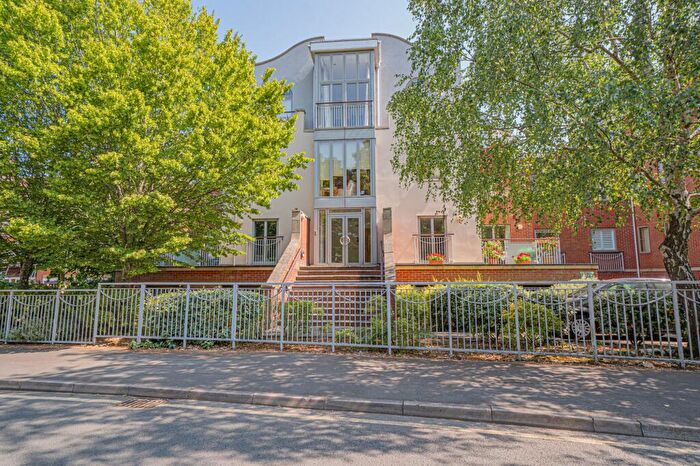
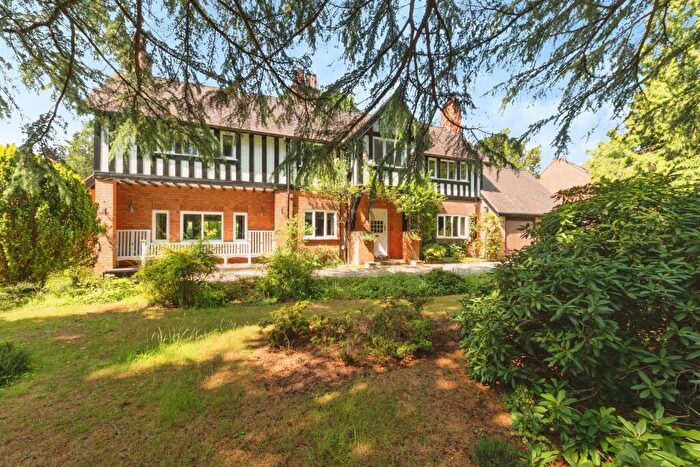
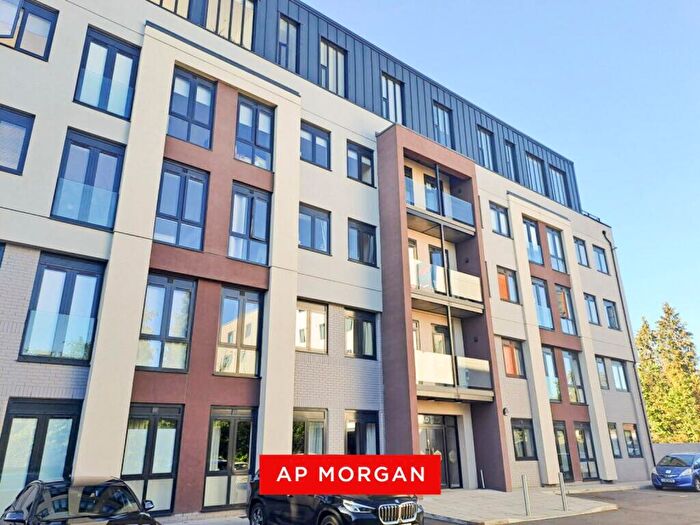
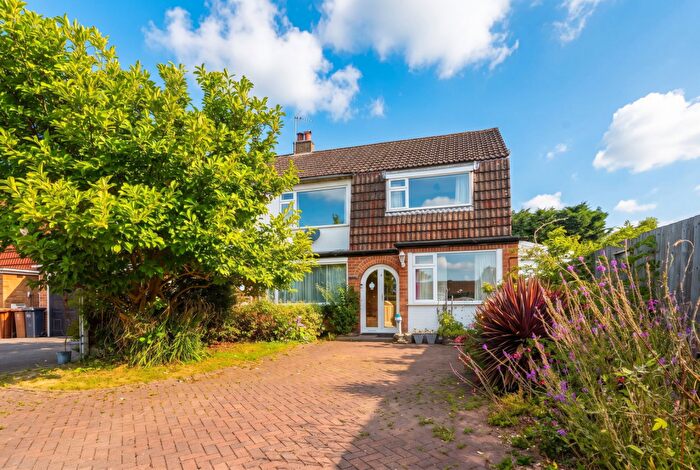
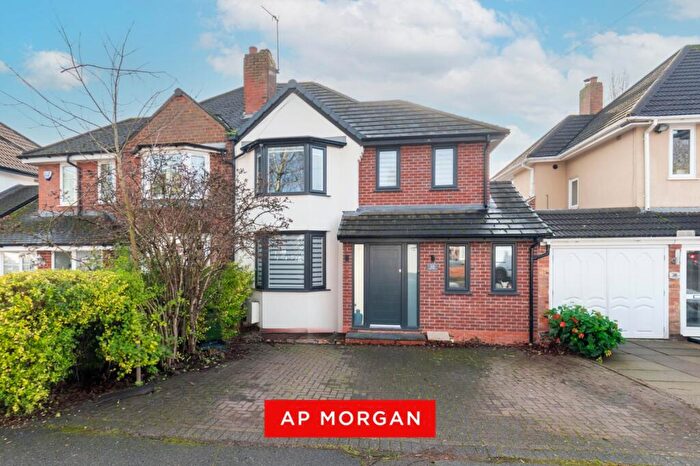
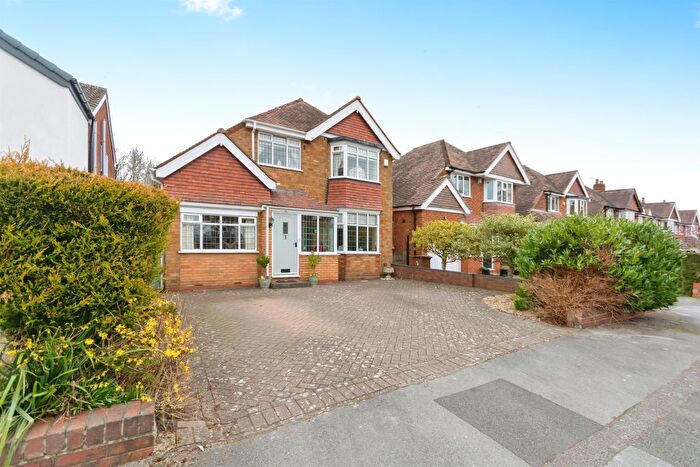
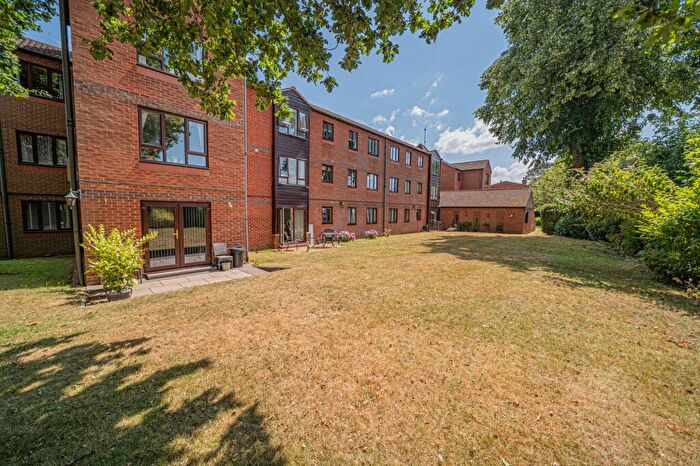
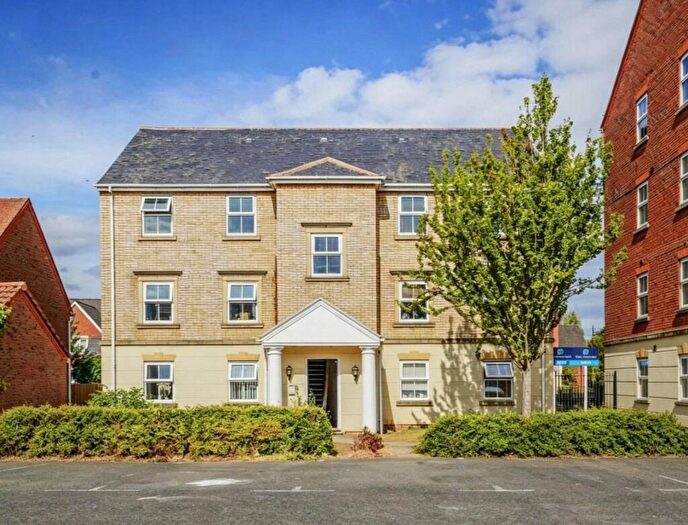
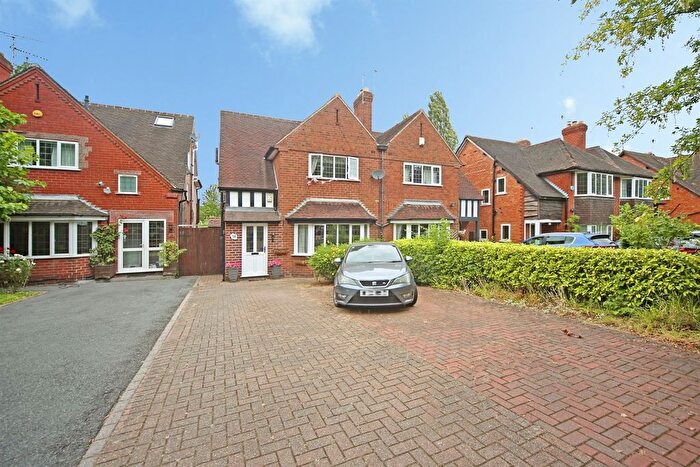
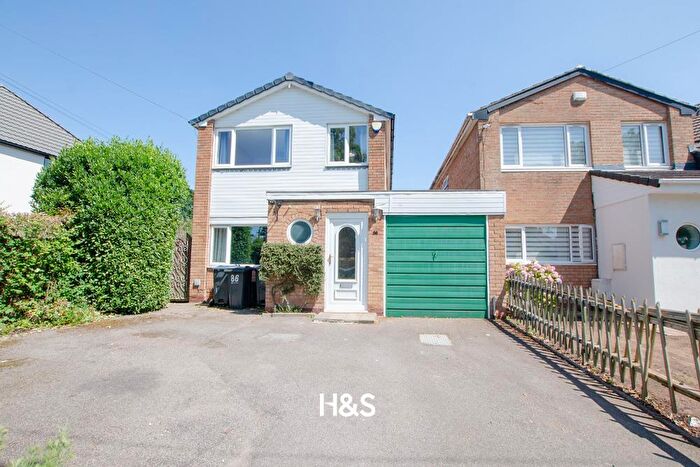
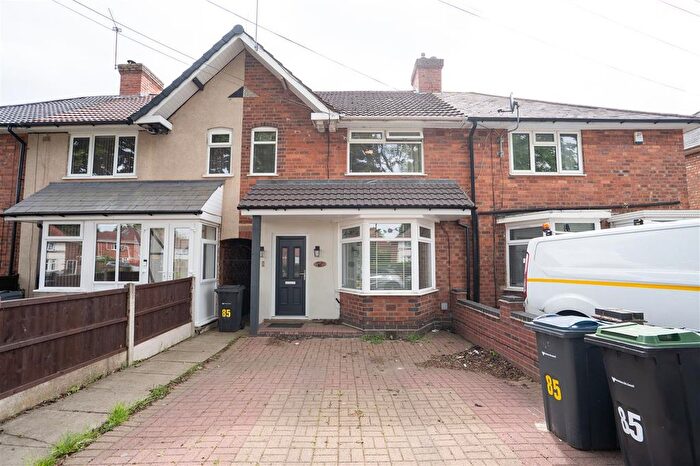
Properties for sale in Solihull
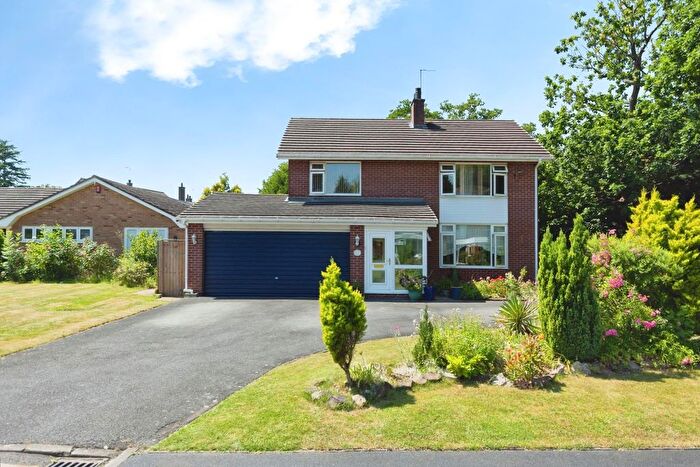
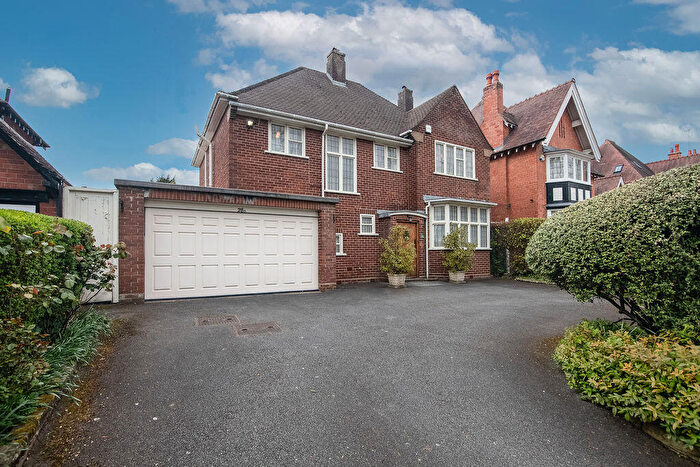
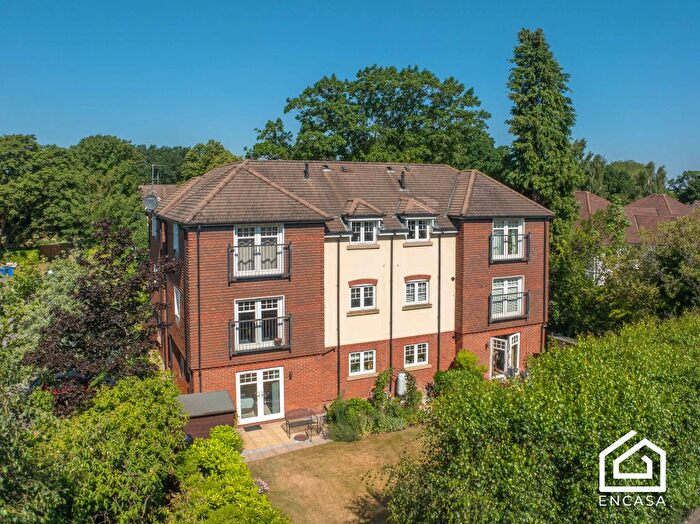
![]()
If you are looking to sell your house, let it out, or receive a property valuation, an expert can help you.
Click the button below to get started.


Neighbourhoods in Solihull
Navigate through our locations to find the location of your next house in Solihull, Solihull for sale or to rent.
Property price trends in Solihull
According to the latest Land Registry data, the average home in Solihull sold for £414,143 in 2026. That figure comes from a substantial record of 80,427 sales logged over the past 31 years.
Prices have held fairly steady over the last three years. Compared with 2023, when the typical sale came in around £408,339, values are broadly unchanged.
Looking back five years, average prices are up about 5.6% since 2021, a gain of around £22,012 in cash terms.
Zoom out to the past decade for the fuller picture. Back in 2016, homes here averaged £316,726, so the typical sold price has climbed about 30.8% since then, roughly 2.7% a year. Stretch the view to fifteen years and that annual pace edges up closer to 3.2%.
Frequently asked questions about Solihull
What is the average price for a property for sale in Solihull?
The average price for a property for sale in Solihull is £409,153. This amount is 10% higher than the average price in Solihull. There are more than 10,000 property listings for sale in Solihull.
What locations have the most expensive properties for sale in Solihull?
The locations with the most expensive properties for sale in Solihull are Dorridge And Hockley Heath at an average of £622,786, Knowle at an average of £605,124 and St Alphege at an average of £585,916.
What locations have the most affordable properties for sale in Solihull?
The locations with the most affordable properties for sale in Solihull are Smiths Wood at an average of £184,227, Shirley West at an average of £292,054 and Lyndon at an average of £295,845.
Which train stations are available in or near Solihull?
Some of the train stations available in or near Solihull are Solihull, Widney Manor and Olton.
Property Price Paid in Solihull by Year
The average sold property price by year was:
| Year | Average Sold Price | Price Change |
Sold Properties
|
|---|---|---|---|
| 2026 | £414,143 | 2% |
151 Properties |
| 2025 | £405,983 | -2% |
1,897 Properties |
| 2024 | £412,344 | 1% |
2,180 Properties |
| 2023 | £408,339 | -2% |
2,082 Properties |
| 2022 | £415,825 | 6% |
2,542 Properties |
| 2021 | £392,131 | 6% |
3,412 Properties |
| 2020 | £367,073 | 5% |
2,288 Properties |
| 2019 | £350,540 | 0,5% |
2,549 Properties |
| 2018 | £348,884 | 5% |
2,691 Properties |
| 2017 | £332,067 | 5% |
2,759 Properties |
Property Price per Property Type in Solihull
Here you can find historic sold price data in order to help with your property search.
The average Property Paid Price for specific property types in the last three years are:
| Property Type | Average Sold Price | Sold Properties |
|---|---|---|
| Semi Detached House | £374,846.00 | 2,308 Semi Detached Houses |
| Terraced House | £311,220.00 | 901 Terraced Houses |
| Detached House | £691,042.00 | 1,669 Detached Houses |
| Flat | £197,522.00 | 1,432 Flats |
Transport in Solihull
Please see below transportation links in this area:
