
Houses for sale in Patchway Coniston, Bristol
House Prices in Patchway Coniston
Properties in Patchway Coniston have an average house price of £5.69M and had 2 Property Transactions within the last 3 years¹.
Patchway Coniston is an area in Bristol, South Gloucestershire with 145 households², where the most expensive property was sold for £11.1M.
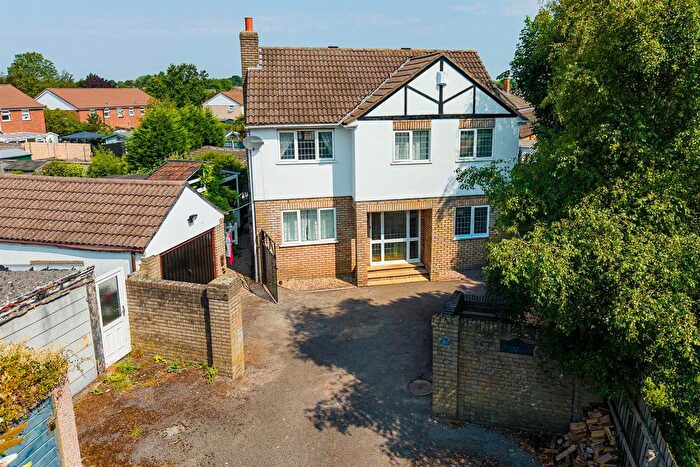
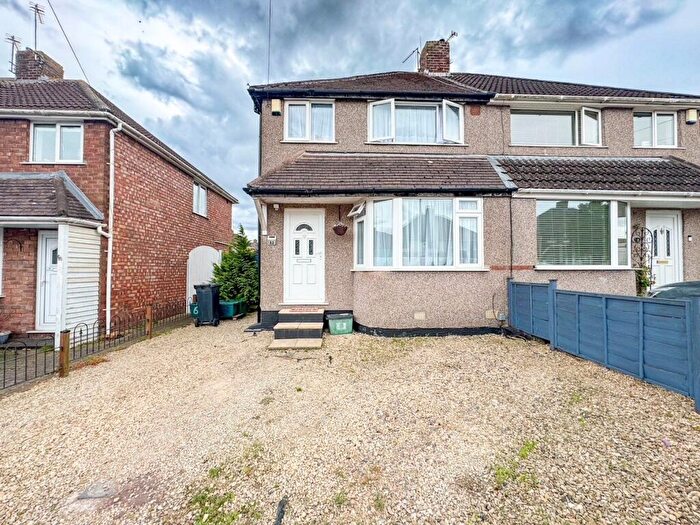
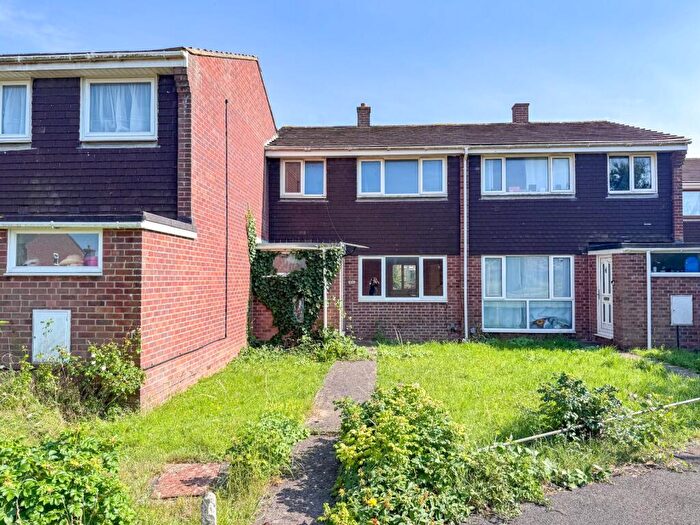
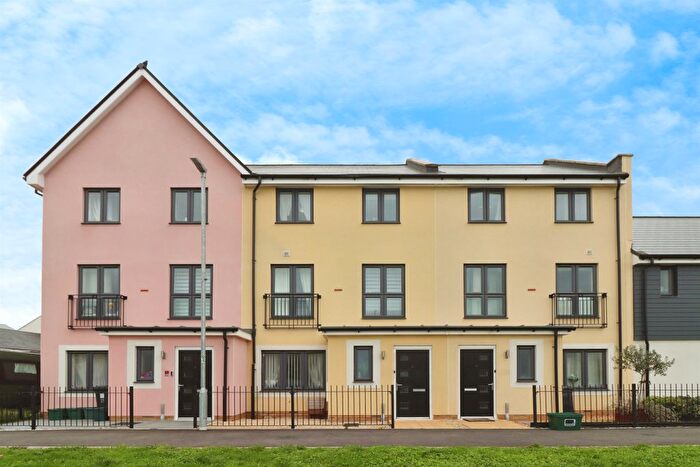
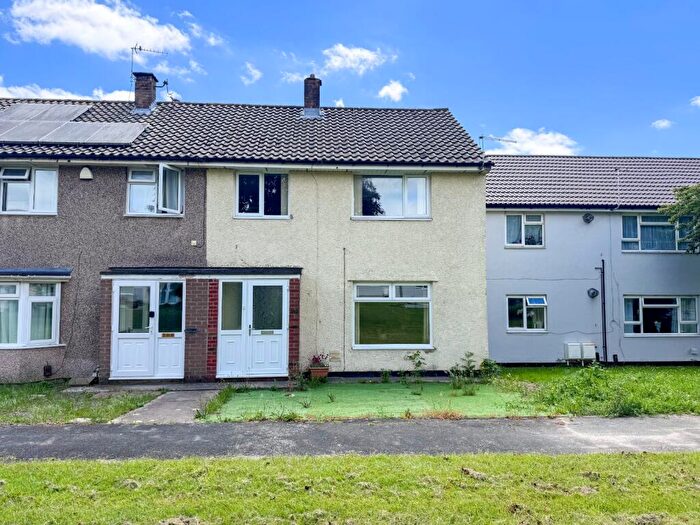
Properties for sale in Patchway Coniston
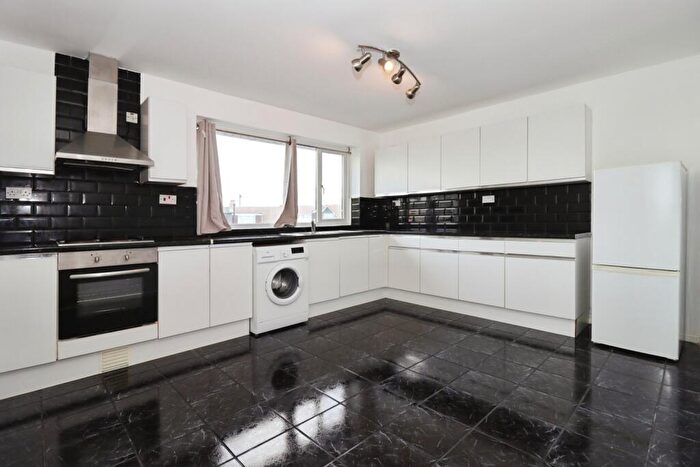
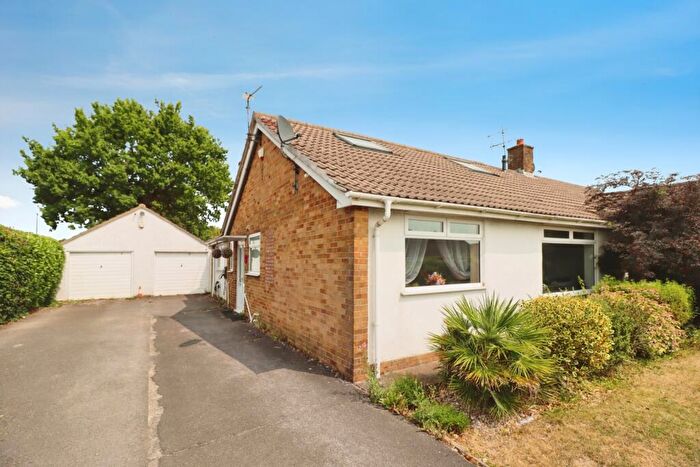
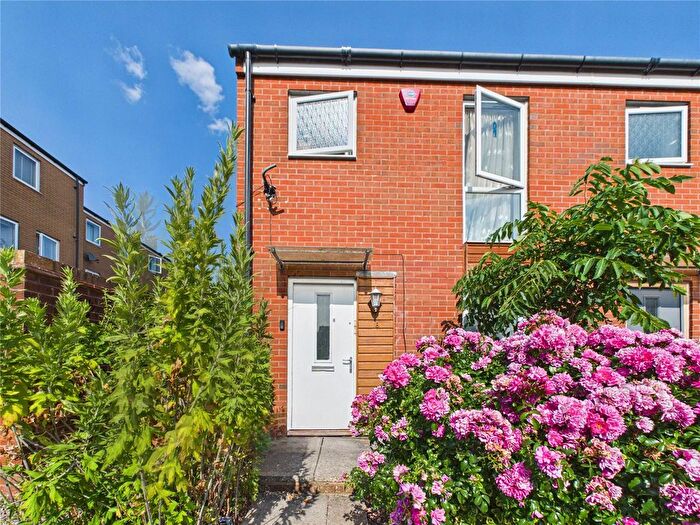
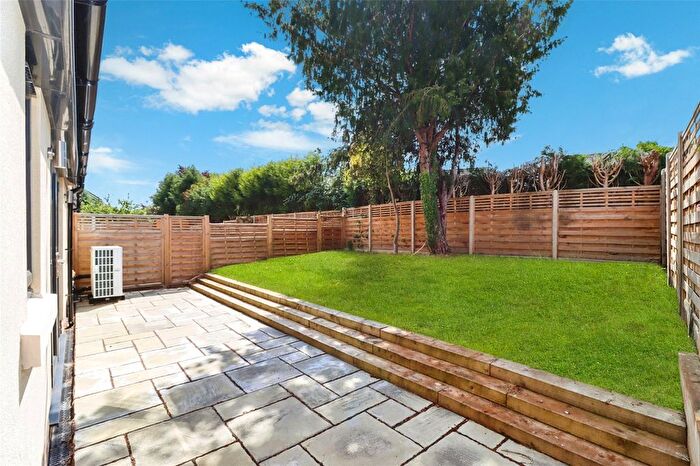
![]()
If you are looking to sell your house, let it out, or receive a property valuation, an expert can help you.
Click the button below to get started.

Roads and Postcodes in Patchway Coniston
Navigate through our locations to find the location of your next house in Patchway Coniston, Bristol for sale or to rent.
Property price trends in Patchway Coniston
According to the latest Land Registry data, the average home in Patchway Coniston sold for £5,692,600 in 2023. That figure comes from 8 sales logged over the past 23 years.
Prices have continued to climb over the last three years. Compared with 2020, when the typical sale came in around £225,000, that's a rise of roughly 2430%.
Looking back five years, average prices are up about 2177% since 2018, a gain of around £5,442,600 in cash terms.
Zoom out to the past decade for the fuller picture. Back in 2014, homes here averaged £62,500, so the typical sold price has climbed about 9008.2% since then, roughly 65.1% a year.
Frequently asked questions about Patchway Coniston
What is the average price for a property for sale in Patchway Coniston?
The average price for a property for sale in Patchway Coniston is £5,692,600. This amount is 1515% higher than the average price in Bristol. There are 962 property listings for sale in Patchway Coniston.
Which train stations are available in or near Patchway Coniston?
Some of the train stations available in or near Patchway Coniston are Patchway, Bristol Parkway and Filton Abbey Wood.
Property Price Paid in Patchway Coniston by Year
The average sold property price by year was:
| Year | Average Sold Price | Price Change |
Sold Properties
|
|---|---|---|---|
| 2023 | £5,692,600 | 96% |
2 Properties |
| 2020 | £225,000 | -11% |
1 Property |
| 2018 | £250,000 | 22% |
1 Property |
| 2017 | £195,000 | -36% |
1 Property |
| 2016 | £265,500 | 76% |
1 Property |
| 2014 | £62,500 | -8% |
1 Property |
| 2000 | £67,500 | - |
1 Property |
Property Price per Property Type in Patchway Coniston
Here you can find historic sold price data in order to help with your property search.
The average Property Paid Price for specific property types in the last three years are:
| Property Type | Average Sold Price | Sold Properties |
|---|---|---|
| Terraced House | £285,200.00 | 1 Terraced House |
| Detached House | £11,100,000.00 | 1 Detached House |
