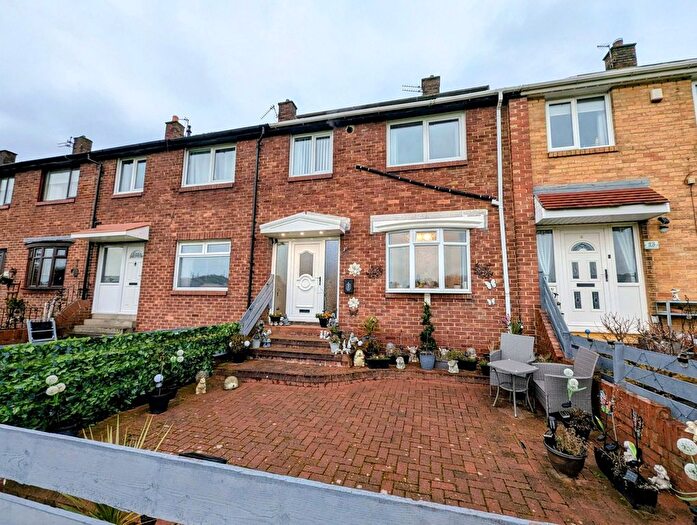
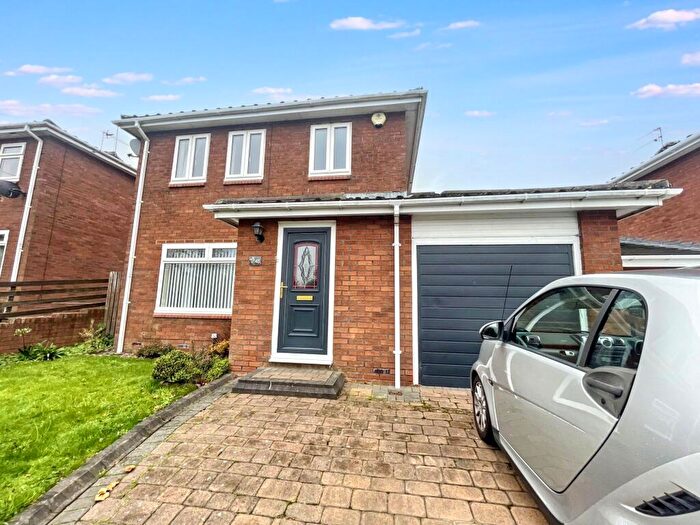
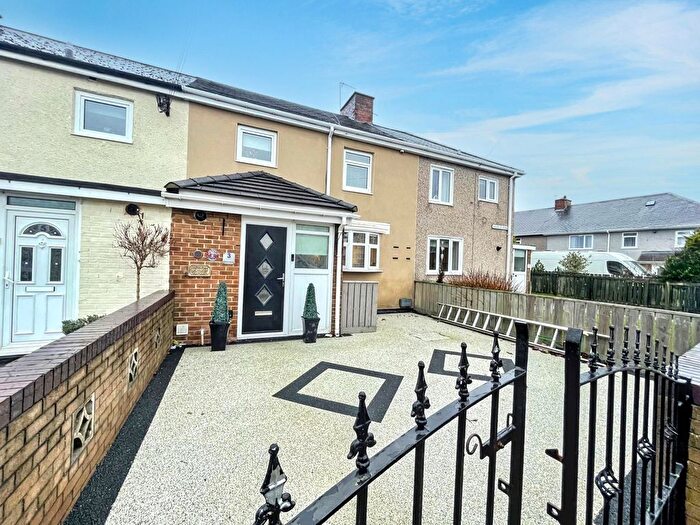
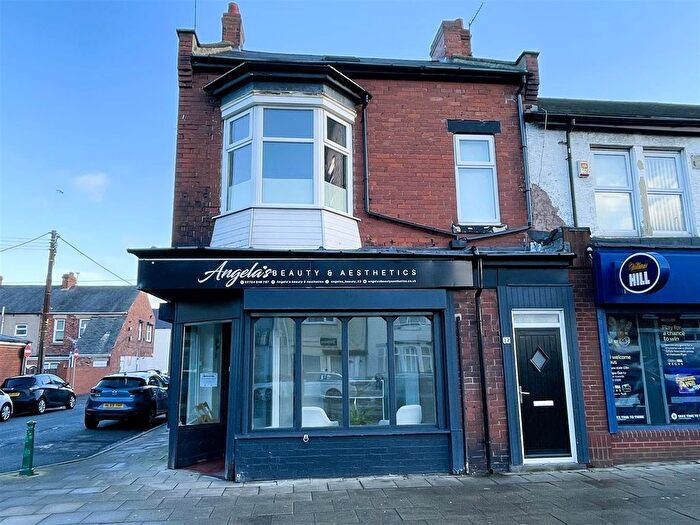
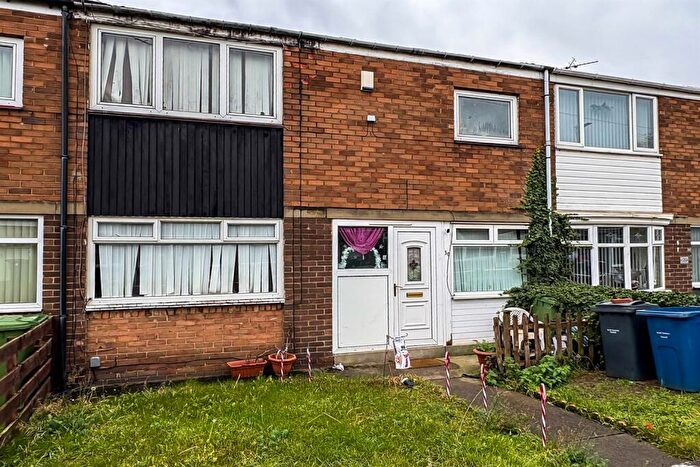
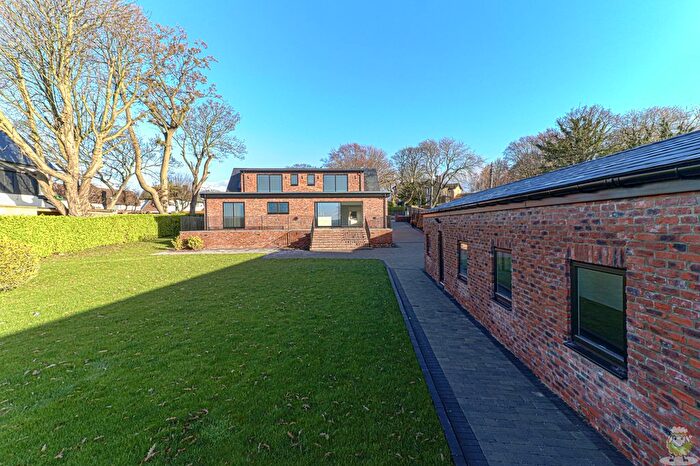
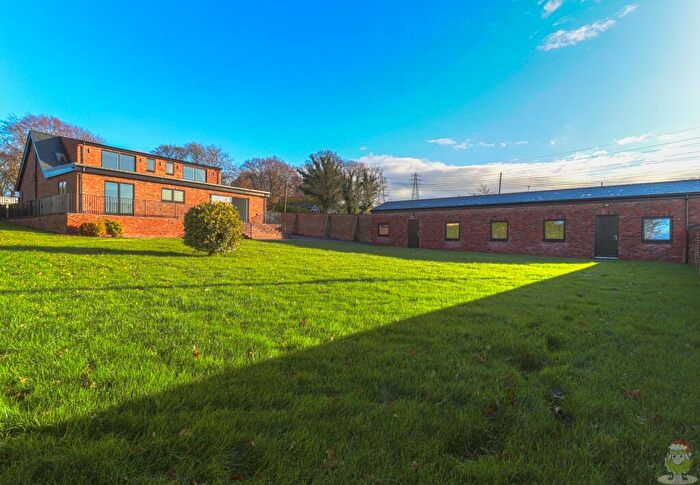
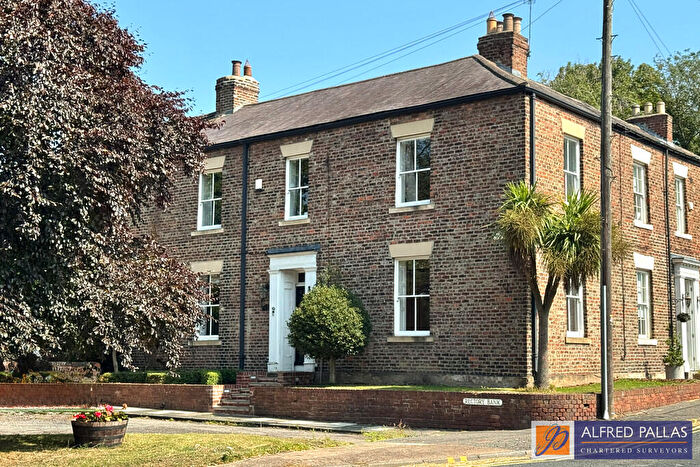
Houses for sale & to rent in Boldon Colliery, Boldon Colliery
House Prices in Boldon Colliery
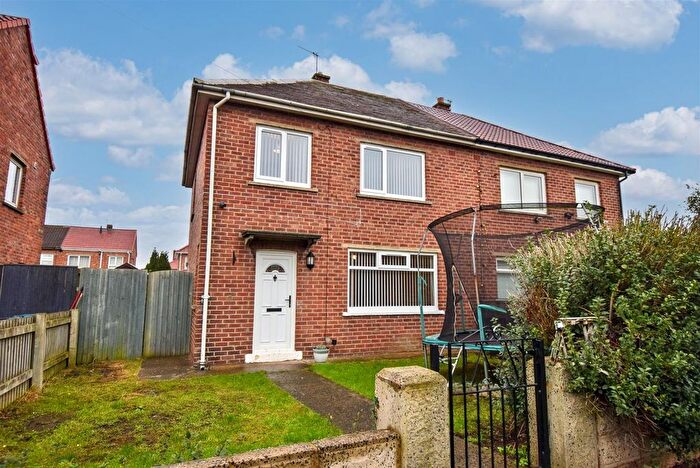
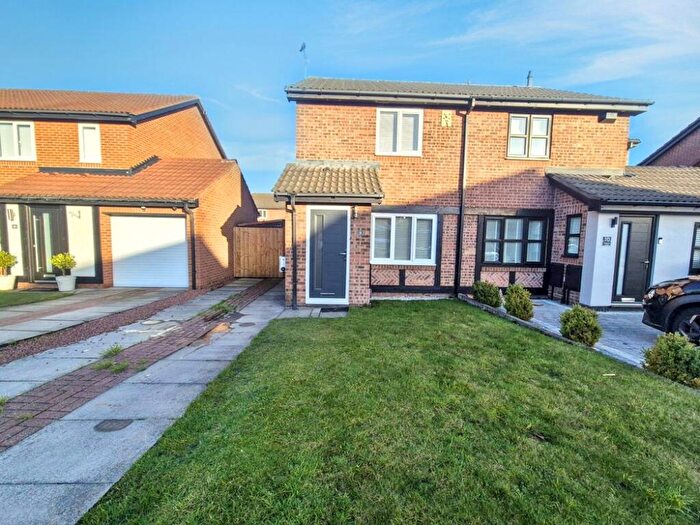
Properties in Boldon Colliery have an average house price of £163,638.00 and had 210 Property Transactions within the last 3 years¹.
Boldon Colliery is an area in Boldon Colliery, South Tyneside with 2,773 households², where the most expensive property was sold for £412,500.00.
Properties for sale in Boldon Colliery
Roads and Postcodes in Boldon Colliery
Navigate through our locations to find the location of your next house in Boldon Colliery, Boldon Colliery for sale or to rent.
| Streets | Postcodes |
|---|---|
| Abingdon Way | NE35 9PB |
| Albert Edward Terrace | NE35 9HJ |
| Alderley Close | NE35 9LE |
| Arnold Street | NE35 9AZ NE35 9BA NE35 9BD NE35 9BE |
| Badminton Close | NE35 9LD |
| Bensham Street | NE35 9LN |
| Berkeley Close | NE35 9LQ |
| Boldon Lea | NE35 9BT |
| Brockhampton Close | NE35 9HD |
| Brockley Terrace | NE35 9HN |
| Brooke Avenue | NE35 9ED NE35 9ES NE35 9ER |
| Brooklands Way | NE35 9LY NE35 9LZ |
| Burford Way | NE35 9PY NE35 9PZ |
| Burns Avenue | NE35 9EF |
| Burnside Close | NE35 9BU |
| Byron Avenue | NE35 9DT NE35 9DX |
| Charles Street | NE35 9BG NE35 9BH NE35 9BJ NE35 9BQ NE35 9BZ |
| Cheltenham Drive | NE35 9HE |
| Church View | NE35 9JR |
| Churchdown Close | NE35 9HA |
| Cinderford Close | NE35 9LB |
| Colliery Mews | NE35 9NJ |
| Coronation Terrace | NE35 9HW |
| Crudwell Close | NE35 9JW |
| Davison Street | NE35 9JQ |
| Didcot Way | NE35 9PD |
| Dodds Buildings | NE35 9JG |
| Donkins Street | NE35 9HY |
| Donside Close | NE35 9BS |
| Dunelm Grange | NE35 9AB |
| East View | NE35 9AU NE35 9AY |
| Eastcombe Close | NE35 9HB |
| Eastleigh Close | NE35 9NG |
| Edgeworth Close | NE35 9JS |
| Elizabeth Row | NE35 9DA |
| Ernest Street | NE35 9DW NE35 9DN |
| Evesham Close | NE35 9LL |
| Fareham Grove | NE35 9NF |
| Fawley Close | NE35 9NQ |
| Fenwick Street | NE35 9HU |
| George Court | NE35 9DB |
| Gibson Court | NE35 9AN |
| Gladstone Terrace | NE35 9HL |
| Grays Terrace | NE35 9JF |
| Hambledon Close | NE35 9NB |
| Hedworth Lane | NE35 9HS NE35 9HZ NE35 9JD NE35 9HT NE35 9JA NE35 9JB |
| Hindmarch Drive | NE35 9EW |
| Hubert Street | NE35 9AP |
| Hutton Street | NE35 9LW |
| John Street | NE35 9BN |
| Johnstone Mews | NE35 9AF |
| Keats Avenue | NE35 9EJ NE35 9EL NE35 9EN |
| Kingswood Close | NE35 9LG |
| Kipling Avenue | NE35 9EE NE35 9EG NE35 9EH |
| Langford Drive | NE35 9LJ |
| Lawson Court | NE35 9NH |
| Leander Drive | NE35 9LS NE35 9LX NE35 9LP |
| Morris Crescent | NE35 9DY |
| Nailsworth Close | NE35 9JT |
| New Road | NE35 9BF NE35 9DE NE35 9DS NE35 9DR NE35 9DZ |
| North Road | NE35 9AR NE35 9AX NE35 9AL |
| Oswald Close | NE35 9BY |
| Owen Drive | NE35 9EQ |
| Oxley Mews | NE35 9BB |
| Pages Buildings | NE35 9AH |
| Portchester Grove | NE35 9ND |
| Reay Crescent | NE35 9EB |
| Reginald Street | NE35 9DQ NE35 9DG |
| Romsey Drive | NE35 9NA |
| Roseberry Terrace | NE35 9HH |
| Ruskin Drive | NE35 9DU |
| Shelley Avenue | NE35 9EA |
| Shipton Close | NE35 9JL |
| Sidney Street | NE35 9DP |
| Simpson Close | NE35 9JP |
| South Crescent | NE35 9DF NE35 9DH |
| Station Road | NE35 9HP |
| Steeple View | NE35 9AD |
| Store Buildings | NE35 9AQ |
| Tennyson Avenue | NE35 9EP |
| The Terrace | NE35 9AA |
| Thornbury Close | NE35 9LF |
| Toppings Street | NE35 9HX |
| Watson Terrace | NE35 9BL |
| Wells Street | NE35 9AE |
| Whitchurch Close | NE35 9LH |
| Wilfred Street | NE35 9DJ NE35 9DL |
| Wilton Gardens North | NE35 9HQ |
| Wilton Gardens South | NE35 9HG |
| Wimborne Close | NE35 9NE |
| Winslow Close | NE35 9LR |
| Witney Way | NE35 9PE |
| Woodside Drive | NE35 9BP |
| Woodstock Way | NE35 9PF |
| NE35 9HR NE35 9HF NE35 9JE |
Transport near Boldon Colliery
-
Heworth Station
-
Sunderland Station
-
Manors Station
-
Newcastle Station
-
Dunston Station
-
Chester-Le-Street Station
-
MetroCentre Station
-
Seaham Station
- FAQ
- Price Paid By Year
- Property Type Price
Frequently asked questions about Boldon Colliery
What is the average price for a property for sale in Boldon Colliery?
The average price for a property for sale in Boldon Colliery is £163,638. There are 527 property listings for sale in Boldon Colliery.
What streets have the most expensive properties for sale in Boldon Colliery?
The streets with the most expensive properties for sale in Boldon Colliery are Boldon Lea at an average of £370,000, Winslow Close at an average of £366,250 and Leander Drive at an average of £311,000.
What streets have the most affordable properties for sale in Boldon Colliery?
The streets with the most affordable properties for sale in Boldon Colliery are Pages Buildings at an average of £55,000, Eastcombe Close at an average of £57,000 and Arnold Street at an average of £60,555.
Which train stations are available in or near Boldon Colliery?
Some of the train stations available in or near Boldon Colliery are Heworth, Sunderland and Manors.
Property Price Paid in Boldon Colliery by Year
The average sold property price by year was:
| Year | Average Sold Price | Price Change |
Sold Properties
|
|---|---|---|---|
| 2025 | £161,721 | -2% |
70 Properties |
| 2024 | £164,659 | 0,1% |
72 Properties |
| 2023 | £164,532 | 7% |
68 Properties |
| 2022 | £153,694 | -5% |
60 Properties |
| 2021 | £161,552 | 11% |
106 Properties |
| 2020 | £143,804 | -18% |
72 Properties |
| 2019 | £169,124 | 12% |
71 Properties |
| 2018 | £149,296 | 2% |
65 Properties |
| 2017 | £145,674 | 4% |
71 Properties |
| 2016 | £140,091 | 1% |
78 Properties |
| 2015 | £138,923 | -4% |
84 Properties |
| 2014 | £145,102 | 8% |
111 Properties |
| 2013 | £133,014 | 8% |
88 Properties |
| 2012 | £122,126 | 5% |
57 Properties |
| 2011 | £115,703 | -29% |
66 Properties |
| 2010 | £149,384 | 3% |
78 Properties |
| 2009 | £144,894 | 4% |
62 Properties |
| 2008 | £139,141 | 13% |
100 Properties |
| 2007 | £121,085 | -2% |
131 Properties |
| 2006 | £123,461 | 7% |
118 Properties |
| 2005 | £114,369 | 10% |
96 Properties |
| 2004 | £103,317 | 21% |
142 Properties |
| 2003 | £81,355 | 9% |
152 Properties |
| 2002 | £74,118 | 14% |
162 Properties |
| 2001 | £63,646 | 7% |
138 Properties |
| 2000 | £59,147 | -2% |
109 Properties |
| 1999 | £60,508 | 8% |
110 Properties |
| 1998 | £55,561 | 9% |
83 Properties |
| 1997 | £50,355 | -0,1% |
108 Properties |
| 1996 | £50,404 | 1% |
114 Properties |
| 1995 | £49,965 | - |
104 Properties |
Property Price per Property Type in Boldon Colliery
Here you can find historic sold price data in order to help with your property search.
The average Property Paid Price for specific property types in the last three years are:
| Property Type | Average Sold Price | Sold Properties |
|---|---|---|
| Semi Detached House | £167,683.00 | 64 Semi Detached Houses |
| Detached House | £288,572.00 | 40 Detached Houses |
| Terraced House | £121,712.00 | 87 Terraced Houses |
| Flat | £78,976.00 | 19 Flats |

