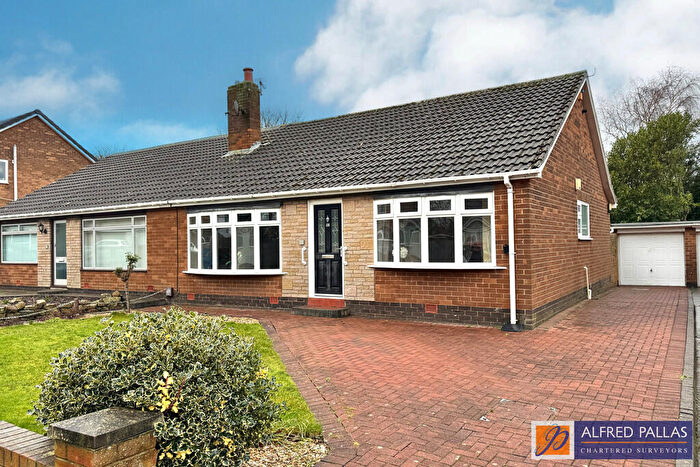
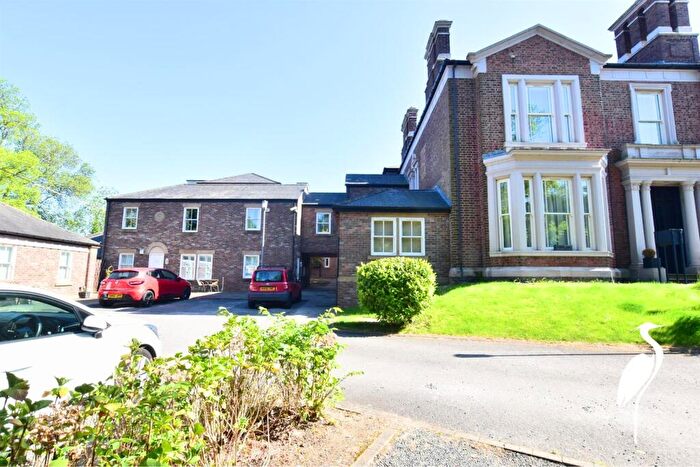
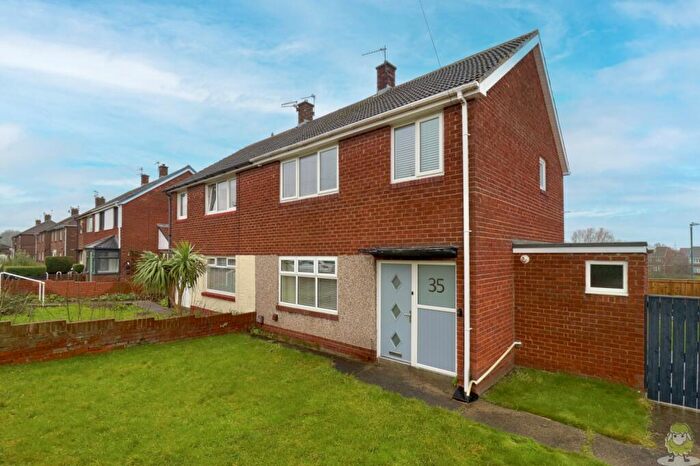
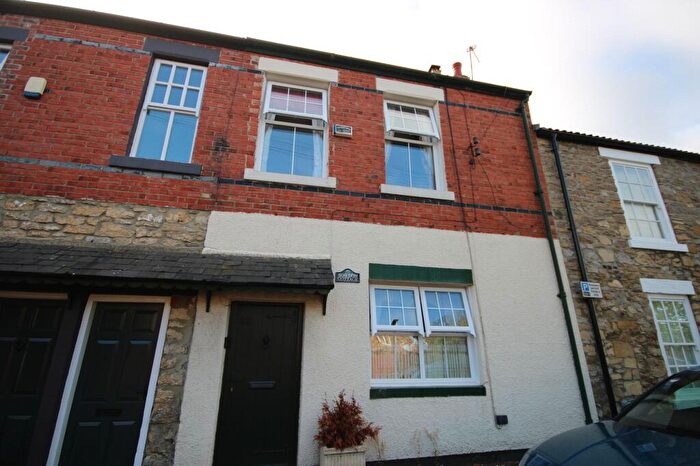
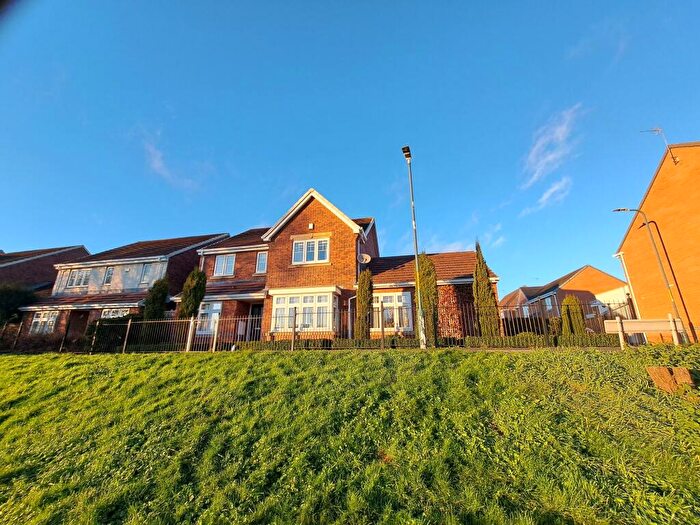
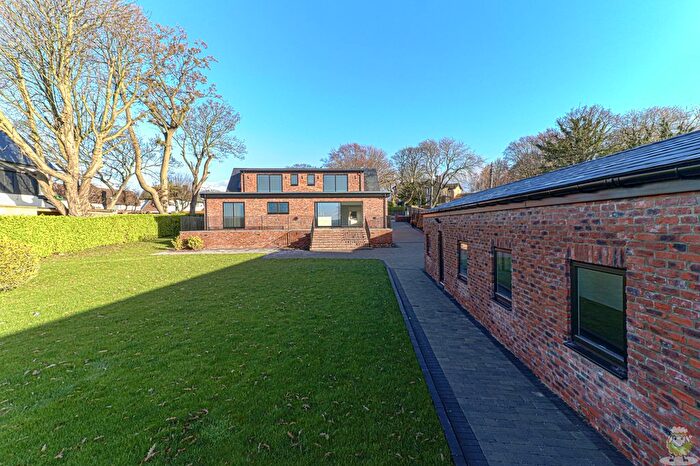
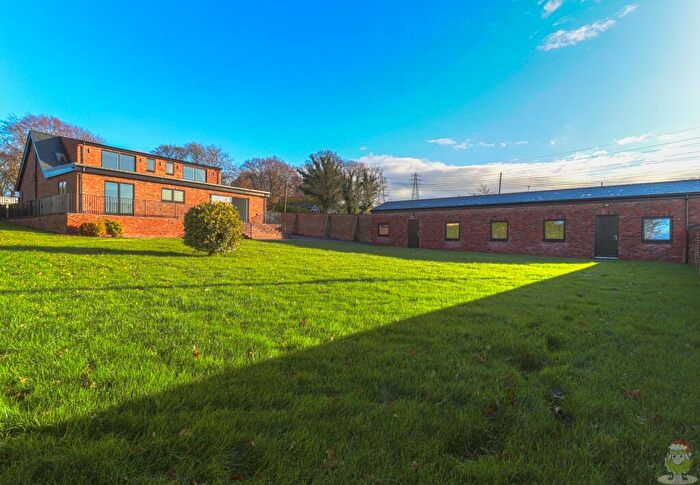
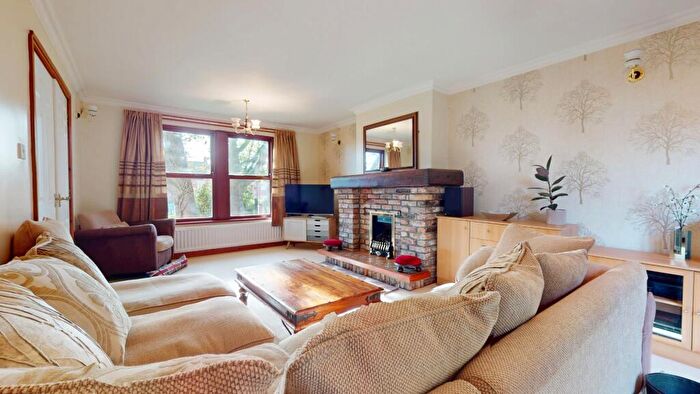
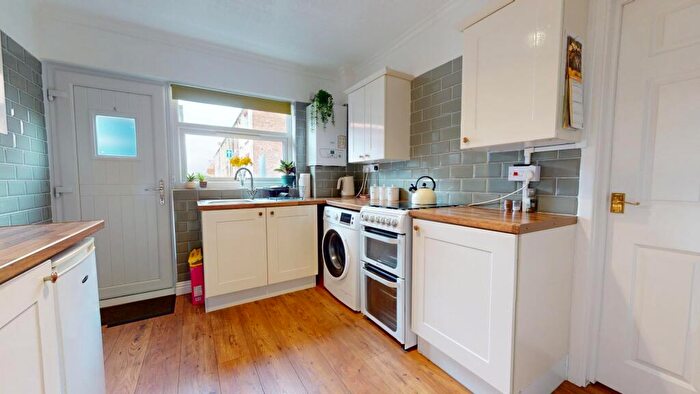
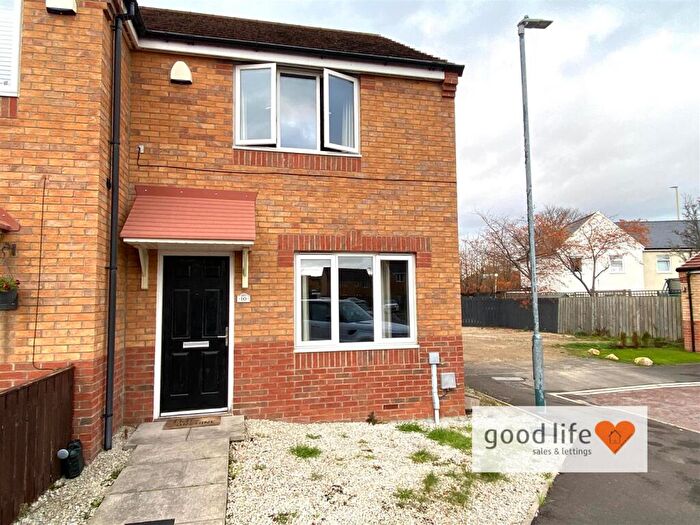
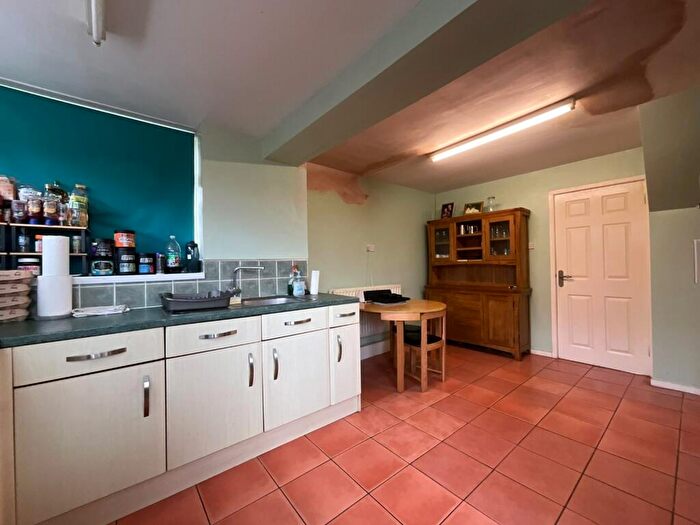
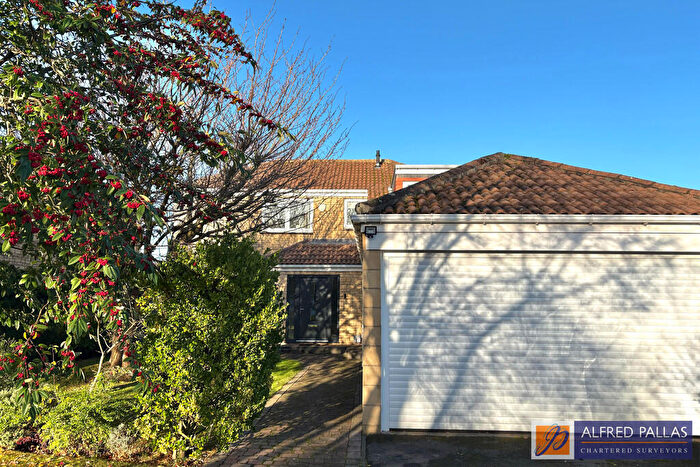
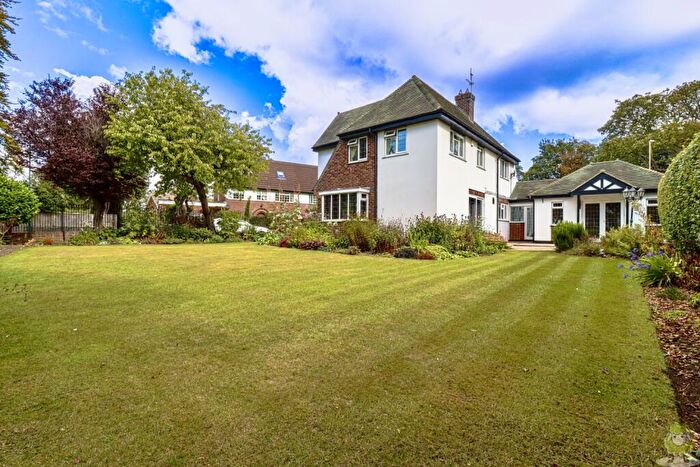
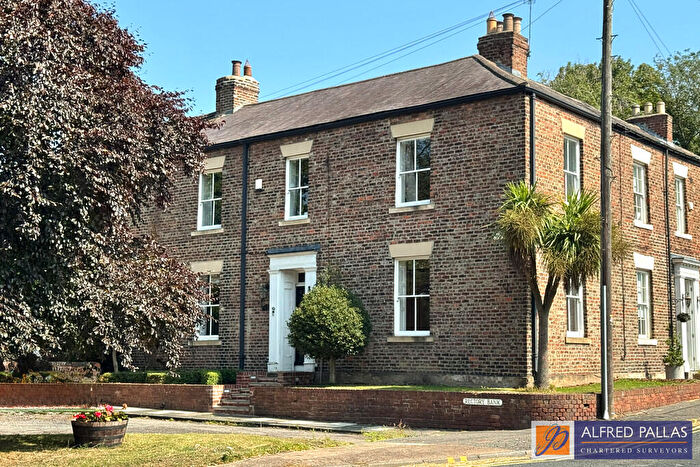
Houses for sale & to rent in Boldon Colliery, East Boldon
House Prices in Boldon Colliery
Properties in Boldon Colliery have an average house price of £199,869.00 and had 125 Property Transactions within the last 3 years¹.
Boldon Colliery is an area in East Boldon, South Tyneside with 1,353 households², where the most expensive property was sold for £692,000.00.
Properties for sale in Boldon Colliery
Roads and Postcodes in Boldon Colliery
Navigate through our locations to find the location of your next house in Boldon Colliery, East Boldon for sale or to rent.
| Streets | Postcodes |
|---|---|
| Addison Road | NE36 0QY NE36 0QZ NE36 0RB NE36 0RD NE36 0RA |
| Alpine Grove | NE36 0NQ |
| Ascot Court | NE36 0DA |
| Ashby Villas | NE36 0AT |
| Aviemore Road | NE36 0ET |
| Avondale Gardens | NE36 0PR |
| Avondale Terrace | NE36 0PS |
| Beaufront Terrace | NE36 0PN |
| Boker Lane | NE36 0RY |
| Boldon Drive | NE36 0JD NE36 0JE NE36 0JF |
| Browns Buildings | NE36 0RE |
| Claremount Court | NE36 0NF |
| Coniston Grange | NE36 0EP |
| Dipe Lane | NE36 0PJ NE36 0PX NE36 0PW |
| Don Gardens | NE36 0QE |
| Don View | NE36 0JA NE36 0JB |
| Downhill Lane | NE36 0AX |
| Dunelm Drive | NE36 0HJ |
| Everest Grove | NE36 0NL |
| Gateshead Terrace | NE36 0QA |
| Glebe Farm Court | NE36 0DD |
| Grampian Grove | NE36 0NJ |
| Hall Gardens | NE36 0PU |
| Hall Green Manor | NE36 0PD |
| Hamilton Terrace | NE36 0PP |
| Hardie Drive | NE36 0HA NE36 0HB NE36 0JH NE36 0JJ NE36 0JL |
| Harton View | NE36 0QS |
| Hillside | NE36 0JG |
| Hindmarch Drive | NE36 0HE NE36 0HF NE36 0HG NE36 0HQ NE36 0HX NE36 0HH |
| Hylton Lane | NE36 0PY NE36 0AS |
| Langdale Way | NE36 0UE NE36 0UF NE36 0UG |
| Lawn Drive | NE36 0AZ |
| Lilburn Close | NE36 0TZ |
| Mansfield Court | NE36 0PL |
| Mill View | NE36 0PT |
| Mill Villas | NE36 0QU |
| Nevis Grove | NE36 0NH |
| Newcastle Road | NE36 0BJ NE36 0BG NE36 0BQ |
| Owen Drive | NE36 0HN NE36 0HP NE36 0HU NE36 0HW |
| Pennine Grove | NE36 0NN |
| Prospect Gardens | NE36 0JQ |
| Rectory Bank | NE36 0QF NE36 0QQ |
| Rectory Green | NE36 0QD |
| Rectory Terrace | NE36 0QB |
| Redcar Terrace | NE36 0PZ |
| Rosemount Court | NE36 0NG |
| Shepherds Way | NE36 0QT |
| Snowdon Grove | NE36 0NW |
| St Nicholas Road | NE36 0QR |
| St Nicholas Terrace | NE36 0QX |
| St Nicholas View | NE36 0RF |
| St Nicholas Villas | NE36 0QH |
| Stewart Drive | NE36 0HD |
| The Fairways | NE36 0PG |
| The Folly | NE36 0QL NE36 0QN |
| Three Rivers Court | NE36 0QJ |
| Tracey Avenue | NE36 0HT |
| Wheatley Gardens | NE36 0HY NE36 0HZ |
| Wilson Drive | NE36 0HL |
| NE36 0BL NE36 0QW NE36 0QP |
Transport near Boldon Colliery
-
Sunderland Station
-
Heworth Station
-
Manors Station
-
Newcastle Station
-
Dunston Station
-
Chester-Le-Street Station
-
Seaham Station
-
MetroCentre Station
- FAQ
- Price Paid By Year
- Property Type Price
Frequently asked questions about Boldon Colliery
What is the average price for a property for sale in Boldon Colliery?
The average price for a property for sale in Boldon Colliery is £199,869. This amount is 14% lower than the average price in East Boldon. There are 356 property listings for sale in Boldon Colliery.
What streets have the most expensive properties for sale in Boldon Colliery?
The streets with the most expensive properties for sale in Boldon Colliery are Dipe Lane at an average of £503,000, Langdale Way at an average of £421,583 and Ashby Villas at an average of £406,500.
What streets have the most affordable properties for sale in Boldon Colliery?
The streets with the most affordable properties for sale in Boldon Colliery are Rectory Bank at an average of £113,920, Pennine Grove at an average of £127,500 and Hamilton Terrace at an average of £129,999.
Which train stations are available in or near Boldon Colliery?
Some of the train stations available in or near Boldon Colliery are Sunderland, Heworth and Manors.
Property Price Paid in Boldon Colliery by Year
The average sold property price by year was:
| Year | Average Sold Price | Price Change |
Sold Properties
|
|---|---|---|---|
| 2025 | £214,440 | 17% |
35 Properties |
| 2024 | £177,586 | -21% |
49 Properties |
| 2023 | £214,060 | -1% |
41 Properties |
| 2022 | £215,302 | 8% |
41 Properties |
| 2021 | £198,616 | 16% |
49 Properties |
| 2020 | £166,556 | 14% |
41 Properties |
| 2019 | £143,694 | -13% |
48 Properties |
| 2018 | £162,061 | -0,5% |
39 Properties |
| 2017 | £162,804 | -5% |
48 Properties |
| 2016 | £171,257 | 6% |
54 Properties |
| 2015 | £160,398 | 1% |
39 Properties |
| 2014 | £159,552 | -13% |
41 Properties |
| 2013 | £179,830 | 22% |
25 Properties |
| 2012 | £140,530 | -20% |
30 Properties |
| 2011 | £168,310 | -5% |
25 Properties |
| 2010 | £177,394 | 7% |
29 Properties |
| 2009 | £164,998 | -14% |
18 Properties |
| 2008 | £187,498 | -4% |
27 Properties |
| 2007 | £194,992 | 12% |
56 Properties |
| 2006 | £171,868 | -11% |
60 Properties |
| 2005 | £190,447 | 13% |
36 Properties |
| 2004 | £165,726 | 10% |
65 Properties |
| 2003 | £149,904 | 26% |
42 Properties |
| 2002 | £111,508 | 26% |
55 Properties |
| 2001 | £82,246 | 15% |
34 Properties |
| 2000 | £69,507 | 3% |
48 Properties |
| 1999 | £67,301 | 18% |
43 Properties |
| 1998 | £55,101 | -10% |
32 Properties |
| 1997 | £60,618 | 12% |
41 Properties |
| 1996 | £53,051 | -15% |
27 Properties |
| 1995 | £60,996 | - |
30 Properties |
Property Price per Property Type in Boldon Colliery
Here you can find historic sold price data in order to help with your property search.
The average Property Paid Price for specific property types in the last three years are:
| Property Type | Average Sold Price | Sold Properties |
|---|---|---|
| Semi Detached House | £195,780.00 | 67 Semi Detached Houses |
| Detached House | £387,677.00 | 11 Detached Houses |
| Terraced House | £166,007.00 | 38 Terraced Houses |
| Flat | £143,733.00 | 9 Flats |

