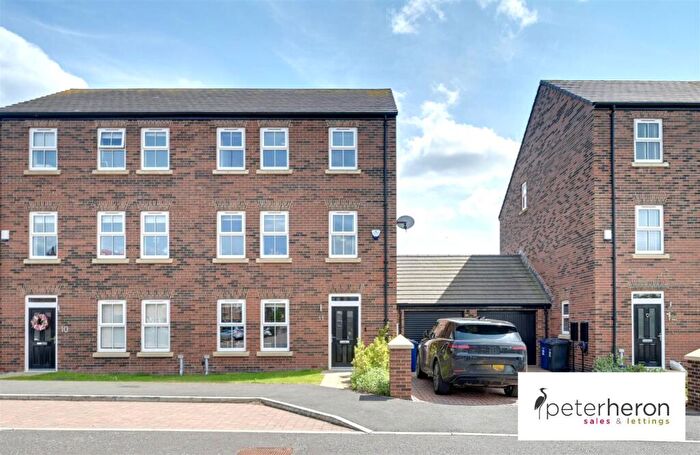
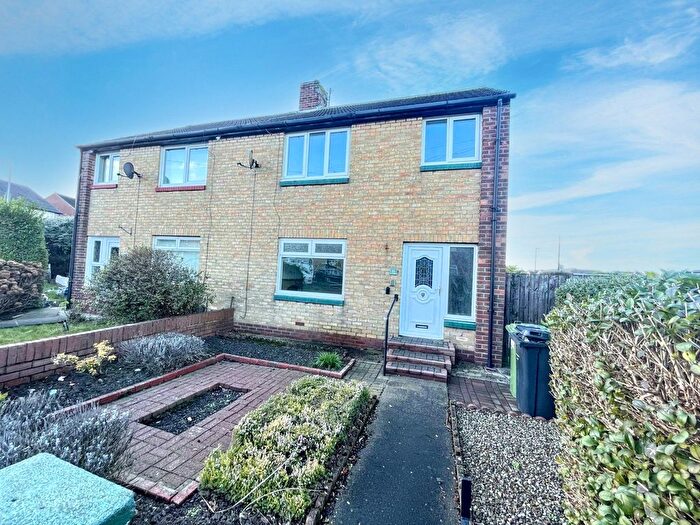
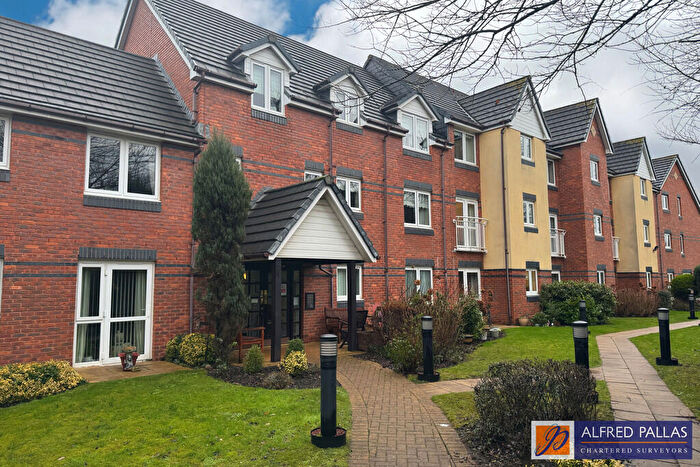
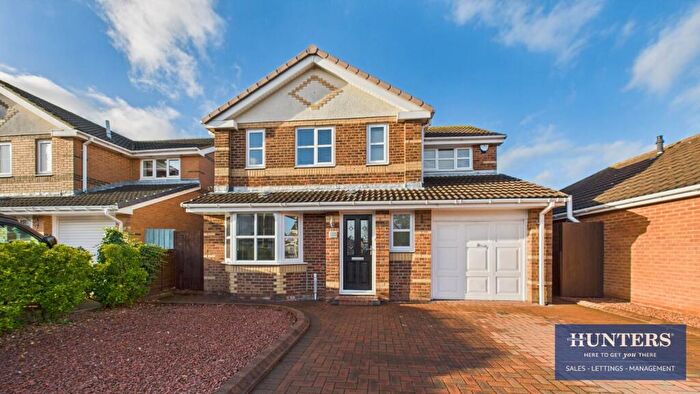
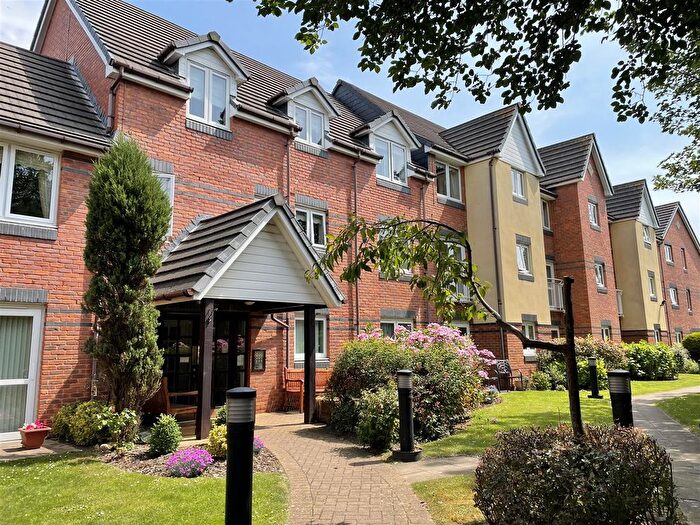
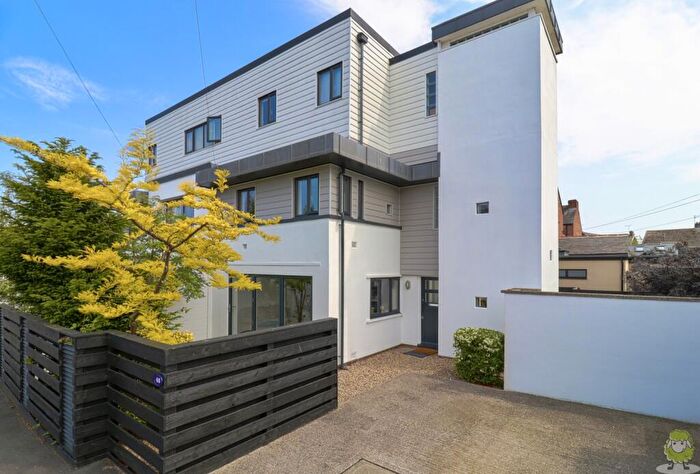
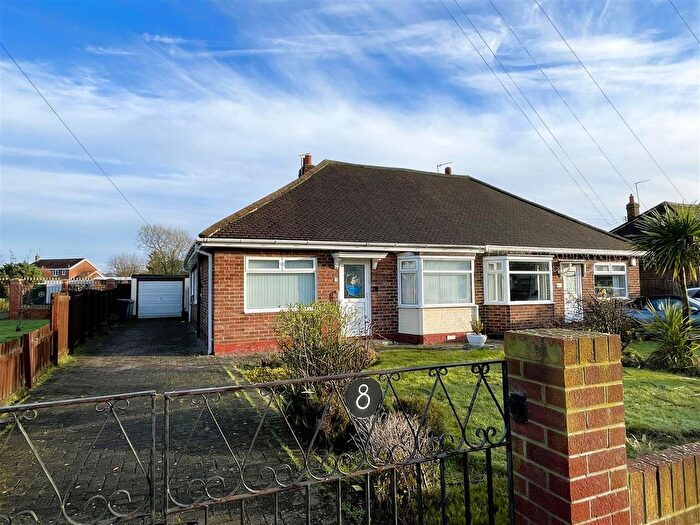
Houses for sale & to rent in Cleadon And East Boldon, East Boldon
House Prices in Cleadon And East Boldon
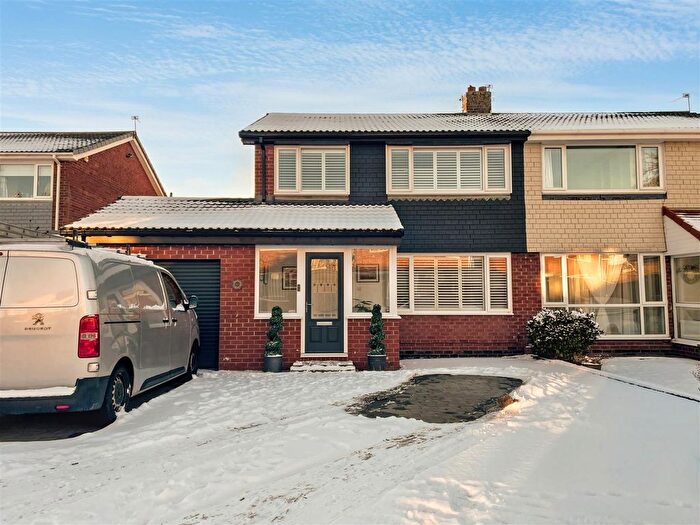
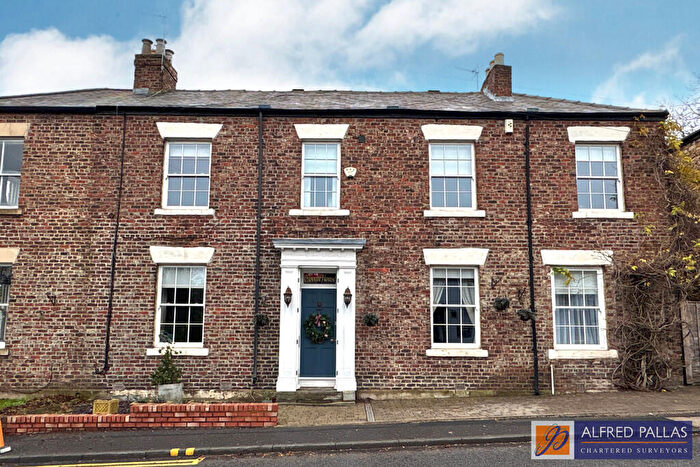
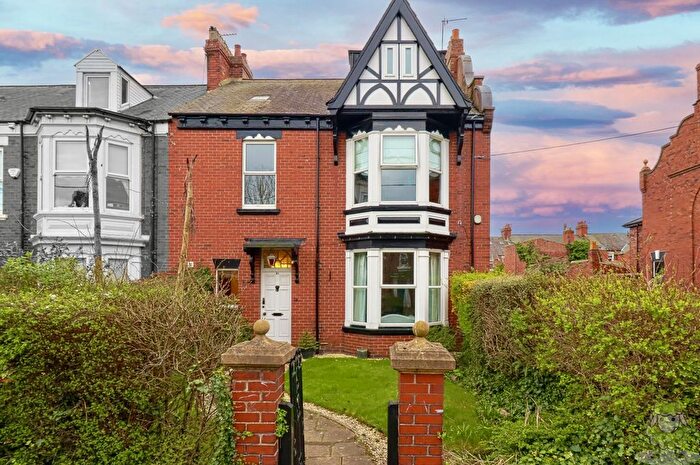
Properties in Cleadon And East Boldon have an average house price of £254,756.00 and had 198 Property Transactions within the last 3 years¹.
Cleadon And East Boldon is an area in East Boldon, South Tyneside with 1,642 households², where the most expensive property was sold for £757,000.00.
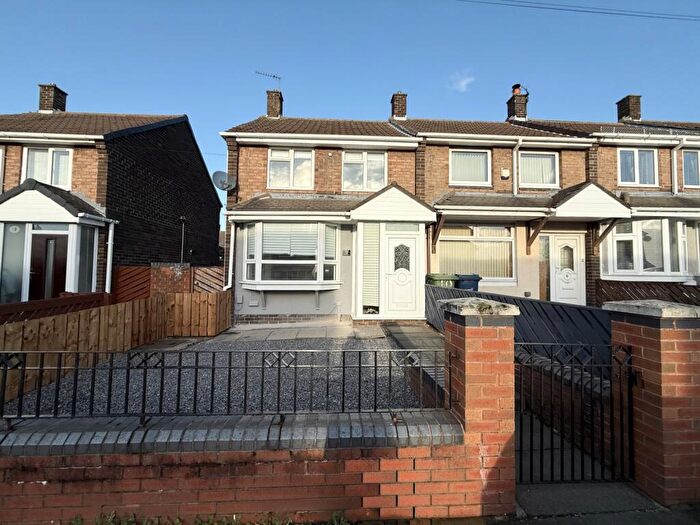
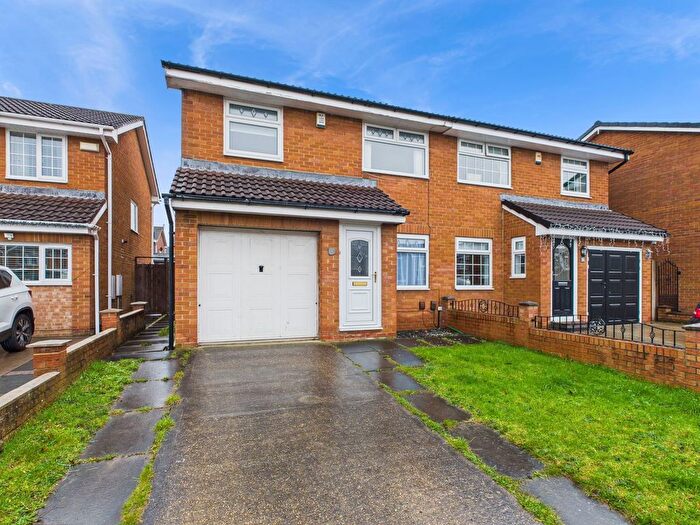
Properties for sale in Cleadon And East Boldon
Roads and Postcodes in Cleadon And East Boldon
Navigate through our locations to find the location of your next house in Cleadon And East Boldon, East Boldon for sale or to rent.
| Streets | Postcodes |
|---|---|
| Alison Drive | NE36 0SY |
| Ashbrooke Terrace | NE36 0TH NE36 0TJ |
| Ashleigh Villas | NE36 0LA |
| Baldwin Avenue | NE36 0EL |
| Beatrice Gardens | NE36 0DX |
| Beckenham Avenue | NE36 0EH NE36 0EQ |
| Beckenham Close | NE36 0EJ |
| Bede Terrace | NE36 0DZ |
| Belle Vue Lane | NE36 0AN |
| Belle Vue Villas | NE36 0SR |
| Borrowdale Close | NE36 0UH |
| Bowness Close | NE36 0UQ |
| Bridle Path | NE36 0AP NE36 0PA NE36 0PE NE36 0PF NE36 0PB |
| Burnham Grove | NE36 0DU |
| Burnside | NE36 0LS |
| Charlcote Crescent | NE36 0DT |
| Claremont Gardens | NE36 0LG |
| Cleadon Hill | NE34 8EG |
| Cleadon Lane | NE36 0AJ NE36 0BS |
| Cleadon Lane Industrial Estate | NE36 0AH |
| Coltere Avenue | NE36 0LR |
| Coulton Drive | NE36 0SZ |
| Crossways | NE36 0LP |
| Dipe Lane | NE36 0PH NE36 0PQ |
| Ferndale Avenue | NE36 0TQ |
| Ferndale Grove | NE36 0TG |
| Ferndale Lane | NE36 0TL |
| Front Street | NE36 0SA NE36 0SB NE36 0SD NE36 0SE NE36 0SF NE36 0SG NE36 0SH NE36 0SJ NE36 0SN NE36 0SQ NE36 0SW |
| Glencourse | NE36 0LW |
| Gordon Drive | NE36 0TD |
| Grange Terrace | NE36 0DW |
| Hiram Drive | NE36 0TA |
| Hunter Close | NE36 0TB |
| Kendal Drive | NE36 0UB |
| Langdale Way | NE36 0UA |
| Langholm Court | NE36 0JZ |
| Langholm Road | NE36 0ED NE36 0EE NE36 0EF |
| Lyndon Close | NE36 0NT |
| Lyndon Drive | NE36 0NU NE36 0NX |
| Lyndon Grove | NE36 0NP NE36 0NR NE36 0NS |
| Moor Lane | NE36 0AQ |
| Mundles Lane | NE36 0AW |
| Natley Avenue | NE36 0LY NE36 0LZ |
| North Lane | NE36 0EN |
| North Road | NE36 0DJ NE36 0DL |
| Patterdale Close | NE36 0UD |
| Prospect Terrace | NE36 0SU |
| Railway Cottages | NE36 0BW |
| Ravensbourne Avenue | NE36 0EG |
| Rydal Close | NE36 0UJ |
| Sandpiper View | NE36 0AR |
| Shotley Grove | NE36 0DB |
| Somerset Terrace | NE36 0TE |
| South Lane | NE36 0SP NE36 0SS NE36 0SX |
| St Bedes | NE36 0LE NE36 0LF |
| St Chads Villas | NE36 0DH |
| St Georges Terrace | NE36 0LU |
| St Johns Terrace | NE36 0LL NE36 0LN NE36 0LT |
| St Marys Terrace | NE36 0LX |
| Station Approach | NE36 0AB NE36 0AD |
| Station Road | NE36 0LD |
| Station Terrace | NE36 0LJ |
| Struan Terrace | NE36 0EA |
| Sunderland Road | NE36 0NA NE36 0NB NE36 0BT |
| The Grange | NE36 0RG |
| The Hawthorns | NE36 0DP NE36 0DS |
| The Orchard | NE36 0ST |
| The Terrace | NE36 0LQ |
| Tile Shed Lane | NE36 0BP |
| Tileshed Crossing | NE36 0BN |
| Victoria Terrace | NE36 0RS |
| West Farm | NE36 0DQ |
| Western Terrace | NE36 0RU NE36 0RX |
| Whitburn Road | NE36 0AF |
| Whitburn Terrace | NE36 0TF |
| Willow Bank Court | NE36 0ER |
| Yellow Leas Farm | NE36 0SL |
| NE34 8DZ NE36 0BX |
Transport near Cleadon And East Boldon
-
Sunderland Station
-
Heworth Station
-
Manors Station
-
Newcastle Station
-
Seaham Station
-
Dunston Station
-
Chester-Le-Street Station
-
MetroCentre Station
- FAQ
- Price Paid By Year
- Property Type Price
Frequently asked questions about Cleadon And East Boldon
What is the average price for a property for sale in Cleadon And East Boldon?
The average price for a property for sale in Cleadon And East Boldon is £254,756. This amount is 10% higher than the average price in East Boldon. There are 1,814 property listings for sale in Cleadon And East Boldon.
What streets have the most expensive properties for sale in Cleadon And East Boldon?
The streets with the most expensive properties for sale in Cleadon And East Boldon are The Terrace at an average of £515,000, Hiram Drive at an average of £486,666 and North Road at an average of £477,000.
What streets have the most affordable properties for sale in Cleadon And East Boldon?
The streets with the most affordable properties for sale in Cleadon And East Boldon are Willow Bank Court at an average of £61,171, Langholm Court at an average of £62,777 and Shotley Grove at an average of £165,570.
Which train stations are available in or near Cleadon And East Boldon?
Some of the train stations available in or near Cleadon And East Boldon are Sunderland, Heworth and Manors.
Property Price Paid in Cleadon And East Boldon by Year
The average sold property price by year was:
| Year | Average Sold Price | Price Change |
Sold Properties
|
|---|---|---|---|
| 2025 | £283,190 | 10% |
32 Properties |
| 2024 | £254,987 | 3% |
55 Properties |
| 2023 | £247,445 | 1% |
45 Properties |
| 2022 | £245,763 | -1% |
66 Properties |
| 2021 | £247,772 | -3% |
90 Properties |
| 2020 | £255,400 | 6% |
71 Properties |
| 2019 | £241,036 | -9% |
70 Properties |
| 2018 | £262,823 | 18% |
55 Properties |
| 2017 | £216,142 | -7% |
62 Properties |
| 2016 | £231,280 | 11% |
76 Properties |
| 2015 | £205,854 | -1% |
59 Properties |
| 2014 | £207,917 | 3% |
57 Properties |
| 2013 | £202,001 | 16% |
74 Properties |
| 2012 | £170,165 | -12% |
48 Properties |
| 2011 | £191,345 | 5% |
40 Properties |
| 2010 | £182,121 | 2% |
44 Properties |
| 2009 | £178,255 | -14% |
43 Properties |
| 2008 | £203,454 | -3% |
41 Properties |
| 2007 | £209,872 | -5% |
142 Properties |
| 2006 | £220,549 | 13% |
103 Properties |
| 2005 | £192,573 | 6% |
78 Properties |
| 2004 | £180,152 | 14% |
77 Properties |
| 2003 | £154,177 | 24% |
100 Properties |
| 2002 | £117,283 | 9% |
99 Properties |
| 2001 | £107,237 | 9% |
103 Properties |
| 2000 | £97,344 | 23% |
106 Properties |
| 1999 | £74,902 | -1% |
80 Properties |
| 1998 | £75,990 | 6% |
69 Properties |
| 1997 | £71,398 | 9% |
100 Properties |
| 1996 | £64,950 | -2% |
63 Properties |
| 1995 | £66,522 | - |
39 Properties |
Property Price per Property Type in Cleadon And East Boldon
Here you can find historic sold price data in order to help with your property search.
The average Property Paid Price for specific property types in the last three years are:
| Property Type | Average Sold Price | Sold Properties |
|---|---|---|
| Semi Detached House | £269,790.00 | 66 Semi Detached Houses |
| Detached House | £442,720.00 | 27 Detached Houses |
| Terraced House | £246,728.00 | 70 Terraced Houses |
| Flat | £97,462.00 | 35 Flats |

