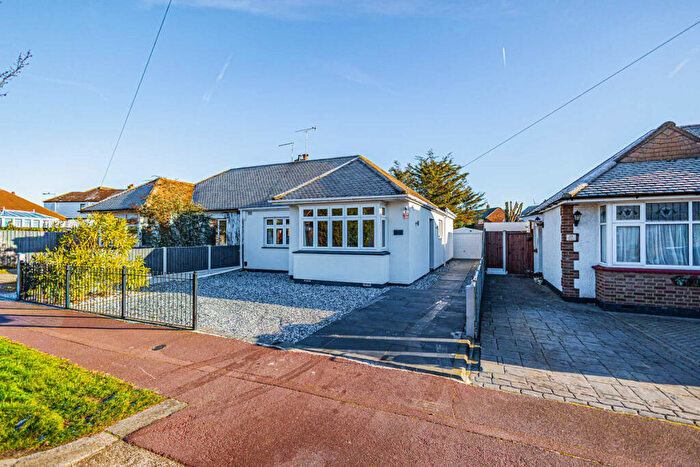
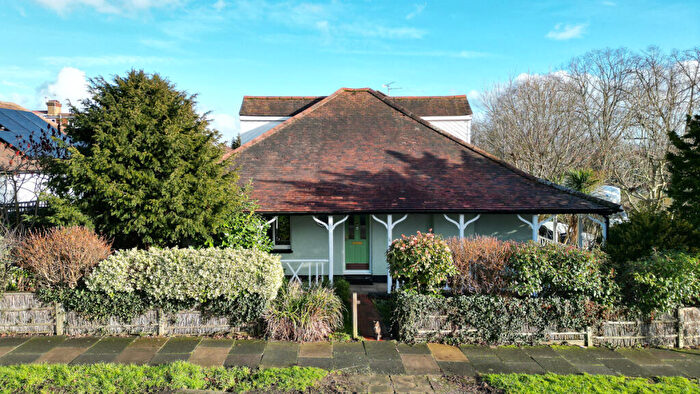
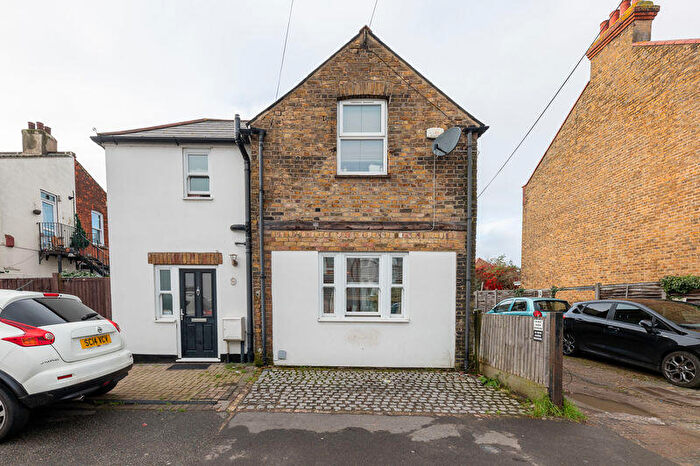
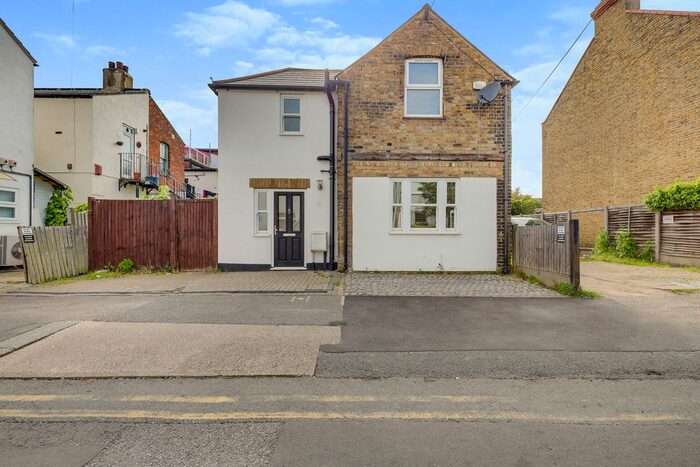
Houses for sale & to rent in Blenheim Park, Leigh-on-sea
House Prices in Blenheim Park
Properties in Blenheim Park have an average house price of £397,731.00 and had 269 Property Transactions within the last 3 years¹.
Blenheim Park is an area in Leigh-on-sea, Southend-on-Sea with 2,880 households², where the most expensive property was sold for £950,000.00.
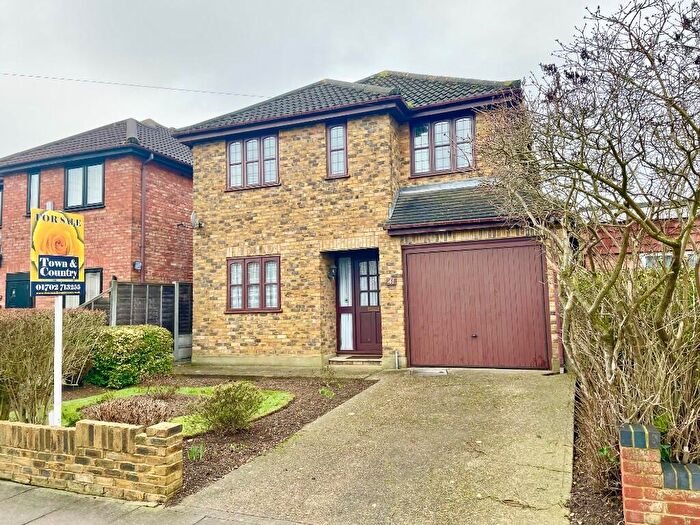
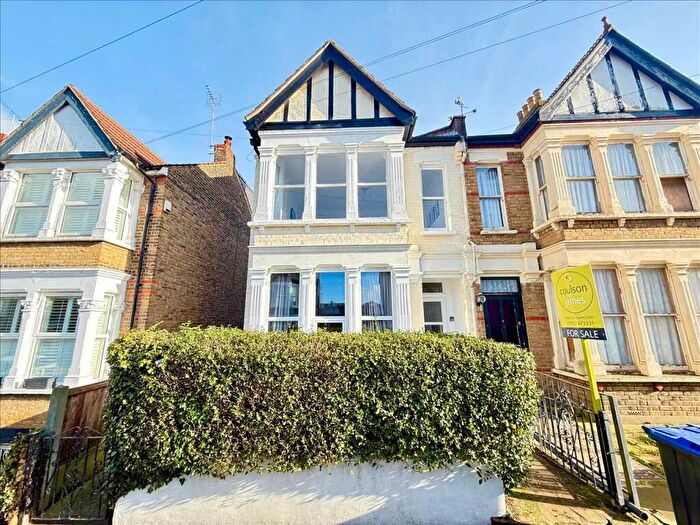
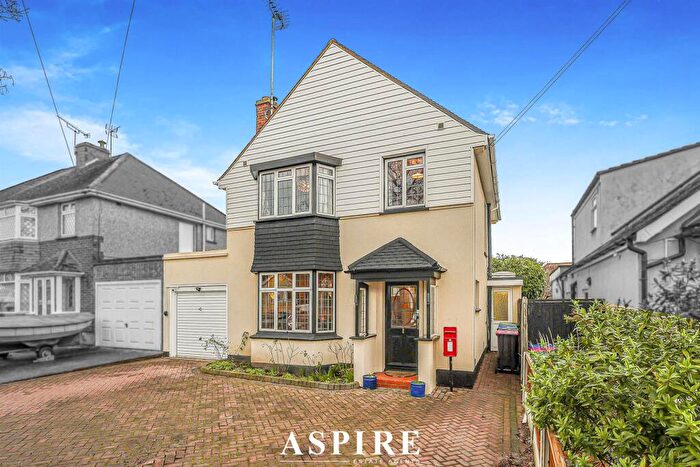
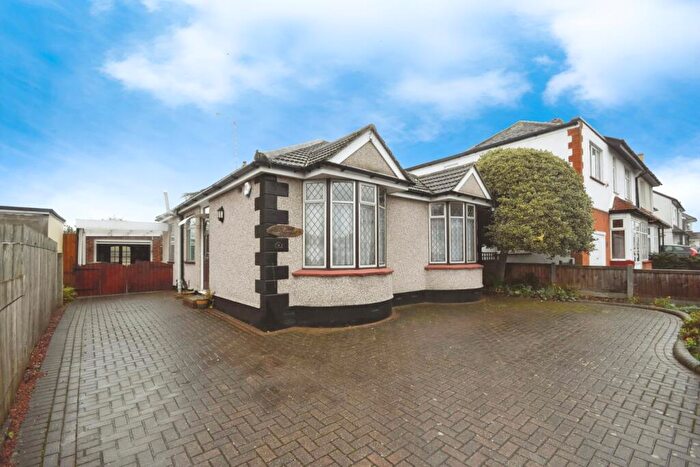
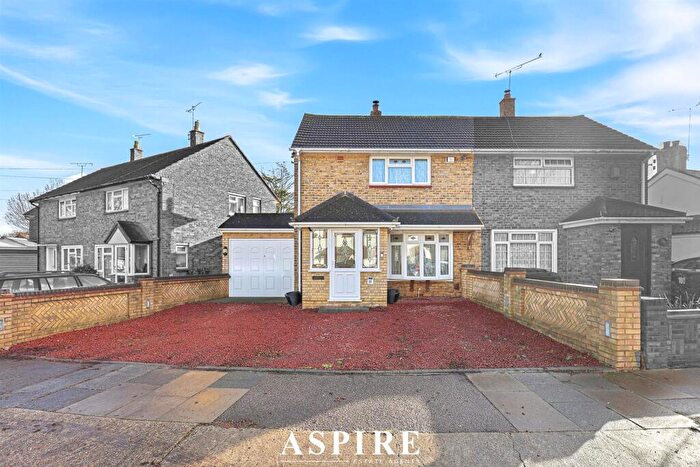
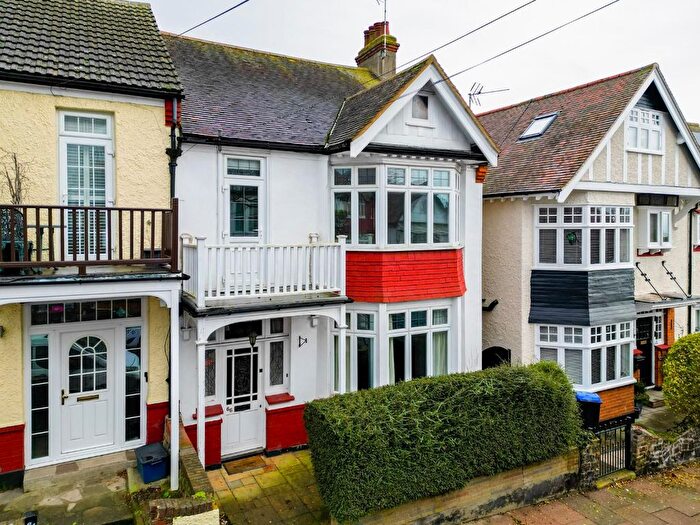
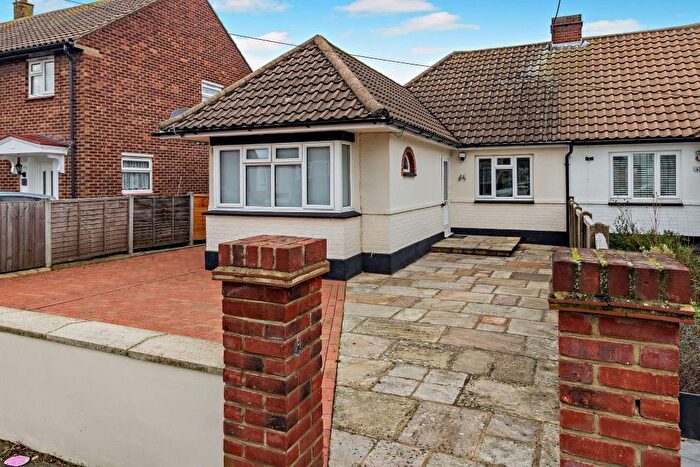
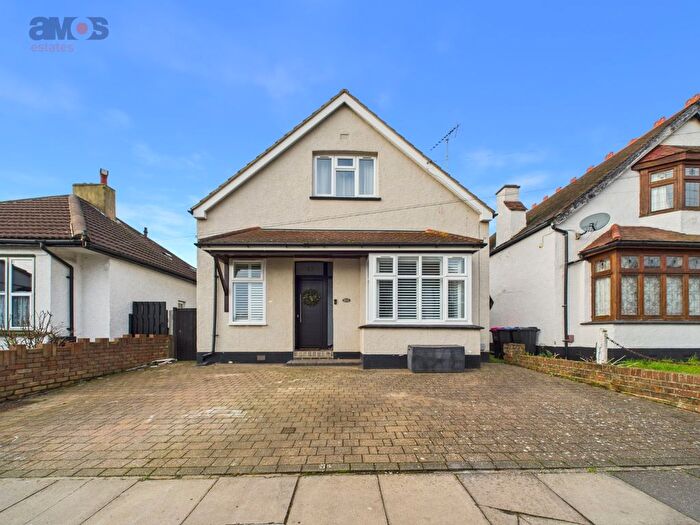
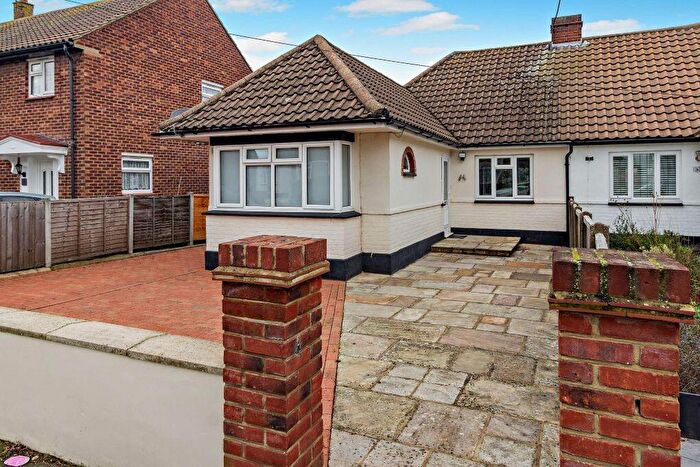
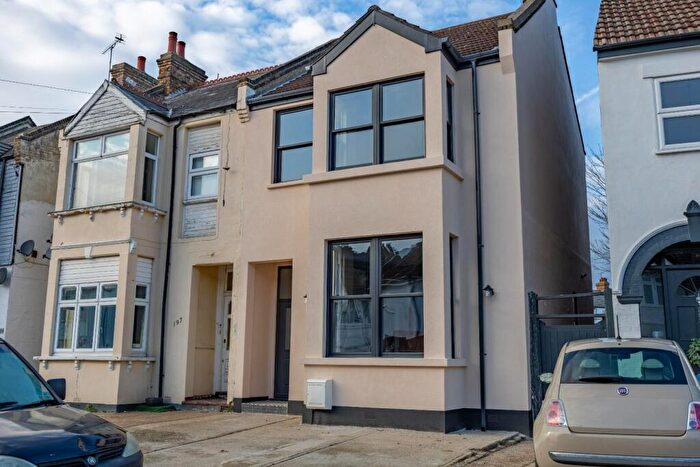
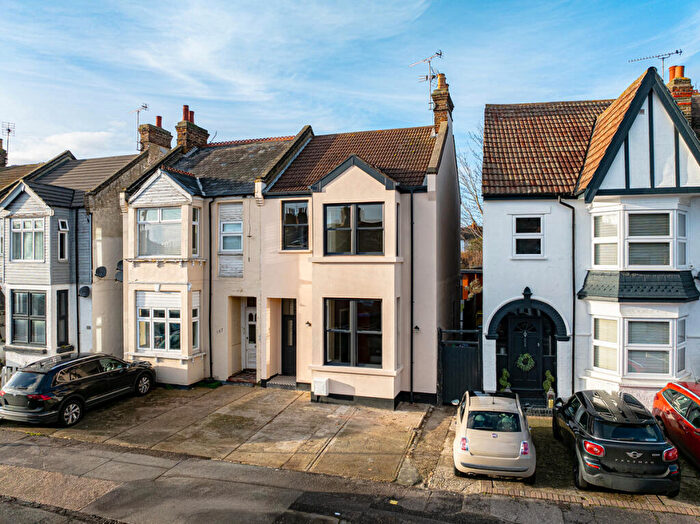
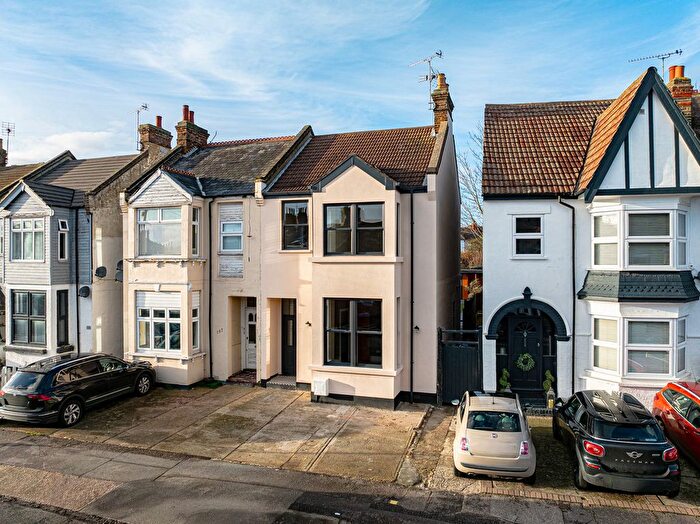
Properties for sale in Blenheim Park
Roads and Postcodes in Blenheim Park
Navigate through our locations to find the location of your next house in Blenheim Park, Leigh-on-sea for sale or to rent.
| Streets | Postcodes |
|---|---|
| Albany Court | SS9 3FG SS9 3FJ SS9 3FN |
| Albany Mews | SS9 3FP |
| Avondale Drive | SS9 4HN |
| Birchwood Drive | SS9 3LD SS9 3LE |
| Blenheim Chase | SS9 3BT SS9 3BX SS9 3HG SS9 3HH SS9 3HJ SS9 3HL SS9 3HQ |
| Blenheim Crescent | SS9 3DT SS9 3DU SS9 3DX |
| Blenheim Mews | SS9 3DZ |
| Blenheim Park Close | SS9 4AR |
| Broomfield Avenue | SS9 4BJ SS9 4BL |
| Cheltenham Drive | SS9 3EH SS9 3EQ |
| Cricketfield Grove | SS9 3EJ SS9 3EL |
| Danbury Close | SS9 4BD |
| Darlinghurst Grove | SS9 3LF SS9 3LG |
| Eastwood Road North | SS9 4BT SS9 4BY |
| Ellenbrook Close | SS9 3DY |
| Elmsleigh Drive | SS9 3DN SS9 3DP SS9 4JJ SS9 4JQ SS9 4JR |
| Essex Gardens | SS9 4HG |
| Fillebrook Avenue | SS9 3NS SS9 3NT |
| Fostal Close | SS9 4HB |
| Glenbervie Drive | SS9 3JT SS9 3JU |
| Grange Park Drive | SS9 3JZ |
| Grasmead Avenue | SS9 3LA |
| Greenacre Mews | SS9 3EW |
| Harridge Close | SS9 4HD |
| Harridge Road | SS9 4HA SS9 4HE |
| Hawthorns | SS9 4JT |
| Highbank Close | SS9 4BZ |
| Highwood Close | SS9 4AS |
| Howards Close | SS9 3GA |
| Hurst Way | SS9 4BG |
| Juniper Road | SS9 4BQ |
| Kathleen Drive | SS9 3EN |
| Kent Avenue | SS9 3HE |
| Leighview Drive | SS9 4HH SS9 4HQ |
| Lindisfarne Avenue | SS9 3NR |
| London Road | SS9 3JB SS9 3JE SS9 3JJ SS9 3JP SS9 3JY SS9 3LB SS9 3LH SS9 3LJ SS9 3LL SS9 3LQ SS9 3JD SS9 3JL |
| Madeira Avenue | SS9 3EA SS9 3EB |
| Manchester Drive | SS9 3EU SS9 3EX SS9 3EY SS9 3EZ SS9 3HP SS9 3HR SS9 3HS |
| Merryfield | SS9 4HL |
| Merryfield Approach | SS9 4HJ |
| Mountdale Gardens | SS9 4AA SS9 4AB SS9 4AE SS9 4AJ SS9 4AP SS9 4AT SS9 4AU SS9 4AW |
| Nelson Road | SS9 3HU SS9 3HX SS9 3FL |
| Norfolk Avenue | SS9 3HA |
| Oakview Close | SS9 4JN |
| Olivia Drive | SS9 3EF SS9 3EG |
| Pavilion Drive | SS9 3JR SS9 3JS |
| Picketts Avenue | SS9 4HF SS9 4HW |
| Picketts Close | SS9 4HP |
| Randolph Close | SS9 4HU SS9 4DW |
| Recreation Avenue | SS9 3JX |
| Sandhurst Close | SS9 4AN |
| Sandhurst Crescent | SS9 4AL |
| Scarborough Drive | SS9 3ED SS9 3EE |
| School Way | SS9 4HX |
| Stonehill Close | SS9 4AZ |
| Stonehill Road | SS9 4AX SS9 4AY SS9 4BB |
| Suffolk Avenue | SS9 3HD SS9 3HF |
| Surrey Avenue | SS9 3HB |
| Thistley Close | SS9 4BH |
| Thornhill | SS9 4JS |
| Tiptree Close | SS9 4BA |
| Treecot Drive | SS9 4AF SS9 4AG |
| Treelawn Drive | SS9 4AQ |
| Treelawn Gardens | SS9 4AH |
| Winchcombe Close | SS9 3BU |
| Windsor Close | SS9 4EA |
| Woodcote Road | SS9 3NP |
Transport near Blenheim Park
-
Chalkwell Station
-
Leigh-On-Sea Station
-
Westcliff Station
-
Prittlewell Station
-
Southend Airport Station
-
Southend Victoria Station
-
Southend Central Station
-
Rochford Station
- FAQ
- Price Paid By Year
- Property Type Price
Frequently asked questions about Blenheim Park
What is the average price for a property for sale in Blenheim Park?
The average price for a property for sale in Blenheim Park is £397,731. This amount is 8% lower than the average price in Leigh-on-sea. There are 3,270 property listings for sale in Blenheim Park.
What streets have the most expensive properties for sale in Blenheim Park?
The streets with the most expensive properties for sale in Blenheim Park are Fillebrook Avenue at an average of £727,545, Woodcote Road at an average of £677,614 and Scarborough Drive at an average of £594,225.
What streets have the most affordable properties for sale in Blenheim Park?
The streets with the most affordable properties for sale in Blenheim Park are Albany Mews at an average of £195,150, Albany Court at an average of £239,318 and Suffolk Avenue at an average of £250,185.
Which train stations are available in or near Blenheim Park?
Some of the train stations available in or near Blenheim Park are Chalkwell, Leigh-On-Sea and Westcliff.
Property Price Paid in Blenheim Park by Year
The average sold property price by year was:
| Year | Average Sold Price | Price Change |
Sold Properties
|
|---|---|---|---|
| 2025 | £413,144 | 10% |
92 Properties |
| 2024 | £373,806 | -12% |
112 Properties |
| 2023 | £417,142 | 8% |
65 Properties |
| 2022 | £383,753 | -1% |
127 Properties |
| 2021 | £388,631 | 11% |
160 Properties |
| 2020 | £343,969 | -1% |
117 Properties |
| 2019 | £348,451 | 7% |
112 Properties |
| 2018 | £325,521 | -2% |
133 Properties |
| 2017 | £330,667 | 20% |
112 Properties |
| 2016 | £265,464 | -4% |
167 Properties |
| 2015 | £275,122 | 14% |
127 Properties |
| 2014 | £236,996 | 14% |
112 Properties |
| 2013 | £204,052 | -1% |
110 Properties |
| 2012 | £206,204 | -1% |
105 Properties |
| 2011 | £209,125 | 1% |
100 Properties |
| 2010 | £207,420 | 7% |
94 Properties |
| 2009 | £192,828 | -2% |
82 Properties |
| 2008 | £197,400 | -5% |
66 Properties |
| 2007 | £206,804 | 3% |
141 Properties |
| 2006 | £200,926 | 7% |
151 Properties |
| 2005 | £186,666 | 4% |
100 Properties |
| 2004 | £179,067 | 11% |
140 Properties |
| 2003 | £158,745 | 14% |
130 Properties |
| 2002 | £136,659 | 19% |
160 Properties |
| 2001 | £111,034 | 14% |
144 Properties |
| 2000 | £95,552 | 14% |
130 Properties |
| 1999 | £82,011 | 16% |
146 Properties |
| 1998 | £69,239 | 8% |
137 Properties |
| 1997 | £63,372 | 11% |
143 Properties |
| 1996 | £56,508 | 1% |
132 Properties |
| 1995 | £56,214 | - |
97 Properties |
Property Price per Property Type in Blenheim Park
Here you can find historic sold price data in order to help with your property search.
The average Property Paid Price for specific property types in the last three years are:
| Property Type | Average Sold Price | Sold Properties |
|---|---|---|
| Semi Detached House | £424,623.00 | 112 Semi Detached Houses |
| Detached House | £547,713.00 | 48 Detached Houses |
| Terraced House | £364,116.00 | 60 Terraced Houses |
| Flat | £230,505.00 | 49 Flats |

