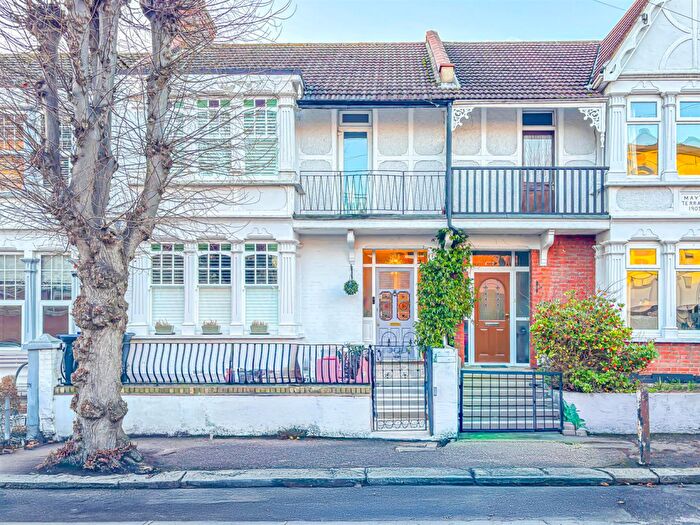
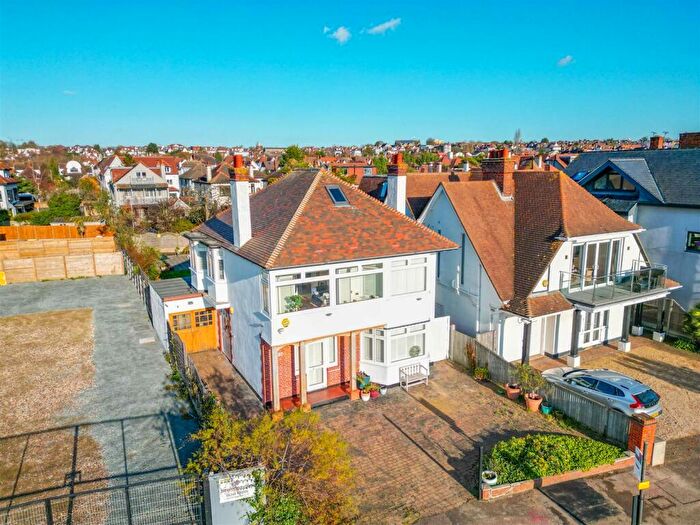
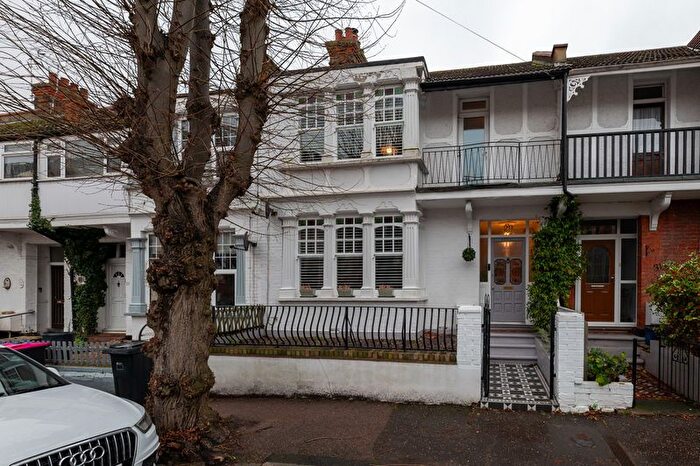
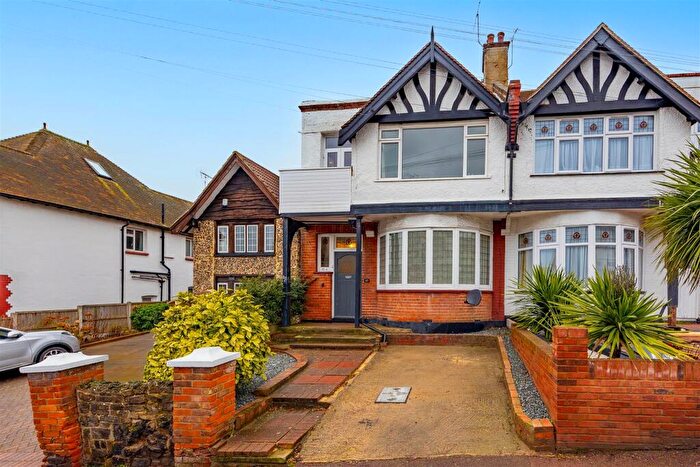
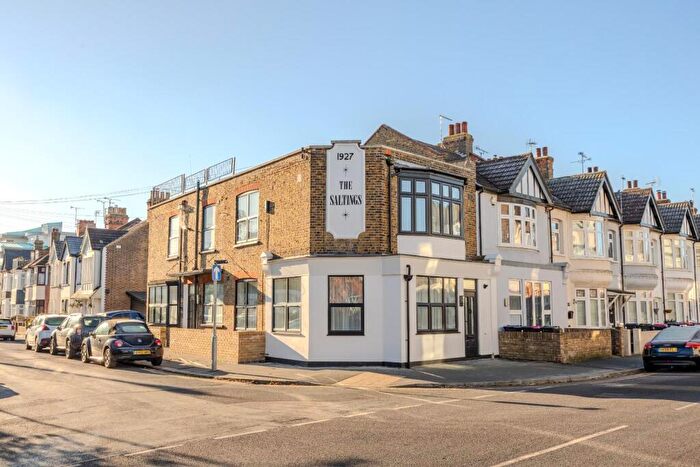
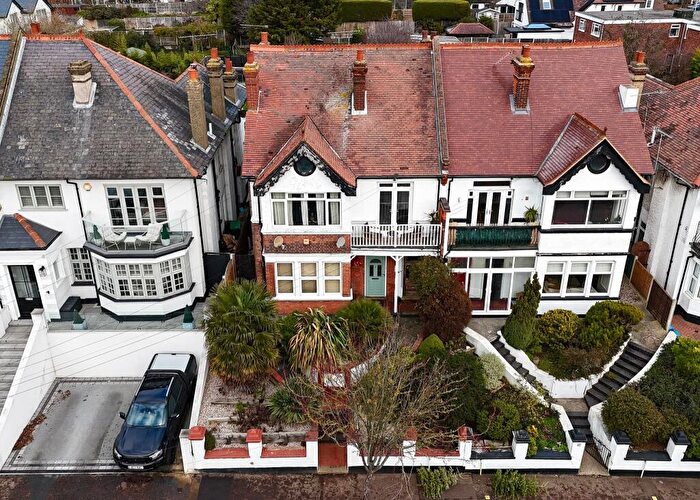
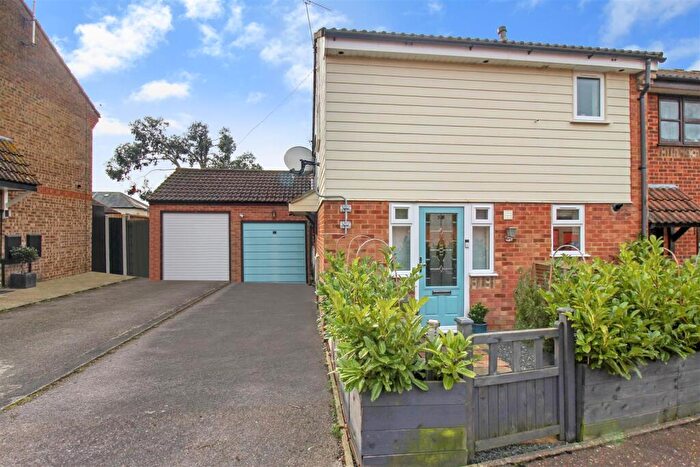
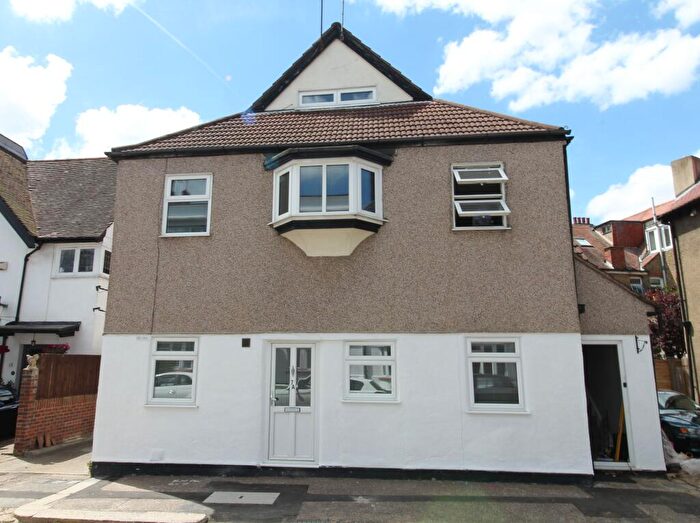
Houses for sale & to rent in Chalkwell, Leigh-on-sea
House Prices in Chalkwell
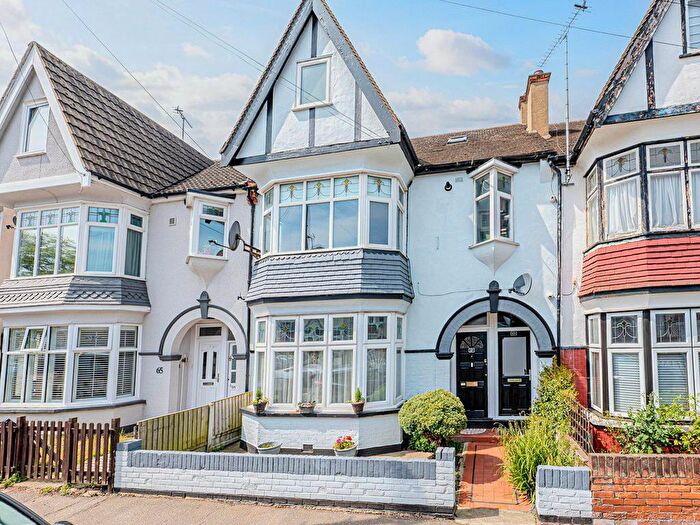
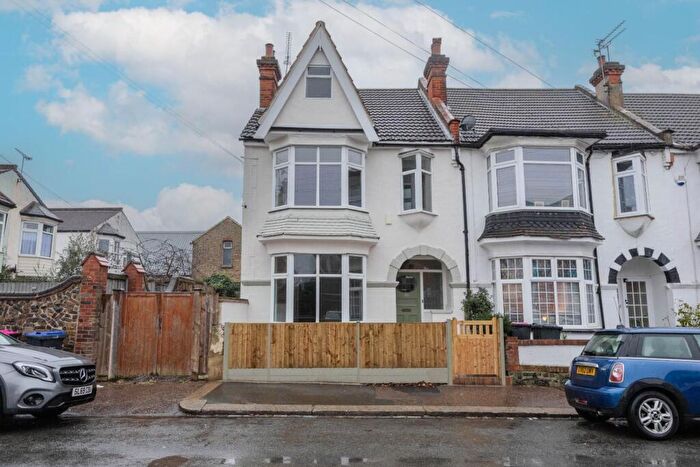
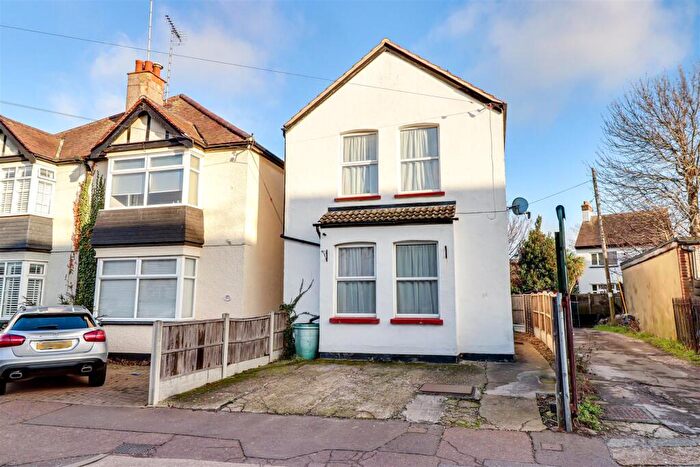
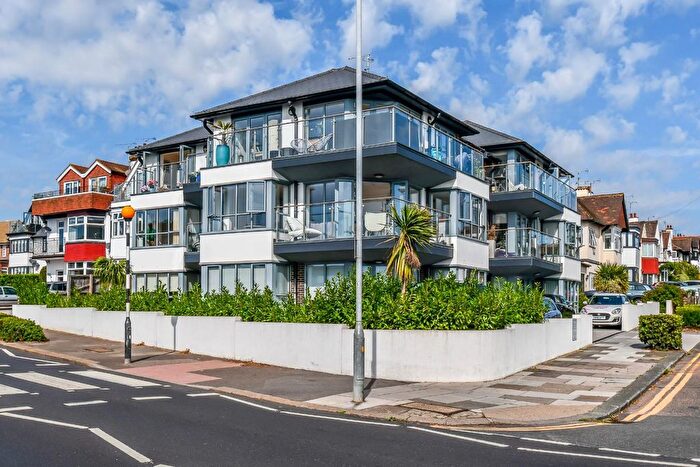
Properties in Chalkwell have an average house price of £480,311.00 and had 147 Property Transactions within the last 3 years¹.
Chalkwell is an area in Leigh-on-sea, Southend-on-Sea with 910 households², where the most expensive property was sold for £1,250,000.00.
Properties for sale in Chalkwell
Roads and Postcodes in Chalkwell
Navigate through our locations to find the location of your next house in Chalkwell, Leigh-on-sea for sale or to rent.
| Streets | Postcodes |
|---|---|
| Beach Avenue | SS9 1HB SS9 1HD SS9 1HP SS9 1HW |
| Cliff Avenue | SS9 1HF |
| Cliff Gardens | SS9 1EX SS9 1EY |
| Cliff Road | SS9 1HG SS9 1HJ SS9 1HL |
| Ensign Close | SS9 1FG |
| Fernleigh Drive | SS9 1LG SS9 1LH SS9 1LQ |
| Hillside Crescent | SS9 1HA SS9 1HH SS9 1HQ |
| Kent View Avenue | SS9 1HE |
| Lansdowne Avenue | SS9 1LJ SS9 1LL |
| Leigh Road | SS9 1BZ SS9 1JL SS9 1JN SS9 1JP SS9 1JR SS9 1JW SS9 1LD SS9 1LF SS9 1LE SS9 1LS |
| London Road | SS9 3NH SS9 3NJ SS9 3NL |
| Old Leigh Road | SS9 1LB SS9 1LT |
| Rockleigh Avenue | SS9 1LA |
| Sandleigh Road | SS9 1JT SS9 1JU SS9 1JX |
| Sunningdale Avenue | SS9 1JY SS9 1JZ |
| Uplands Road | SS9 1HN |
| Woodfield Park Drive | SS9 1LW |
| Woodfield Road | SS9 1EL SS9 1ER SS9 1ES SS9 1ET |
Transport near Chalkwell
-
Chalkwell Station
-
Westcliff Station
-
Leigh-On-Sea Station
-
Southend Victoria Station
-
Prittlewell Station
-
Southend Central Station
-
Southend Airport Station
-
Southend East Station
- FAQ
- Price Paid By Year
- Property Type Price
Frequently asked questions about Chalkwell
What is the average price for a property for sale in Chalkwell?
The average price for a property for sale in Chalkwell is £480,311. This amount is 10% higher than the average price in Leigh-on-sea. There are 2,679 property listings for sale in Chalkwell.
What streets have the most expensive properties for sale in Chalkwell?
The streets with the most expensive properties for sale in Chalkwell are Kent View Avenue at an average of £791,666, Cliff Avenue at an average of £642,441 and Sunningdale Avenue at an average of £612,500.
What streets have the most affordable properties for sale in Chalkwell?
The streets with the most affordable properties for sale in Chalkwell are Old Leigh Road at an average of £237,684, Ensign Close at an average of £287,150 and Uplands Road at an average of £302,500.
Which train stations are available in or near Chalkwell?
Some of the train stations available in or near Chalkwell are Chalkwell, Westcliff and Leigh-On-Sea.
Property Price Paid in Chalkwell by Year
The average sold property price by year was:
| Year | Average Sold Price | Price Change |
Sold Properties
|
|---|---|---|---|
| 2025 | £546,027 | 18% |
18 Properties |
| 2024 | £446,650 | -8% |
36 Properties |
| 2023 | £482,400 | 1% |
36 Properties |
| 2022 | £479,499 | 12% |
57 Properties |
| 2021 | £421,927 | -10% |
56 Properties |
| 2020 | £464,513 | 9% |
37 Properties |
| 2019 | £421,602 | -1% |
38 Properties |
| 2018 | £424,187 | 6% |
36 Properties |
| 2017 | £400,687 | 6% |
40 Properties |
| 2016 | £375,741 | 14% |
60 Properties |
| 2015 | £324,877 | 12% |
57 Properties |
| 2014 | £286,411 | 11% |
61 Properties |
| 2013 | £255,936 | 4% |
40 Properties |
| 2012 | £245,512 | -1% |
33 Properties |
| 2011 | £248,571 | -13% |
41 Properties |
| 2010 | £281,105 | 10% |
36 Properties |
| 2009 | £251,649 | -3% |
40 Properties |
| 2008 | £258,174 | 0,1% |
40 Properties |
| 2007 | £258,033 | 11% |
59 Properties |
| 2006 | £230,012 | 10% |
71 Properties |
| 2005 | £207,265 | -15% |
72 Properties |
| 2004 | £238,623 | 19% |
62 Properties |
| 2003 | £194,245 | 31% |
69 Properties |
| 2002 | £134,344 | 2% |
79 Properties |
| 2001 | £131,973 | 14% |
84 Properties |
| 2000 | £113,058 | 26% |
67 Properties |
| 1999 | £83,660 | 9% |
104 Properties |
| 1998 | £76,307 | 1% |
65 Properties |
| 1997 | £75,367 | 12% |
66 Properties |
| 1996 | £66,608 | 12% |
45 Properties |
| 1995 | £58,532 | - |
51 Properties |
Property Price per Property Type in Chalkwell
Here you can find historic sold price data in order to help with your property search.
The average Property Paid Price for specific property types in the last three years are:
| Property Type | Average Sold Price | Sold Properties |
|---|---|---|
| Semi Detached House | £601,841.00 | 32 Semi Detached Houses |
| Detached House | £785,017.00 | 19 Detached Houses |
| Terraced House | £508,284.00 | 44 Terraced Houses |
| Flat | £270,520.00 | 52 Flats |

