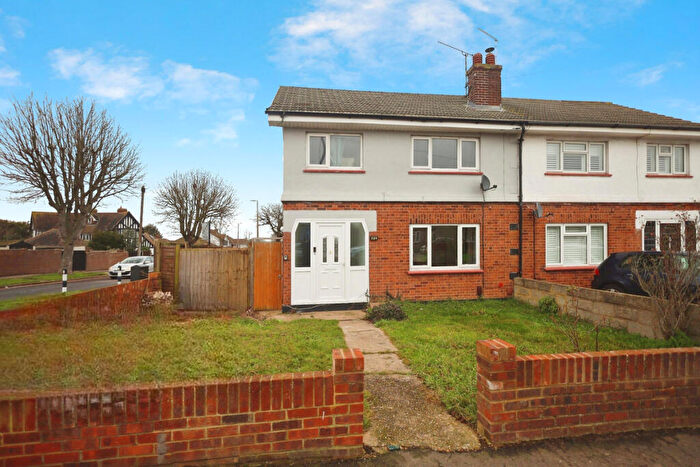
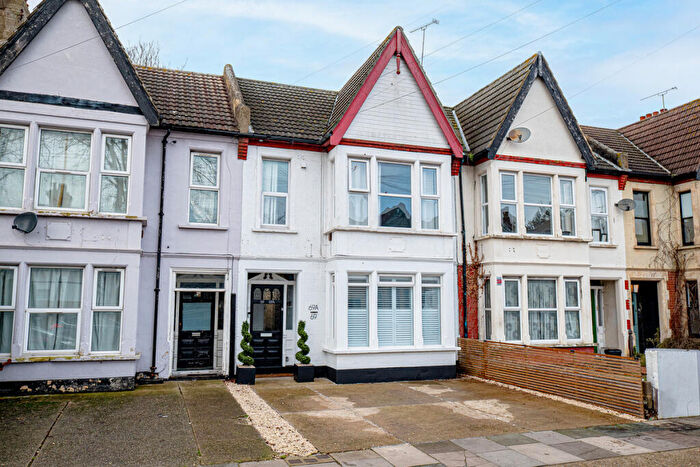
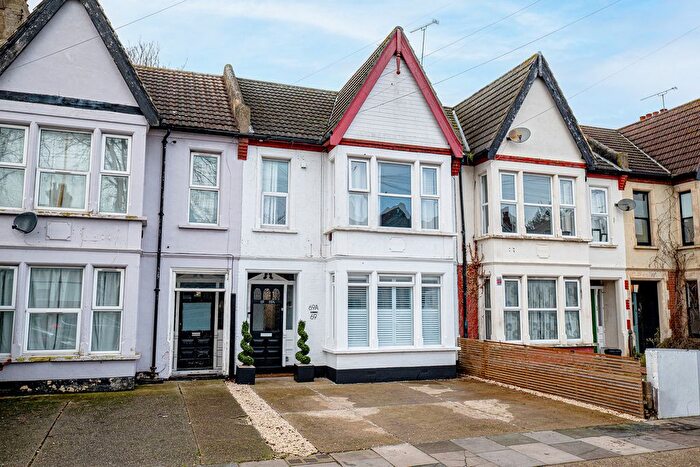
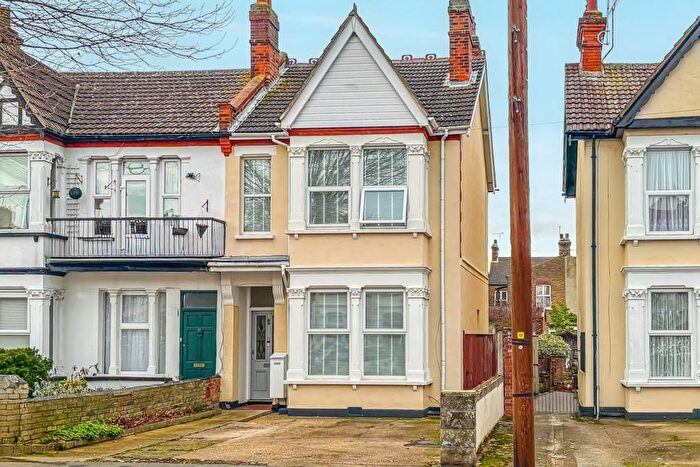
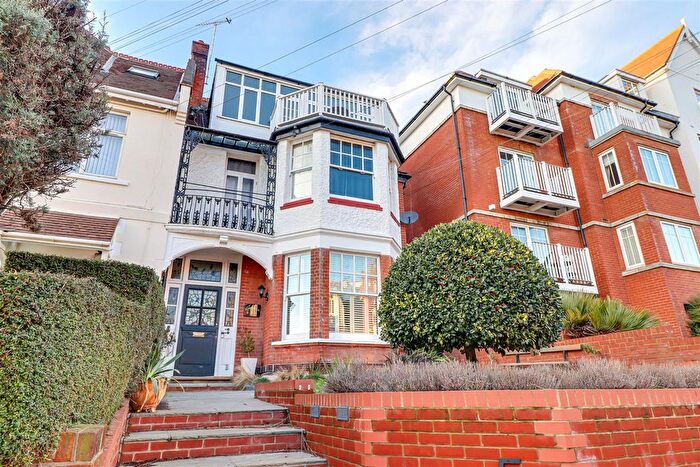
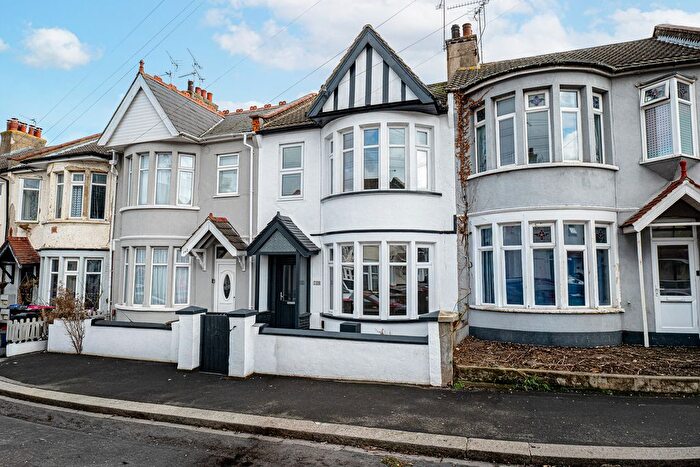
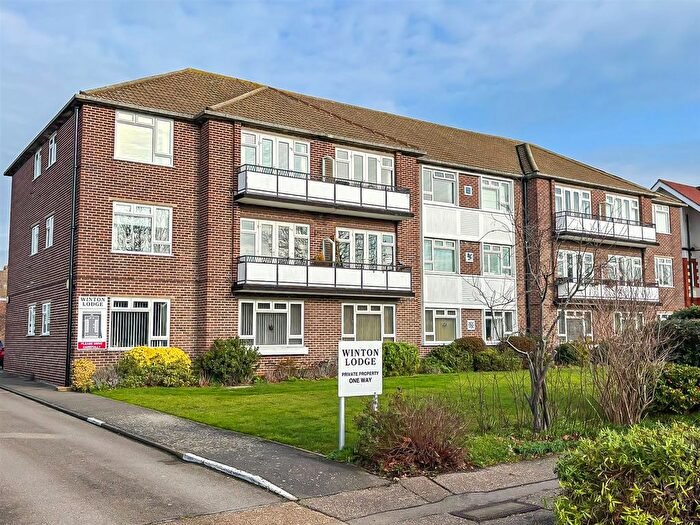
Houses for sale & to rent in Westborough, Westcliff-on-sea
House Prices in Westborough
Properties in Westborough have an average house price of £275,552.00 and had 513 Property Transactions within the last 3 years¹.
Westborough is an area in Westcliff-on-sea, Southend-on-Sea with 4,390 households², where the most expensive property was sold for £650,000.00.
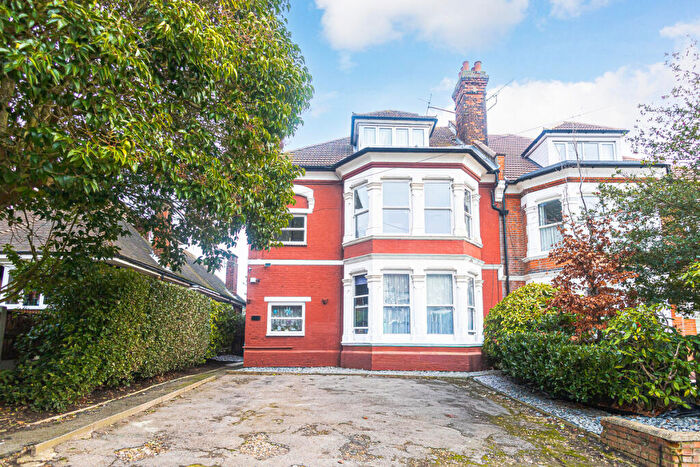
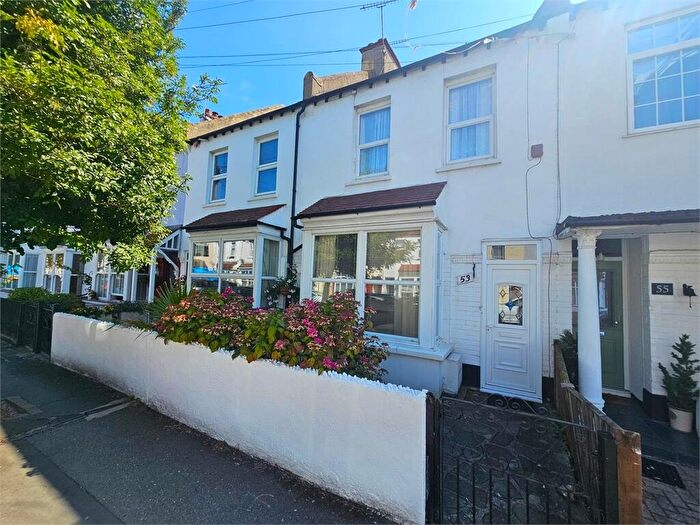
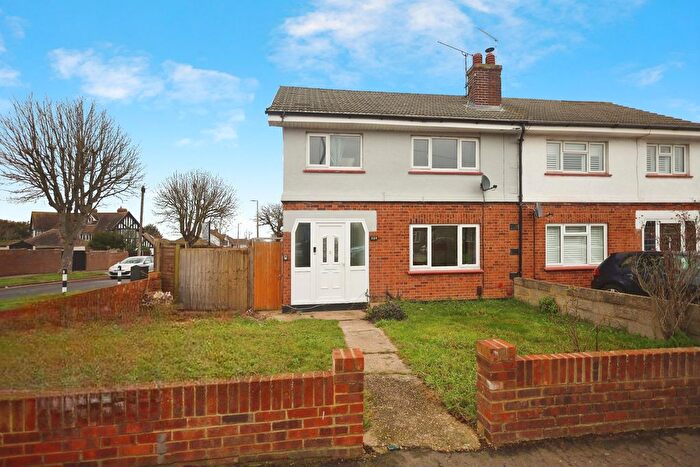
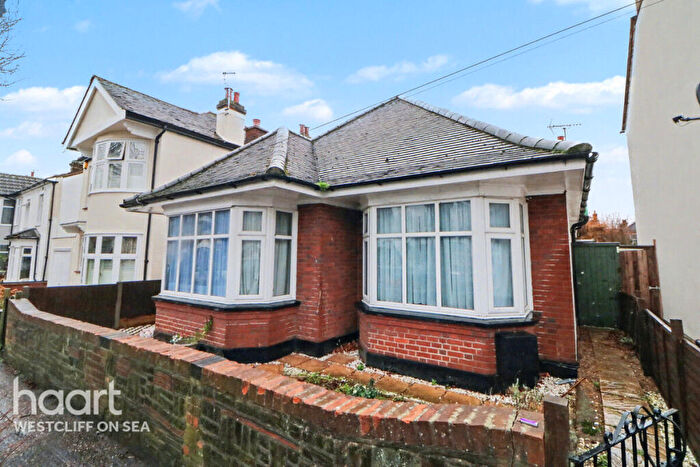
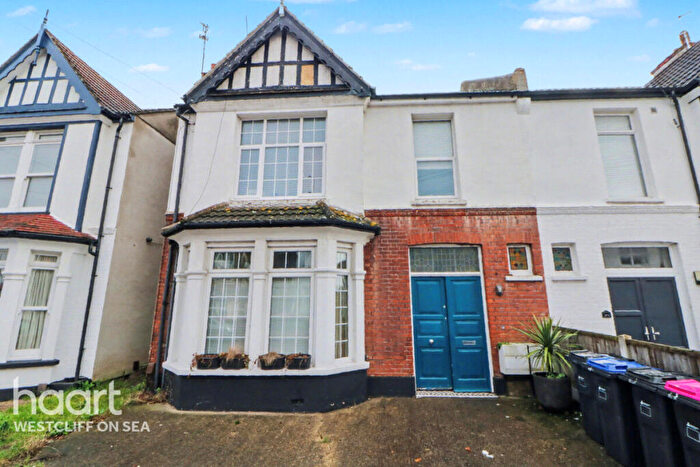
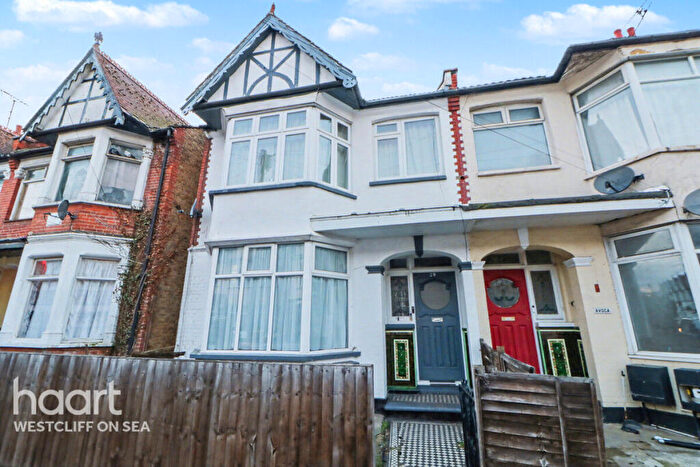
Properties for sale in Westborough
Roads and Postcodes in Westborough
Navigate through our locations to find the location of your next house in Westborough, Westcliff-on-sea for sale or to rent.
Transport near Westborough
-
Westcliff Station
-
Chalkwell Station
-
Prittlewell Station
-
Southend Victoria Station
-
Southend Central Station
-
Southend Airport Station
-
Southend East Station
-
Leigh-On-Sea Station
-
Rochford Station
- FAQ
- Price Paid By Year
- Property Type Price
Frequently asked questions about Westborough
What is the average price for a property for sale in Westborough?
The average price for a property for sale in Westborough is £275,552. This amount is 15% lower than the average price in Westcliff-on-sea. There are 4,030 property listings for sale in Westborough.
What streets have the most expensive properties for sale in Westborough?
The streets with the most expensive properties for sale in Westborough are Brookside Crescent at an average of £383,750, Southbourne Grove at an average of £345,685 and St Georges Park Avenue at an average of £336,386.
What streets have the most affordable properties for sale in Westborough?
The streets with the most affordable properties for sale in Westborough are Fielding Way at an average of £204,333, London Road at an average of £204,883 and West Road at an average of £216,035.
Which train stations are available in or near Westborough?
Some of the train stations available in or near Westborough are Westcliff, Chalkwell and Prittlewell.
Property Price Paid in Westborough by Year
The average sold property price by year was:
| Year | Average Sold Price | Price Change |
Sold Properties
|
|---|---|---|---|
| 2025 | £283,706 | 5% |
142 Properties |
| 2024 | £268,278 | -3% |
178 Properties |
| 2023 | £276,261 | -1% |
193 Properties |
| 2022 | £280,125 | 6% |
250 Properties |
| 2021 | £262,447 | 3% |
301 Properties |
| 2020 | £255,423 | 8% |
161 Properties |
| 2019 | £235,293 | 1% |
212 Properties |
| 2018 | £233,600 | 2% |
220 Properties |
| 2017 | £229,560 | 12% |
267 Properties |
| 2016 | £202,753 | 12% |
286 Properties |
| 2015 | £179,400 | 7% |
271 Properties |
| 2014 | £166,893 | 8% |
238 Properties |
| 2013 | £154,301 | 4% |
190 Properties |
| 2012 | £147,823 | 6% |
170 Properties |
| 2011 | £139,316 | -5% |
162 Properties |
| 2010 | £146,243 | 0,1% |
166 Properties |
| 2009 | £146,065 | -7% |
129 Properties |
| 2008 | £156,195 | -0,1% |
216 Properties |
| 2007 | £156,299 | 12% |
399 Properties |
| 2006 | £138,029 | 3% |
364 Properties |
| 2005 | £133,655 | 4% |
317 Properties |
| 2004 | £128,834 | 14% |
402 Properties |
| 2003 | £110,161 | 26% |
380 Properties |
| 2002 | £80,993 | 18% |
437 Properties |
| 2001 | £66,719 | 10% |
405 Properties |
| 2000 | £60,112 | 14% |
368 Properties |
| 1999 | £51,621 | 12% |
390 Properties |
| 1998 | £45,455 | -16% |
348 Properties |
| 1997 | £52,584 | 31% |
341 Properties |
| 1996 | £36,458 | 4% |
297 Properties |
| 1995 | £34,999 | - |
240 Properties |
Property Price per Property Type in Westborough
Here you can find historic sold price data in order to help with your property search.
The average Property Paid Price for specific property types in the last three years are:
| Property Type | Average Sold Price | Sold Properties |
|---|---|---|
| Flat | £195,517.00 | 236 Flats |
| Semi Detached House | £364,919.00 | 47 Semi Detached Houses |
| Detached House | £388,884.00 | 26 Detached Houses |
| Terraced House | £333,108.00 | 204 Terraced Houses |

