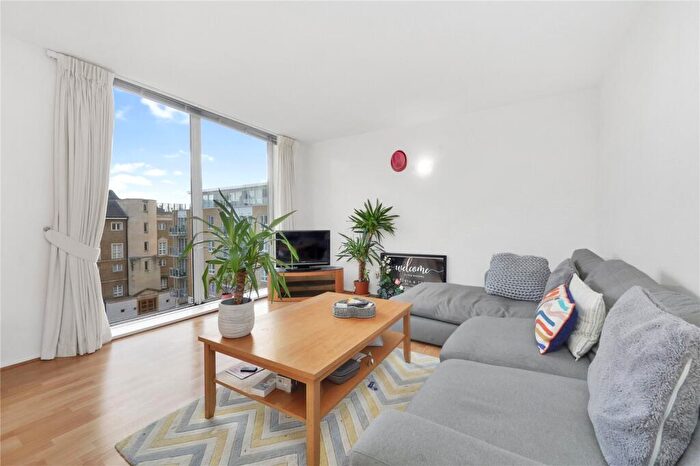
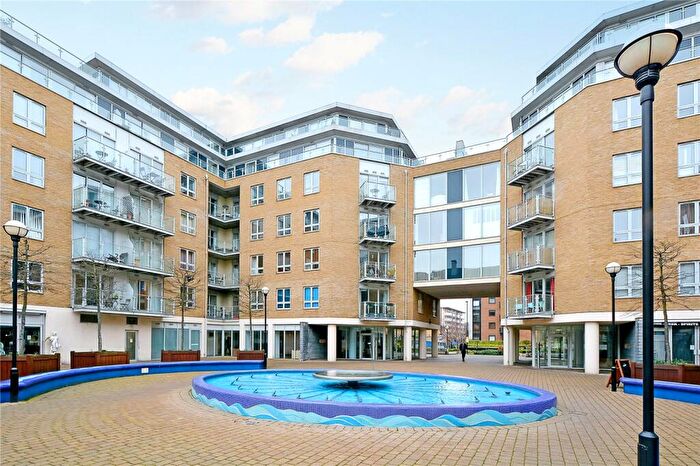
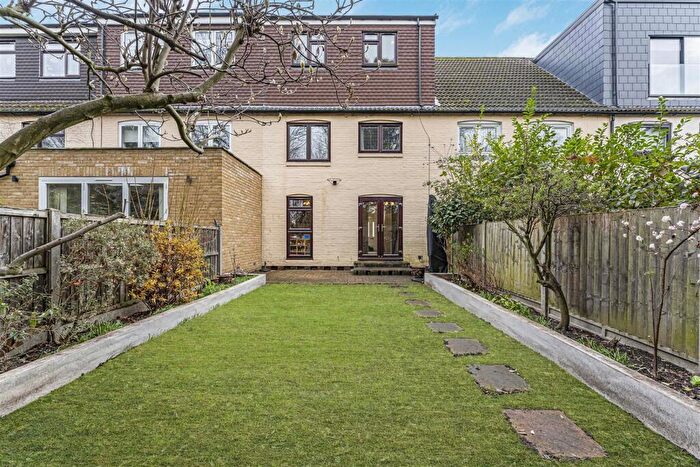
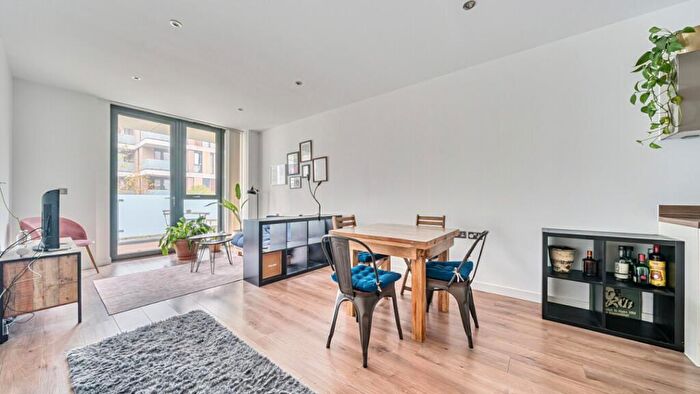
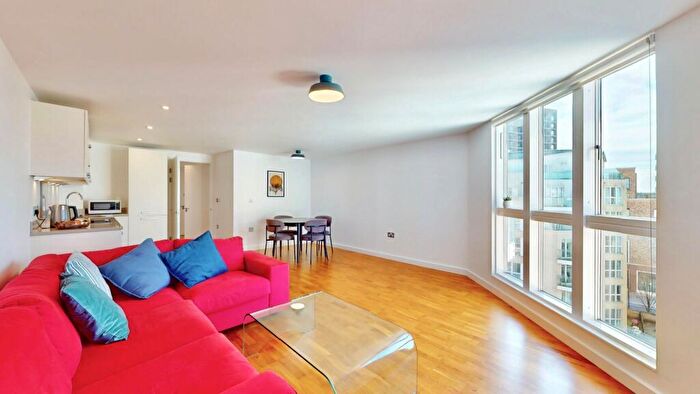
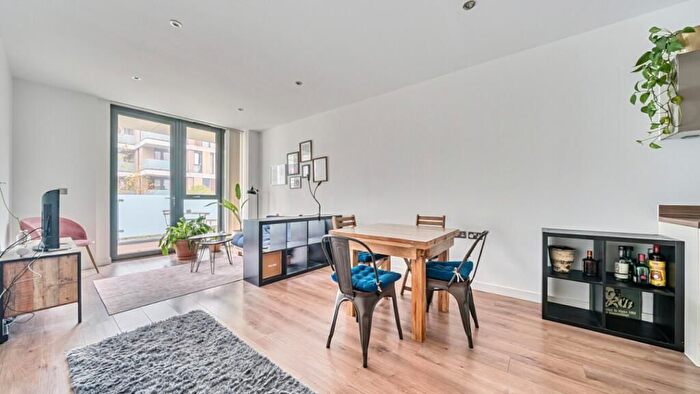
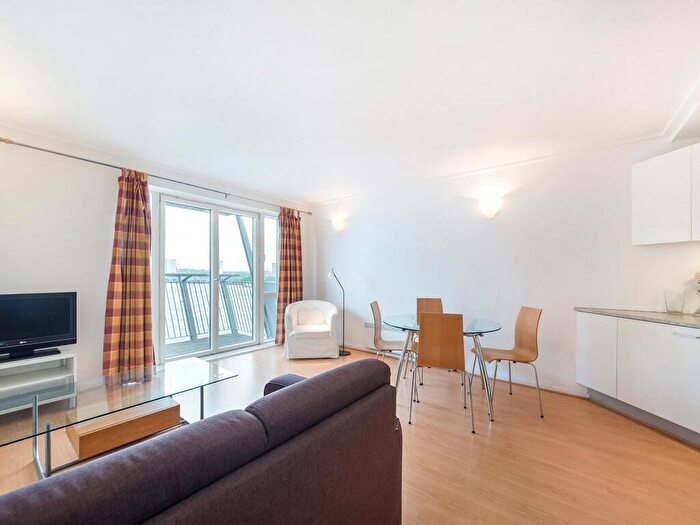
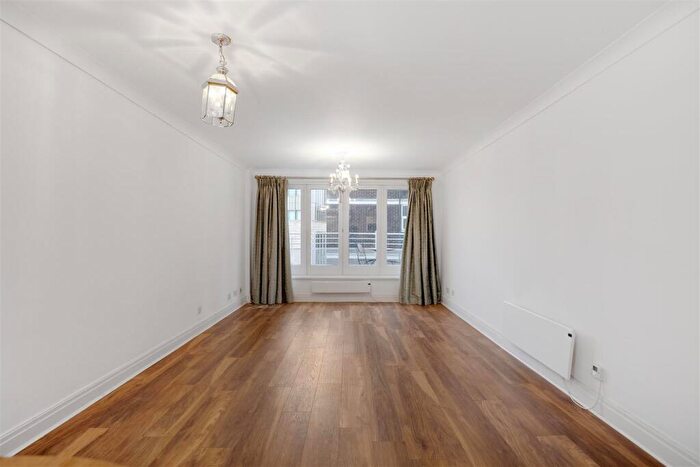
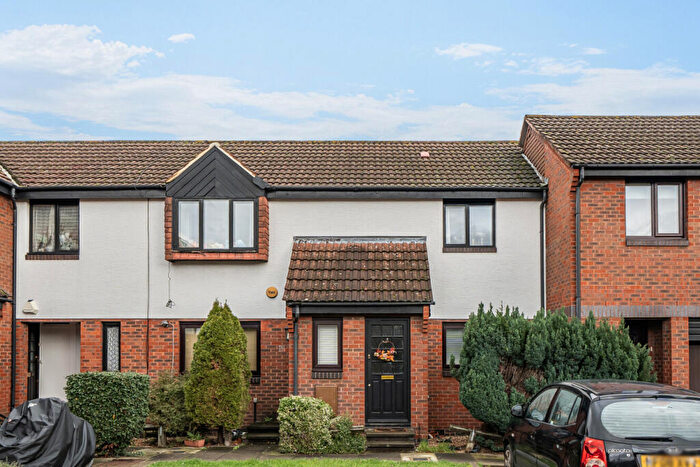
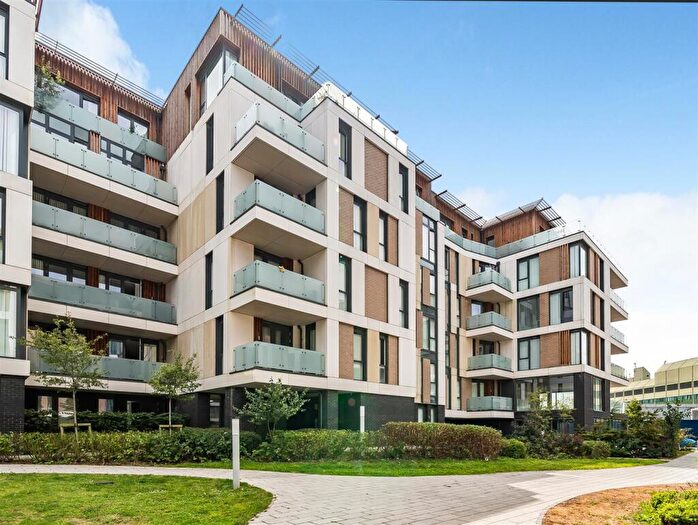
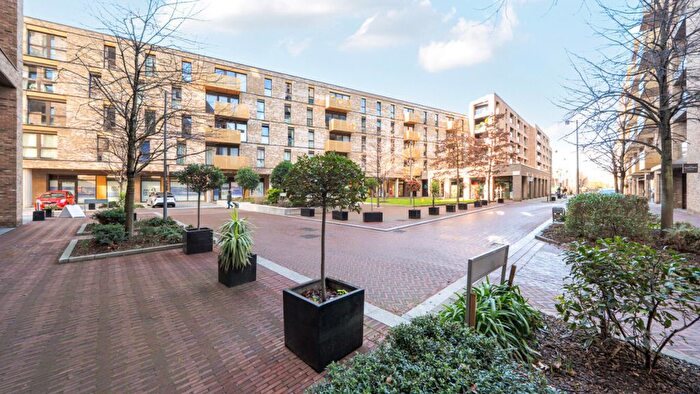
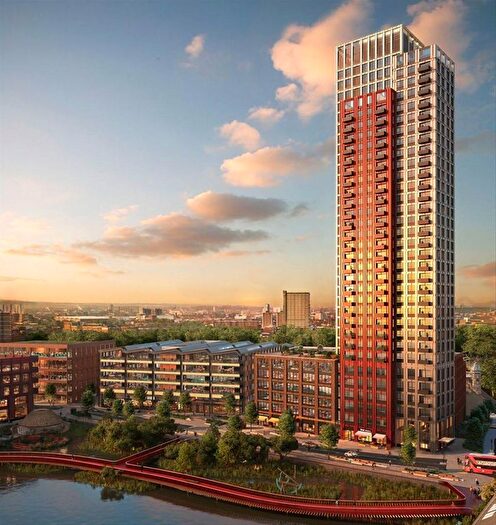
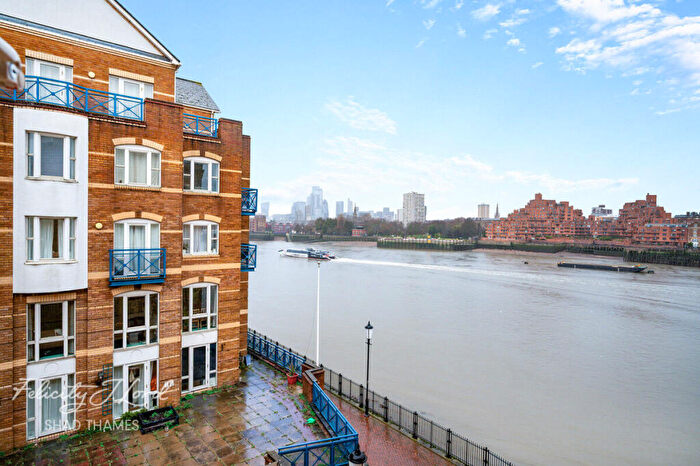
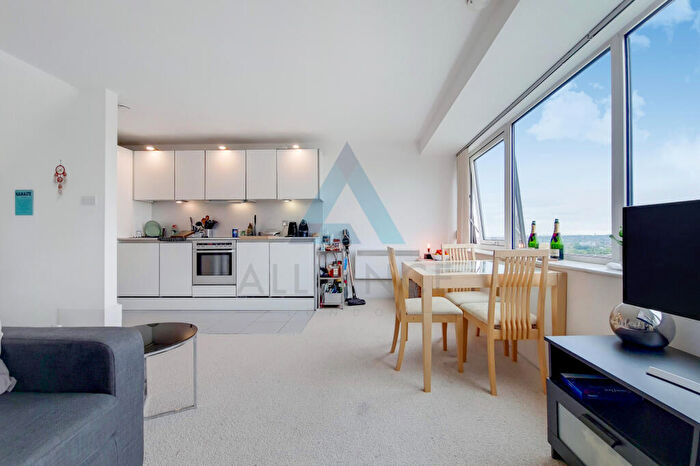
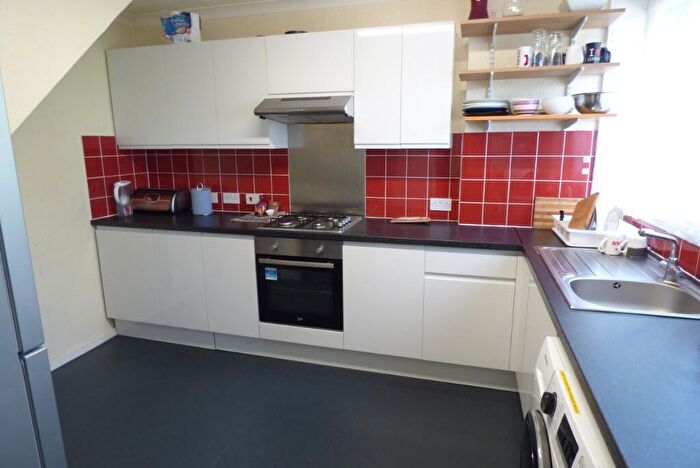
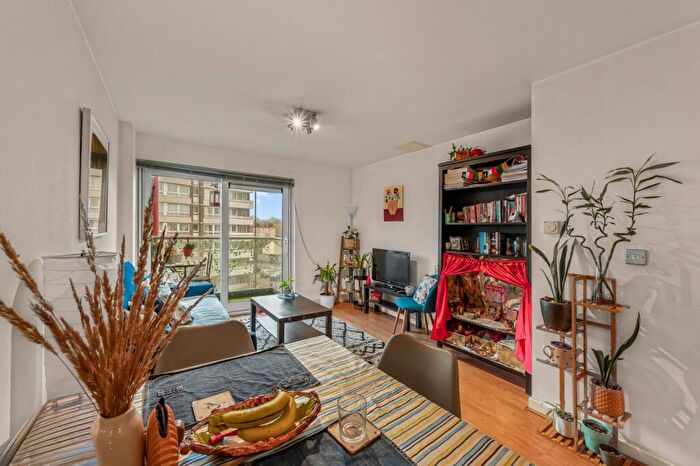
Houses for sale & to rent in Surrey Docks, London
House Prices in Surrey Docks
Properties in this part of Surrey Docks within London have an average house price of £533,719.00 and had 537 Property Transactions within the last 3 years¹. This area has 5,884 households² , where the most expensive property was sold for £1,300,000.00.
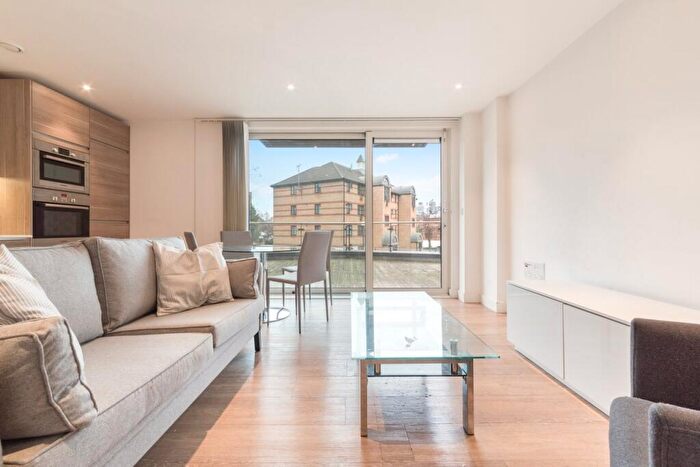
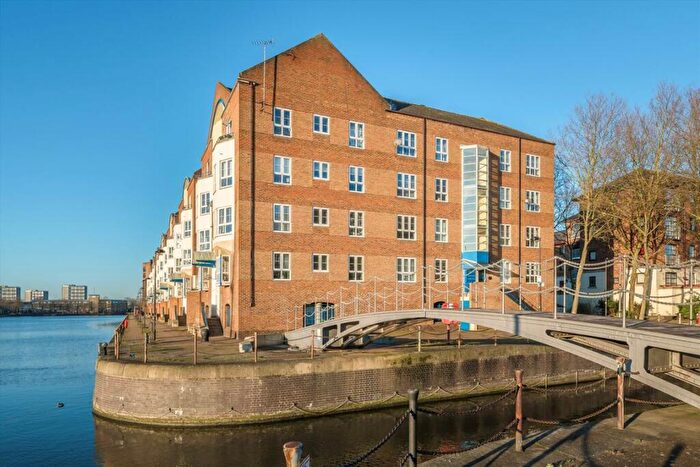
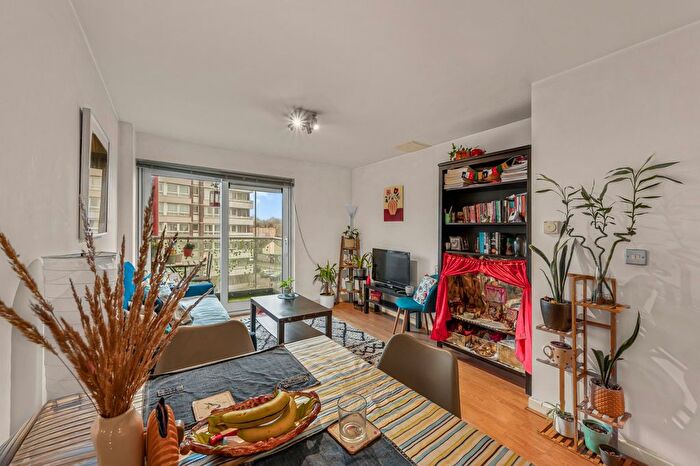
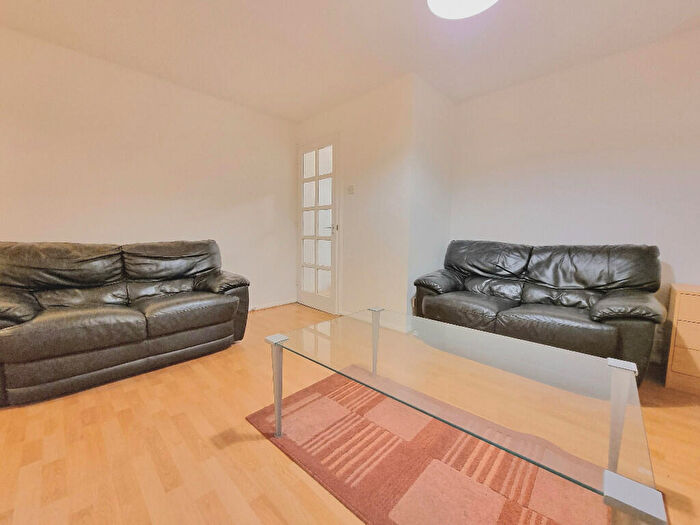
Properties for sale in Surrey Docks
Roads and Postcodes in Surrey Docks
Navigate through our locations to find the location of your next house in Surrey Docks, London for sale or to rent.
Transport near Surrey Docks
-
New Cross Station
-
Canada Water Station
-
Rotherhithe Station
-
Surrey Quays Station
-
Wapping Station
-
Heron Quays Station
-
Limehouse Station
-
Westferry Station
-
Canary Wharf Station
-
South Quay Station
- FAQ
- Price Paid By Year
- Property Type Price
Frequently asked questions about Surrey Docks
What is the average price for a property for sale in Surrey Docks?
The average price for a property for sale in Surrey Docks is £533,719. This amount is 18% lower than the average price in London. There are 6,243 property listings for sale in Surrey Docks.
What streets have the most expensive properties for sale in Surrey Docks?
The streets with the most expensive properties for sale in Surrey Docks are Smith Close at an average of £1,000,000, Plover Way at an average of £836,000 and Staples Close at an average of £832,666.
What streets have the most affordable properties for sale in Surrey Docks?
The streets with the most affordable properties for sale in Surrey Docks are Russell Place at an average of £257,500, Croft Street at an average of £305,000 and Chilton Grove at an average of £310,000.
Which train stations are available in or near Surrey Docks?
Some of the train stations available in or near Surrey Docks are New Cross, Canada Water and Rotherhithe.
Which tube stations are available in or near Surrey Docks?
Some of the tube stations available in or near Surrey Docks are Canada Water and Canary Wharf.
Property Price Paid in Surrey Docks by Year
The average sold property price by year was:
| Year | Average Sold Price | Price Change |
Sold Properties
|
|---|---|---|---|
| 2025 | £511,923 | -6% |
126 Properties |
| 2024 | £544,496 | 2% |
216 Properties |
| 2023 | £535,865 | -2% |
195 Properties |
| 2022 | £546,062 | 4% |
187 Properties |
| 2021 | £526,864 | 4% |
249 Properties |
| 2020 | £503,842 | -9% |
151 Properties |
| 2019 | £546,981 | 3% |
184 Properties |
| 2018 | £531,627 | -7% |
281 Properties |
| 2017 | £570,127 | 9% |
237 Properties |
| 2016 | £517,668 | 15% |
306 Properties |
| 2015 | £442,022 | 6% |
433 Properties |
| 2014 | £417,210 | 7% |
373 Properties |
| 2013 | £385,984 | 11% |
296 Properties |
| 2012 | £344,945 | 2% |
209 Properties |
| 2011 | £337,788 | 3% |
226 Properties |
| 2010 | £328,416 | 6% |
189 Properties |
| 2009 | £308,169 | -2% |
149 Properties |
| 2008 | £313,675 | -4% |
142 Properties |
| 2007 | £327,226 | 19% |
412 Properties |
| 2006 | £264,494 | 3% |
419 Properties |
| 2005 | £257,657 | 3% |
355 Properties |
| 2004 | £248,656 | 10% |
418 Properties |
| 2003 | £224,255 | -1% |
440 Properties |
| 2002 | £226,120 | 9% |
579 Properties |
| 2001 | £205,536 | 12% |
625 Properties |
| 2000 | £181,822 | 17% |
582 Properties |
| 1999 | £151,112 | 13% |
718 Properties |
| 1998 | £132,172 | 13% |
584 Properties |
| 1997 | £114,743 | 16% |
631 Properties |
| 1996 | £95,886 | -6% |
487 Properties |
| 1995 | £101,727 | - |
378 Properties |
Property Price per Property Type in Surrey Docks
Here you can find historic sold price data in order to help with your property search.
The average Property Paid Price for specific property types in the last three years are:
| Property Type | Average Sold Price | Sold Properties |
|---|---|---|
| Flat | £482,442.00 | 415 Flats |
| Semi Detached House | £745,888.00 | 18 Semi Detached Houses |
| Terraced House | £701,253.00 | 102 Terraced Houses |
| Detached House | £720,000.00 | 2 Detached Houses |


