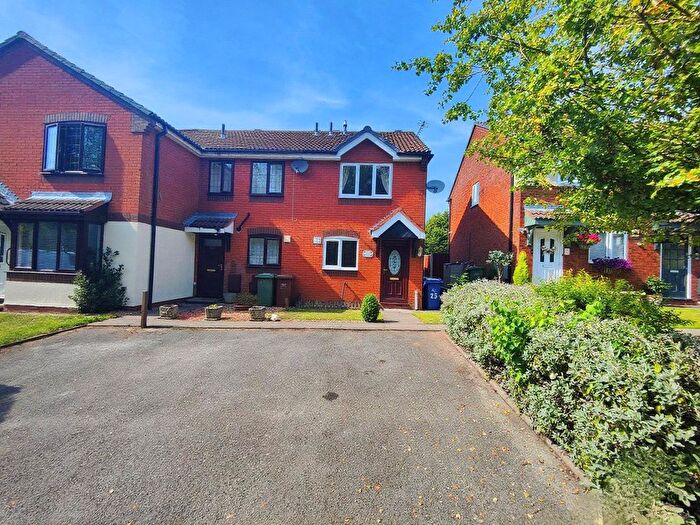
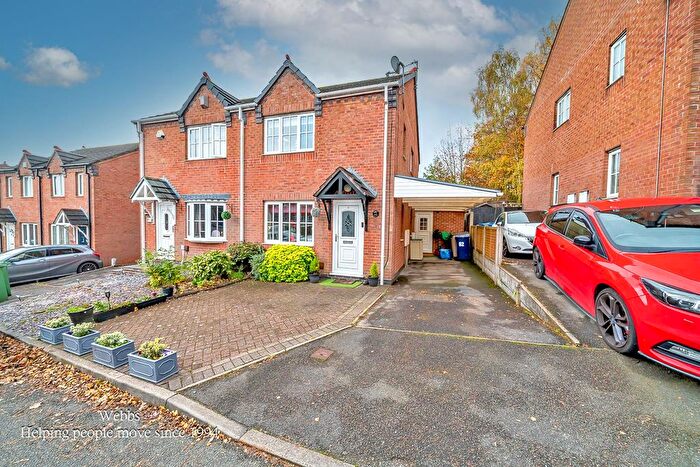
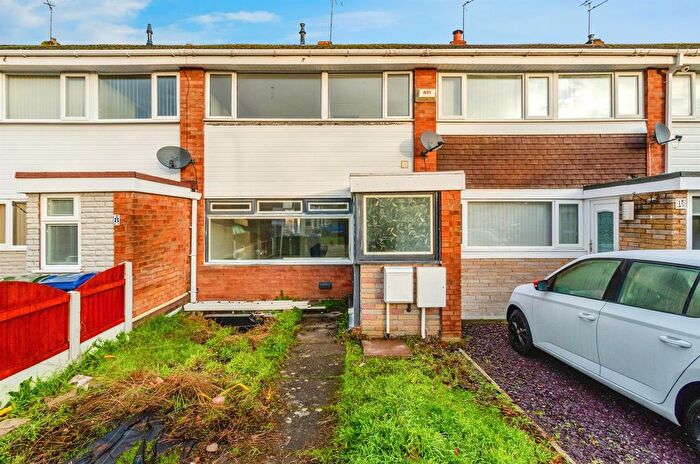
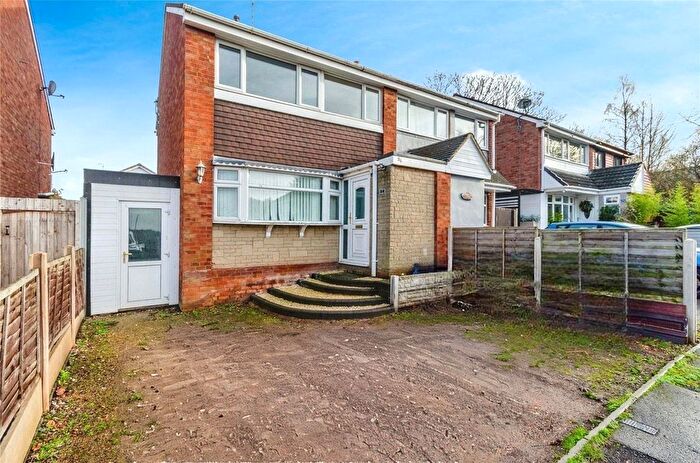
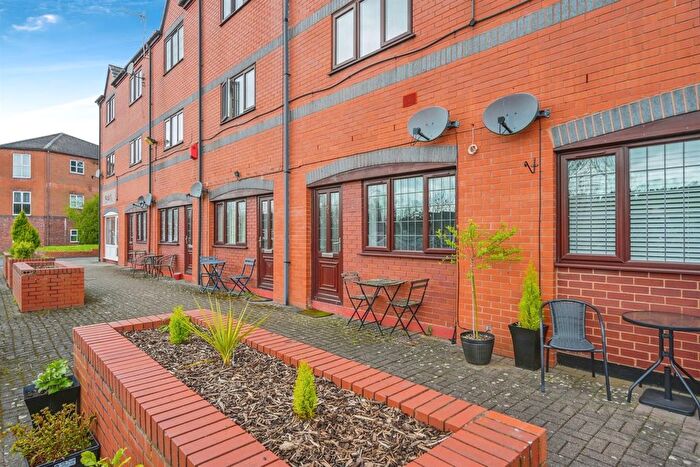
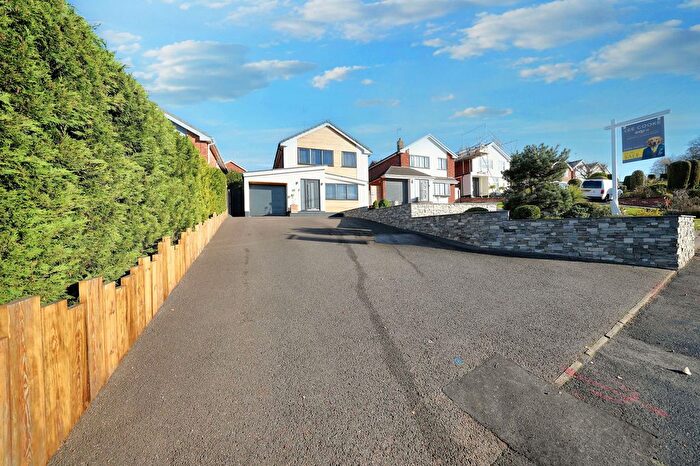
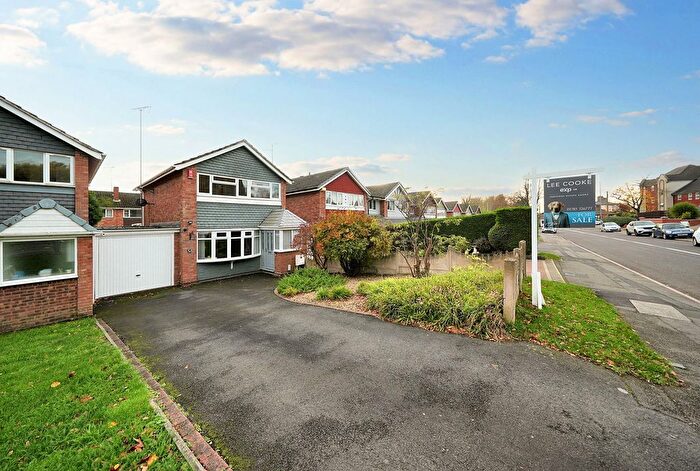
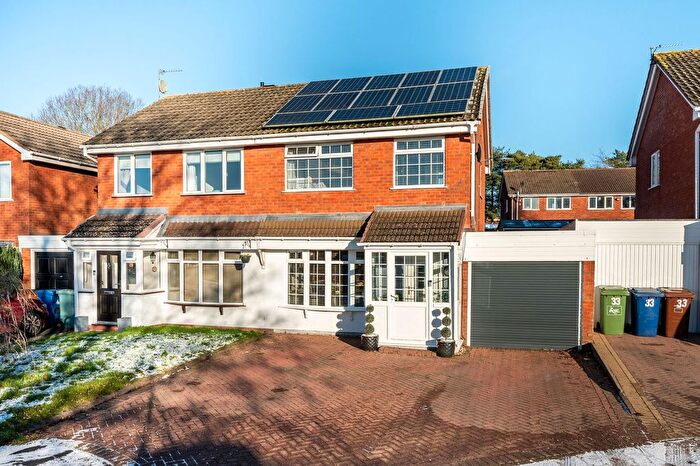
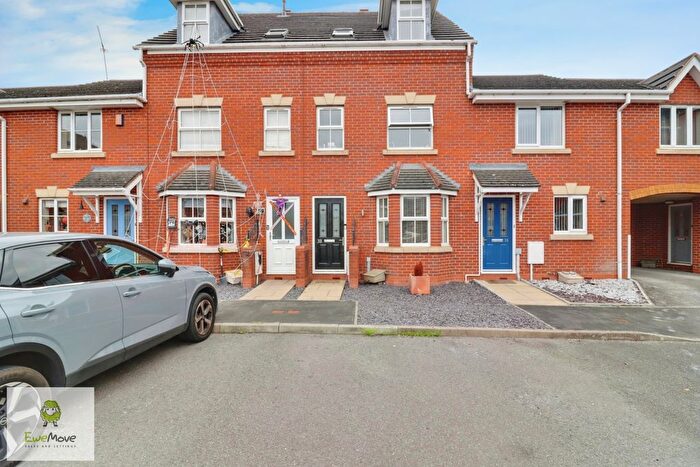
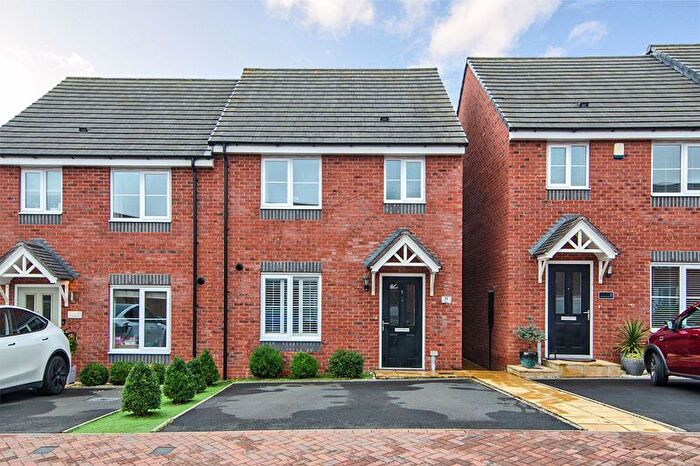
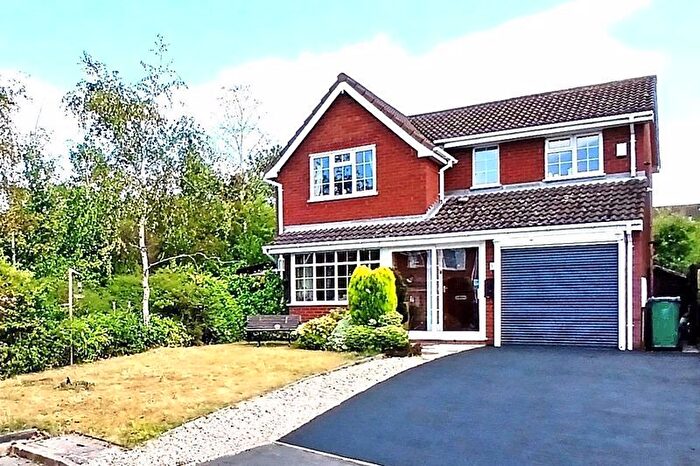
Houses for sale & to rent in Hednesford South, Cannock
House Prices in Hednesford South
Properties in Hednesford South have an average house price of £243,429.00 and had 215 Property Transactions within the last 3 years¹.
Hednesford South is an area in Cannock, Staffordshire with 2,242 households², where the most expensive property was sold for £480,000.00.
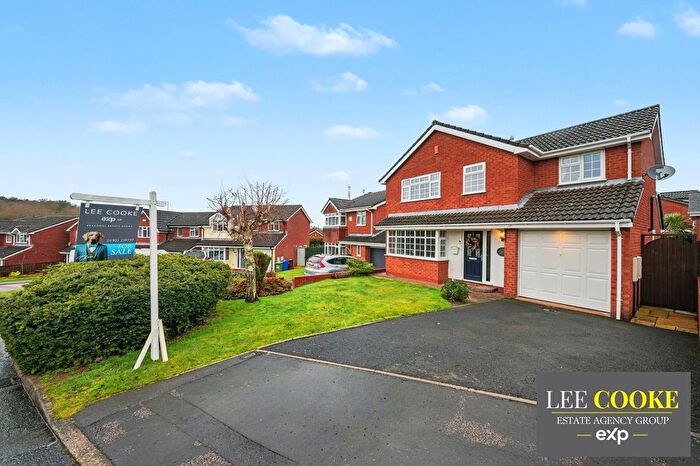
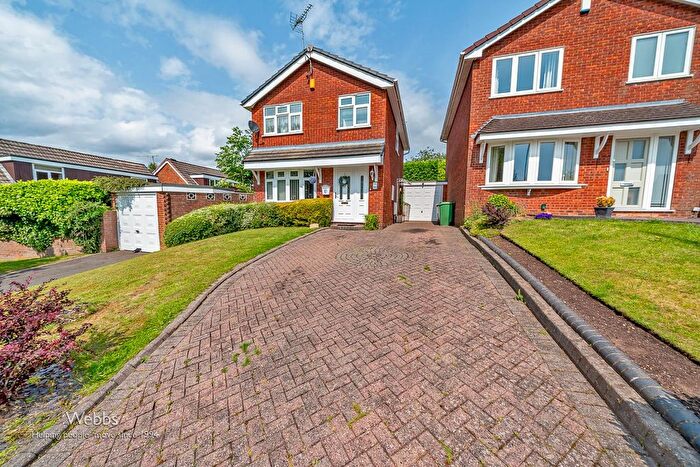
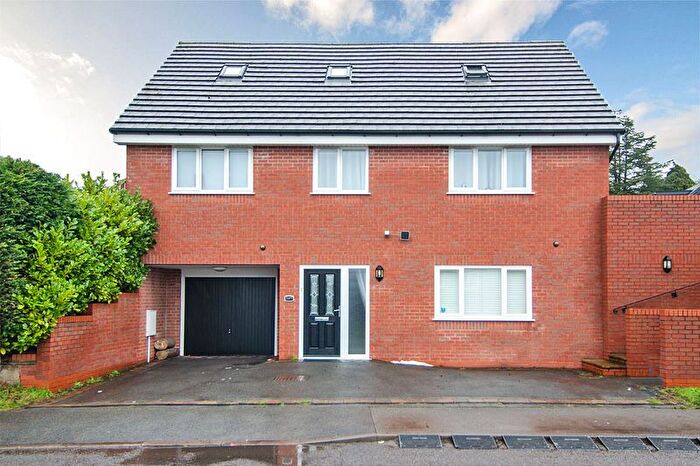
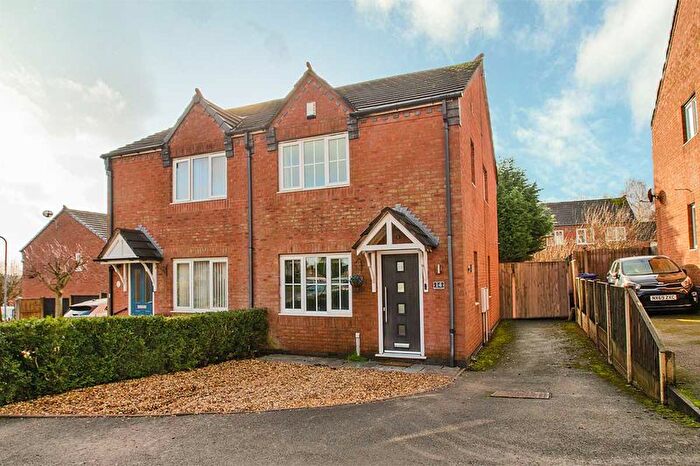
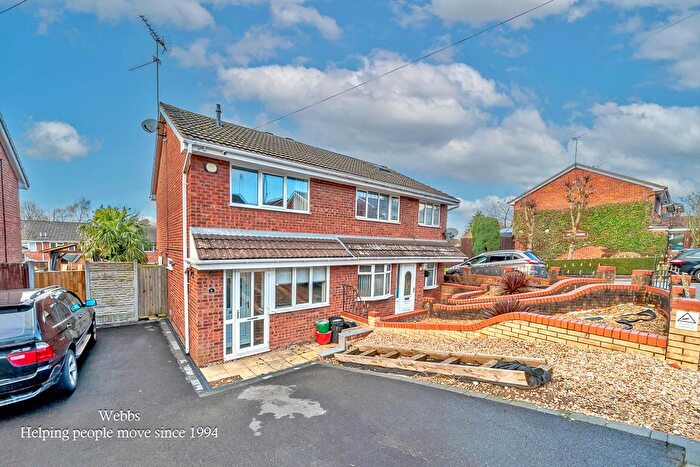
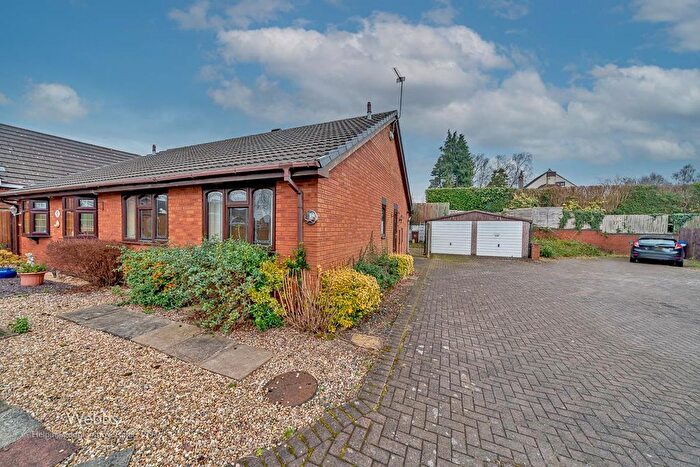
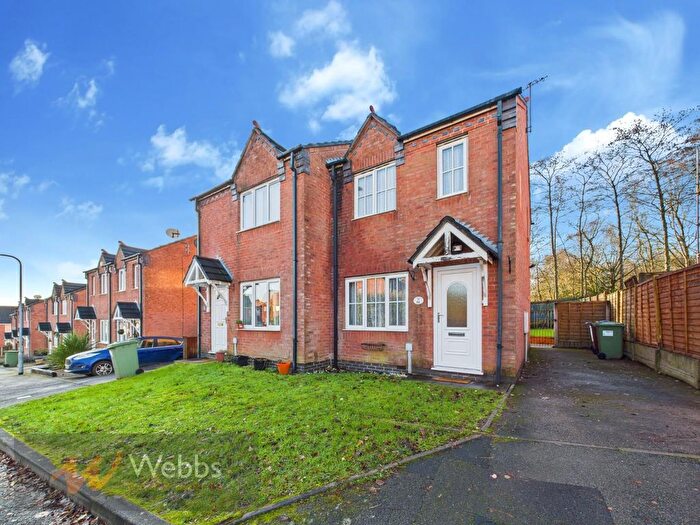
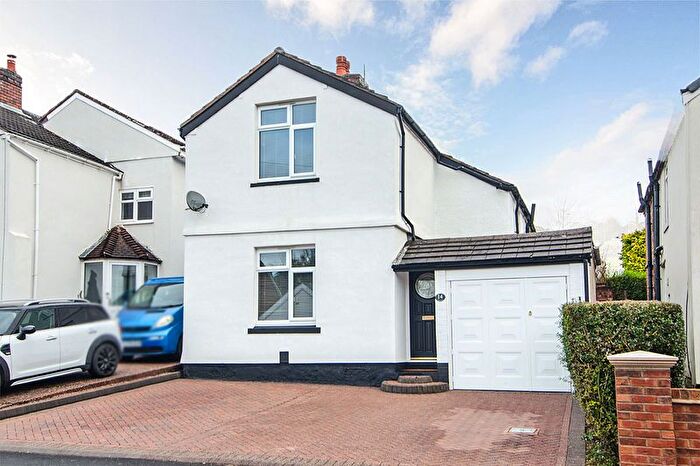
Properties for sale in Hednesford South
Previously listed properties in Hednesford South
Roads and Postcodes in Hednesford South
Navigate through our locations to find the location of your next house in Hednesford South, Cannock for sale or to rent.
| Streets | Postcodes |
|---|---|
| Albert Street | WS12 1BB |
| Alpine Drive | WS12 2NL |
| Anglesey Street | WS12 1AA |
| Bedford Place | WS12 1LJ |
| Berry Hill | WS12 1UJ |
| Carmel Close | WS12 1BP |
| Chaffinch Close | WS12 1UH |
| Charlemonte Close | WS12 2NH |
| Charnwood Close | WS12 2NG |
| Chaseside Drive | WS11 7EZ WS11 7EY WS11 7GD |
| Cheviot Rise | WS12 1AX |
| Church Hill | WS12 1BA WS12 1BD WS12 1BQ |
| Church Hill Mews | WS12 1DP |
| Copperkins Road | WS12 2NW |
| Cornwall Road | WS12 1AW WS12 1DS |
| Cottage Close | WS12 1BS |
| Croxley Drive | WS12 2GU |
| Dew Close | WS12 2ED |
| Dove Hollow | WS12 1NY |
| East Cannock Road | WS12 1LZ WS12 1NA WS12 1LS WS12 1LU |
| Eskrett Street | WS12 1AP |
| Essex Drive | WS12 1LG |
| Farm Close | WS12 2BX |
| Farm Court | WS12 2DQ |
| Forge Street | WS12 1DD WS12 1DG |
| Foxtail Way | WS12 2FY |
| George Street | WS12 1BJ |
| Griffiths Way | WS12 2EX |
| Hayes Way | WS12 2YT |
| Hereford Road | WS12 1LH |
| Herondale | WS12 1UF |
| Hewston Croft | WS12 1PB |
| Hill Street | WS12 1DJ WS12 2DN WS12 2DP WS12 2DR WS12 2DW |
| Hill Top | WS12 1DE |
| Hyssop Close | WS11 7FA WS11 7XA |
| Image Business Park | WS12 1LT |
| Key Point | WS12 2FN |
| Keys Close | WS12 2GX |
| Keys Park Road | WS12 2DZ WS12 2FR WS12 2FZ WS12 2HA |
| Kingfisher Drive | WS12 1LN |
| Kings Avenue | WS12 1DH WS12 1DQ |
| Laurel Drive | WS12 2LP |
| Leafdown Close | WS12 2NJ |
| Levetts Hollow | WS12 2AW |
| Linden View | WS12 1UA |
| Littleworth Hill | WS12 1NS |
| Littleworth Road | WS12 1NN WS12 1NP WS12 1NT WS12 1PA WS12 1NR |
| Lower Keys Business Park | WS12 2FS |
| Lower Road | WS12 1NB WS12 1ND |
| Meadow Lark Close | WS12 1UE |
| Meadowsweet Way | WS12 2GS |
| Meadway Close | WS12 2PD |
| New Street | WS12 1BH |
| O'connor Avenue | WS12 2EU |
| Oakland Industrial Estate | WS12 2UZ |
| Old Bakery Court | WS12 1DZ |
| Pendle Hill | WS12 1LW |
| Pitmen Way | WS12 2EA |
| Priory Road | WS12 2NU WS12 2NX |
| Radnor Rise | WS12 1LQ |
| Raven Close | WS12 2LS |
| Reservoir Road | WS12 1BE WS12 1BF |
| Ridings Park | WS11 7FD |
| Rugeley Road | WS12 1BY |
| Sharon Way | WS12 2NF WS12 2NN WS12 2NP WS12 2NQ |
| Sherbourne Avenue | WS12 2LR |
| Simcox Street | WS12 1BG |
| Splash Lane | WS12 2NE |
| St Peters Road | WS12 1BL |
| St Stephens Court | WS12 1GH |
| Stafford Lane | WS12 1LF WS12 1LL |
| Stagborough Way | WS12 1UB WS12 1UD |
| Sunny View | WS12 1EA |
| Sussex Drive | WS12 1AT WS12 1DT |
| Swallowfields Drive | WS12 1UG WS12 1UQ |
| Sweetbriar Way | WS12 2UL WS12 2US |
| Turquoise Grove | WS11 7FZ |
| Upper Keys Business Park | WS12 2GE |
| Uxbridge Street | WS12 1DB |
| Waterlily Close | WS12 2GN |
| Watermint Close | WS12 2GL |
| Willows Croft | WS12 1DR |
| Wood Lane | WS12 1BN WS12 1BW |
Transport near Hednesford South
- FAQ
- Price Paid By Year
- Property Type Price
Frequently asked questions about Hednesford South
What is the average price for a property for sale in Hednesford South?
The average price for a property for sale in Hednesford South is £243,429. This amount is 5% higher than the average price in Cannock. There are 447 property listings for sale in Hednesford South.
What streets have the most expensive properties for sale in Hednesford South?
The streets with the most expensive properties for sale in Hednesford South are Cheviot Rise at an average of £445,000, Sweetbriar Way at an average of £405,320 and Littleworth Hill at an average of £399,999.
What streets have the most affordable properties for sale in Hednesford South?
The streets with the most affordable properties for sale in Hednesford South are Herondale at an average of £120,250, Church Hill at an average of £144,285 and Uxbridge Street at an average of £167,333.
Which train stations are available in or near Hednesford South?
Some of the train stations available in or near Hednesford South are Hednesford, Cannock and Landywood.
Property Price Paid in Hednesford South by Year
The average sold property price by year was:
| Year | Average Sold Price | Price Change |
Sold Properties
|
|---|---|---|---|
| 2025 | £258,425 | 5% |
61 Properties |
| 2024 | £244,470 | 6% |
82 Properties |
| 2023 | £229,537 | -4% |
72 Properties |
| 2022 | £239,749 | 5% |
77 Properties |
| 2021 | £227,152 | 2% |
132 Properties |
| 2020 | £222,123 | 10% |
99 Properties |
| 2019 | £200,302 | 3% |
134 Properties |
| 2018 | £193,668 | 9% |
97 Properties |
| 2017 | £177,117 | 2% |
106 Properties |
| 2016 | £172,702 | 6% |
90 Properties |
| 2015 | £161,630 | -0,4% |
97 Properties |
| 2014 | £162,279 | 2% |
77 Properties |
| 2013 | £158,275 | 3% |
72 Properties |
| 2012 | £153,895 | 0,3% |
60 Properties |
| 2011 | £153,431 | 6% |
41 Properties |
| 2010 | £143,556 | -6% |
45 Properties |
| 2009 | £151,455 | -6% |
48 Properties |
| 2008 | £161,075 | 2% |
52 Properties |
| 2007 | £158,113 | 2% |
100 Properties |
| 2006 | £154,809 | 10% |
99 Properties |
| 2005 | £139,870 | 6% |
96 Properties |
| 2004 | £132,013 | 14% |
110 Properties |
| 2003 | £113,923 | 11% |
113 Properties |
| 2002 | £101,641 | 14% |
142 Properties |
| 2001 | £87,254 | 4% |
186 Properties |
| 2000 | £84,018 | 15% |
211 Properties |
| 1999 | £71,598 | 12% |
148 Properties |
| 1998 | £63,261 | 13% |
143 Properties |
| 1997 | £55,229 | 13% |
84 Properties |
| 1996 | £48,183 | 4% |
80 Properties |
| 1995 | £46,089 | - |
79 Properties |
Property Price per Property Type in Hednesford South
Here you can find historic sold price data in order to help with your property search.
The average Property Paid Price for specific property types in the last three years are:
| Property Type | Average Sold Price | Sold Properties |
|---|---|---|
| Semi Detached House | £216,478.00 | 111 Semi Detached Houses |
| Detached House | £330,120.00 | 66 Detached Houses |
| Terraced House | £188,500.00 | 30 Terraced Houses |
| Flat | £108,156.00 | 8 Flats |

