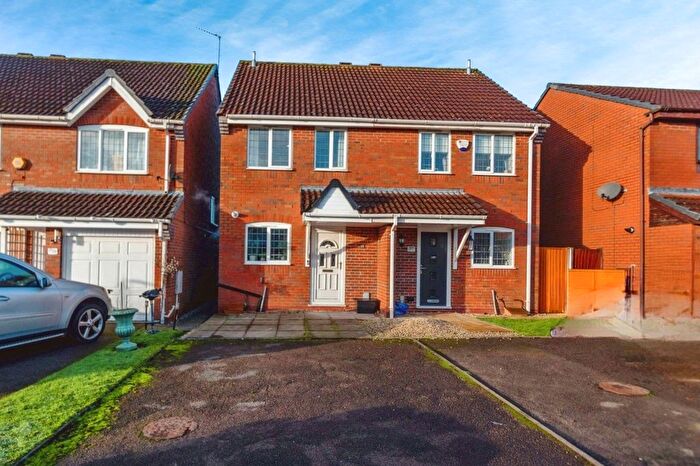
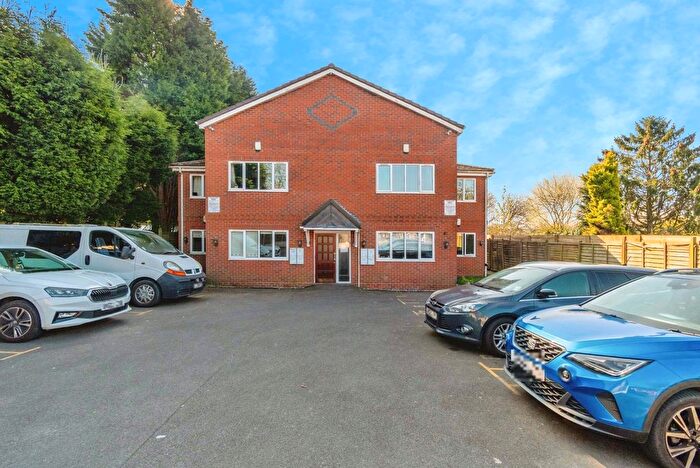
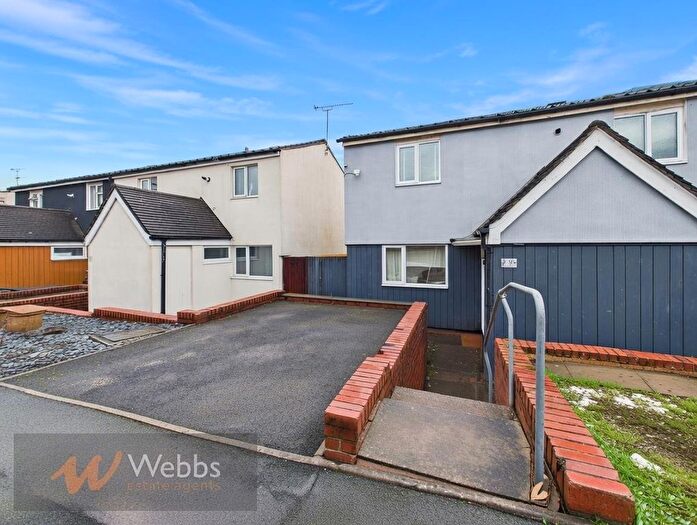
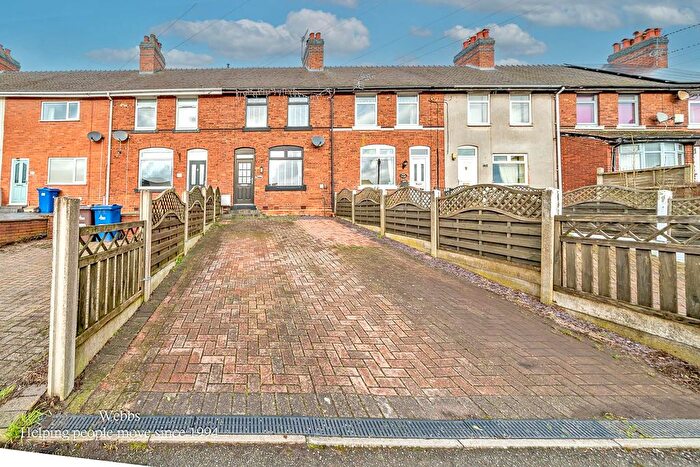
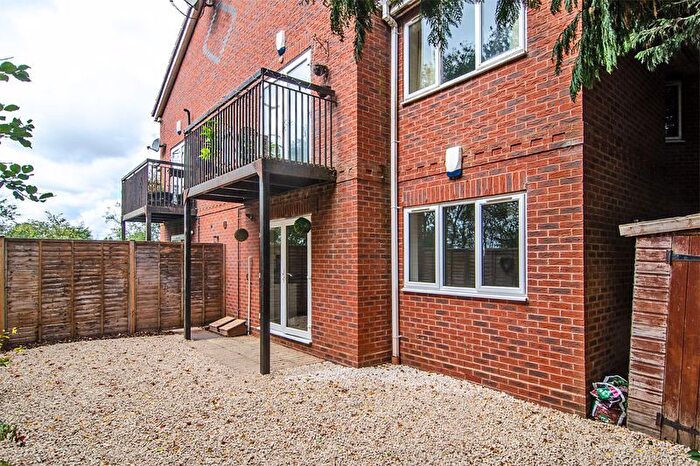
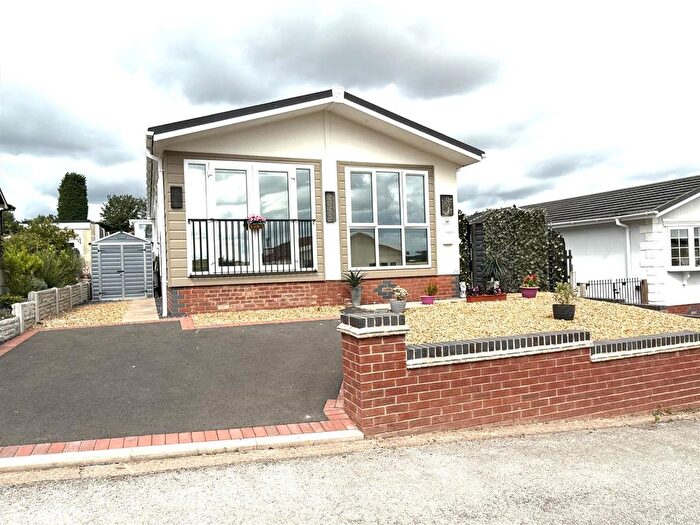
Houses for sale & to rent in Rawnsley, Cannock
House Prices in Rawnsley
Properties in Rawnsley have an average house price of £216,907.00 and had 145 Property Transactions within the last 3 years¹.
Rawnsley is an area in Cannock, Staffordshire with 1,546 households², where the most expensive property was sold for £1,000,000.00.
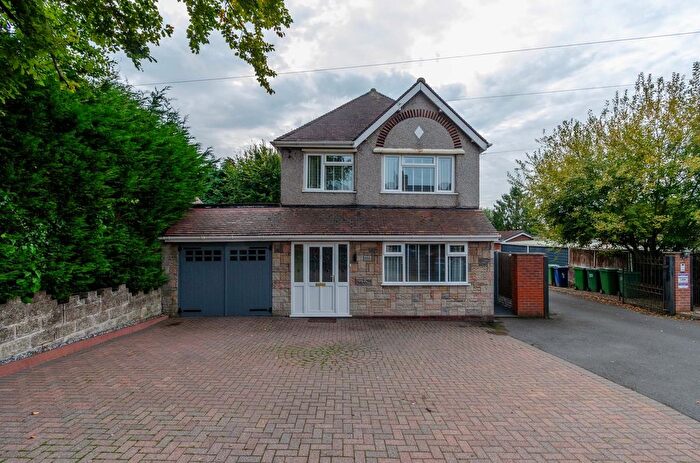
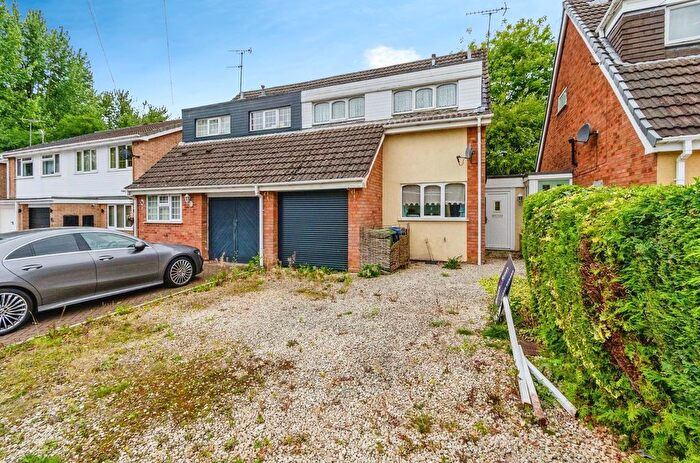
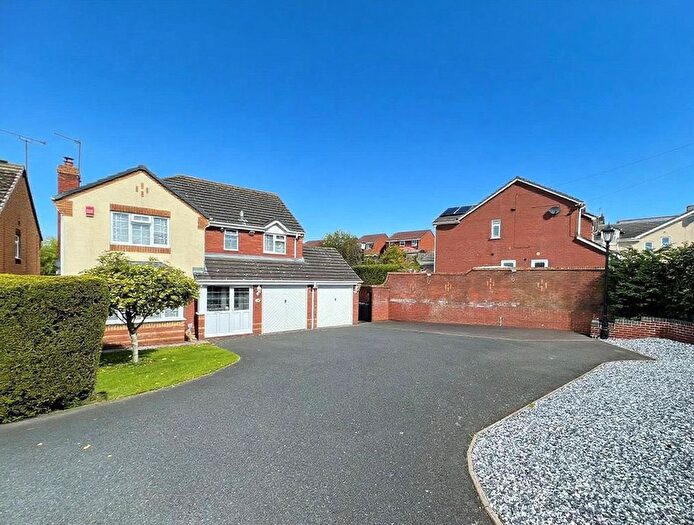
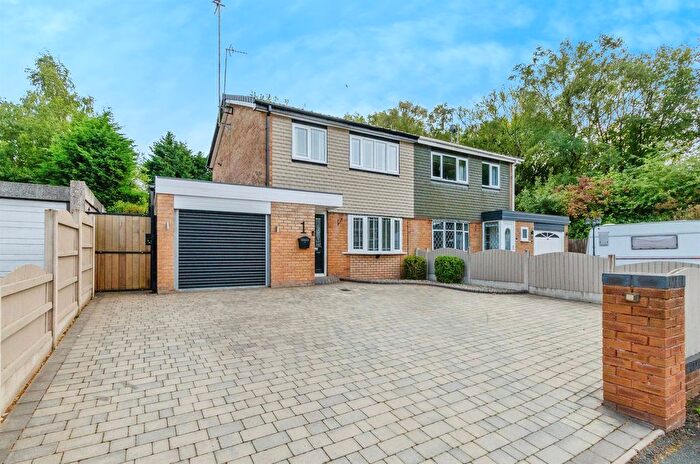
Properties for sale in Rawnsley
Previously listed properties in Rawnsley
Roads and Postcodes in Rawnsley
Navigate through our locations to find the location of your next house in Rawnsley, Cannock for sale or to rent.
| Streets | Postcodes |
|---|---|
| Aintree Close | WS12 0JH |
| Albert Davie Drive | WS12 2GG |
| Alder Way | WS12 0SX |
| Aspen Court | WS12 0ST |
| Barnfield Way | WS12 0PR |
| Beaudesert View | WS12 1LA |
| Bentley Brook Lane | WS12 0PT |
| Blackthorn Crescent | WS12 0SW |
| Briars Way | WS12 0PX |
| Bryans Way | WS12 0HX |
| Cannock Wood Industrial Estate | WS12 0PL WS12 0AD |
| Cannock Wood Road | WS12 0PZ |
| Cannock Wood Street | WS12 0PN WS12 0PW |
| Chetwynd Park | WS12 0NZ |
| Coopers Coppice | WS12 0PY |
| Cypress Rise | WS12 0SP |
| Danby Drive | WS12 0PF |
| Deer Park | WS12 0PD |
| Deerhurst Rise | WS12 0JJ |
| Eastgate | WS12 0RZ |
| Glovers Close | WS12 0JX |
| Goodwood Close | WS12 0JU |
| Hamilton Close | WS12 2GD |
| Hazel Brooke Court | WS12 0QH |
| Hazel Drive | WS12 0SS |
| Hornbeam Crescent | WS12 0SU |
| Ironstone Road | WS12 0QB WS12 0QD |
| Jenkinstown Road | WS12 0PS |
| Jesmond Close | WS12 0JR |
| Juniper Close | WS12 0SR |
| Kempton Close | WS12 0JT |
| Littleworth Road | WS12 1HY WS12 1HZ WS12 1JA WS12 1JB WS12 1JD WS12 1JE WS12 1QQ |
| Longacres | WS12 1HT WS12 1LD |
| Longstaff Avenue | WS12 0QE |
| Middleway | WS12 0JN |
| Nelson Drive | WS12 2GF WS12 2GH |
| New Hayes Court | WS12 0RA |
| New Hayes Park | WS12 0QJ |
| Old Park Road | WS12 0PU |
| Pagets Chase | WS12 0RG |
| Rawnsley Road | WS12 1JF WS12 1JG WS12 1JQ WS12 1RD |
| Ridgwood Drive | WS12 1DY |
| Rugeley Road | WS12 0PG WS12 0PH WS12 0PQ |
| Rushton Mews | WS12 0QN |
| Sandown Close | WS12 0JS |
| Saunders Close | WS12 0JL |
| Sevens Road | WS12 0QA |
| Slade View Rise | WS12 0JW |
| St Andrew Close | WS12 0FA |
| St Bernards Close | WS12 0PE |
| St Christopher Close | WS12 0FH |
| St David Close | WS12 0FE |
| St Francis Close | WS12 0FJ |
| St George Drive | WS12 0FB |
| St Matthew Close | WS12 0FL |
| St Michaels Drive | WS12 1LB |
| St Patrick Close | WS12 0FD |
| St Thomas Drive | WS12 0FG |
| Summerside Avenue | WS12 0QG |
| Trafalgar Close | WS12 2GA |
| Valley Road | WS12 0PP |
| Victory Close | WS12 2GB |
| Warren Close | WS12 0JY |
| Westgate | WS12 0JZ |
| Williamson Avenue | WS12 0QF |
| Wimblebury Road | WS12 2HU WS12 2HW |
Transport near Rawnsley
-
Hednesford Station
-
Cannock Station
-
Rugeley Town Station
-
Landywood Station
-
Rugeley Trent Valley Station
- FAQ
- Price Paid By Year
- Property Type Price
Frequently asked questions about Rawnsley
What is the average price for a property for sale in Rawnsley?
The average price for a property for sale in Rawnsley is £216,907. This amount is 7% lower than the average price in Cannock. There are 142 property listings for sale in Rawnsley.
What streets have the most expensive properties for sale in Rawnsley?
The streets with the most expensive properties for sale in Rawnsley are Rugeley Road at an average of £416,750, Hazel Brooke Court at an average of £390,000 and St Thomas Drive at an average of £377,000.
What streets have the most affordable properties for sale in Rawnsley?
The streets with the most affordable properties for sale in Rawnsley are Hamilton Close at an average of £66,190, Saunders Close at an average of £79,000 and Slade View Rise at an average of £130,000.
Which train stations are available in or near Rawnsley?
Some of the train stations available in or near Rawnsley are Hednesford, Cannock and Rugeley Town.
Property Price Paid in Rawnsley by Year
The average sold property price by year was:
| Year | Average Sold Price | Price Change |
Sold Properties
|
|---|---|---|---|
| 2025 | £214,384 | -1% |
46 Properties |
| 2024 | £216,761 | -1% |
51 Properties |
| 2023 | £219,479 | 5% |
48 Properties |
| 2022 | £209,318 | -1% |
56 Properties |
| 2021 | £210,667 | 5% |
64 Properties |
| 2020 | £199,672 | 1% |
40 Properties |
| 2019 | £196,874 | 12% |
75 Properties |
| 2018 | £172,916 | 3% |
47 Properties |
| 2017 | £168,477 | 5% |
70 Properties |
| 2016 | £160,394 | 2% |
70 Properties |
| 2015 | £157,074 | 5% |
58 Properties |
| 2014 | £149,851 | 6% |
61 Properties |
| 2013 | £140,371 | 3% |
47 Properties |
| 2012 | £136,107 | 7% |
28 Properties |
| 2011 | £126,166 | 7% |
24 Properties |
| 2010 | £117,218 | -15% |
24 Properties |
| 2009 | £135,370 | 5% |
35 Properties |
| 2008 | £128,083 | -22% |
34 Properties |
| 2007 | £155,665 | 16% |
90 Properties |
| 2006 | £131,069 | 5% |
78 Properties |
| 2005 | £124,100 | 11% |
73 Properties |
| 2004 | £110,942 | 9% |
92 Properties |
| 2003 | £100,542 | 21% |
92 Properties |
| 2002 | £79,596 | 10% |
82 Properties |
| 2001 | £71,386 | 14% |
95 Properties |
| 2000 | £61,731 | 1% |
105 Properties |
| 1999 | £61,033 | 5% |
93 Properties |
| 1998 | £58,260 | 16% |
93 Properties |
| 1997 | £49,028 | 0,4% |
75 Properties |
| 1996 | £48,855 | 1% |
68 Properties |
| 1995 | £48,542 | - |
79 Properties |
Property Price per Property Type in Rawnsley
Here you can find historic sold price data in order to help with your property search.
The average Property Paid Price for specific property types in the last three years are:
| Property Type | Average Sold Price | Sold Properties |
|---|---|---|
| Semi Detached House | £233,742.00 | 56 Semi Detached Houses |
| Detached House | £332,126.00 | 32 Detached Houses |
| Terraced House | £153,360.00 | 40 Terraced Houses |
| Flat | £94,088.00 | 17 Flats |

