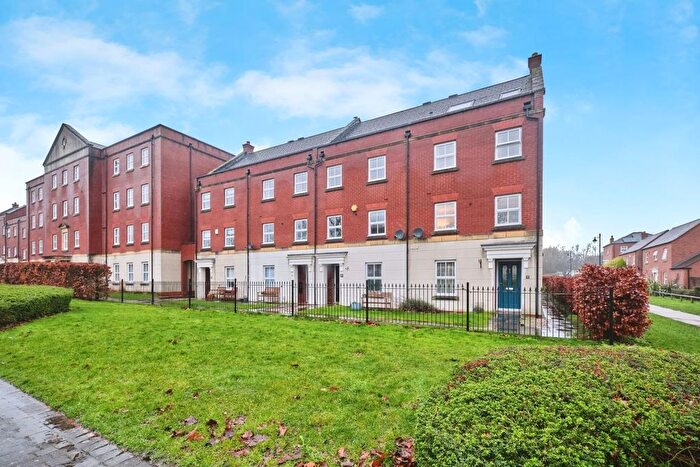
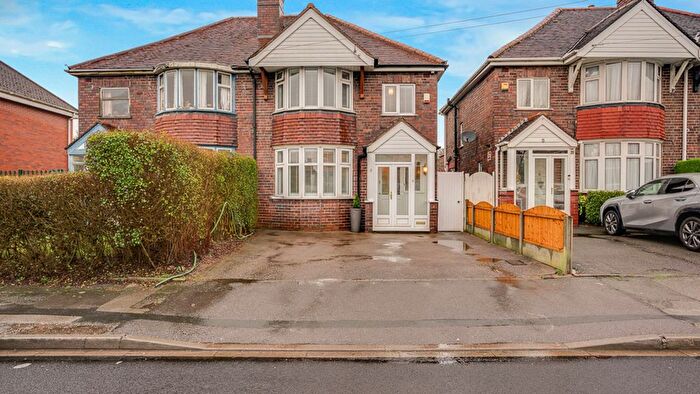
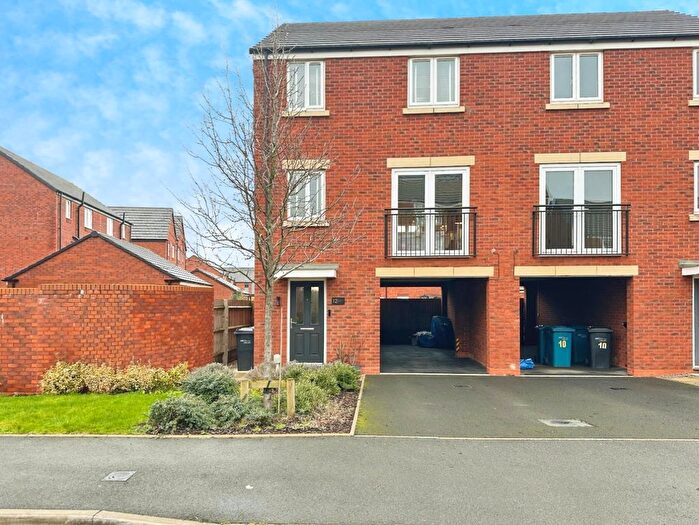
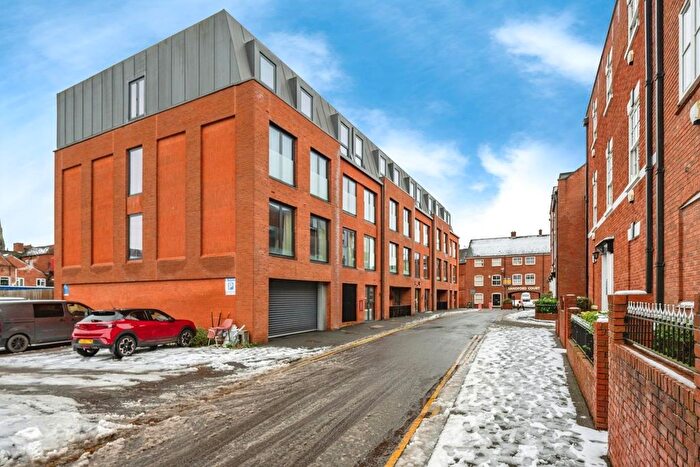
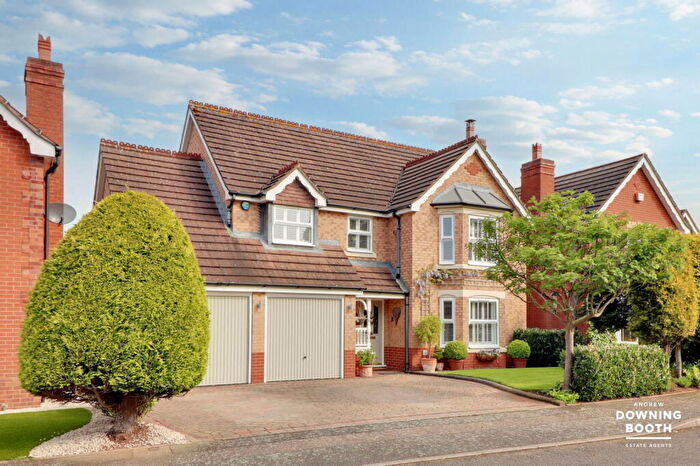
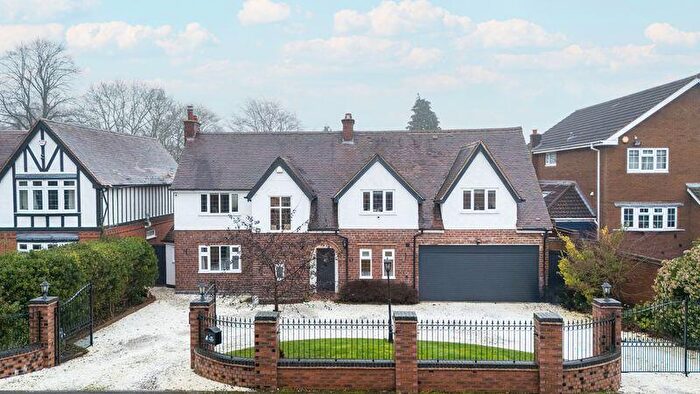
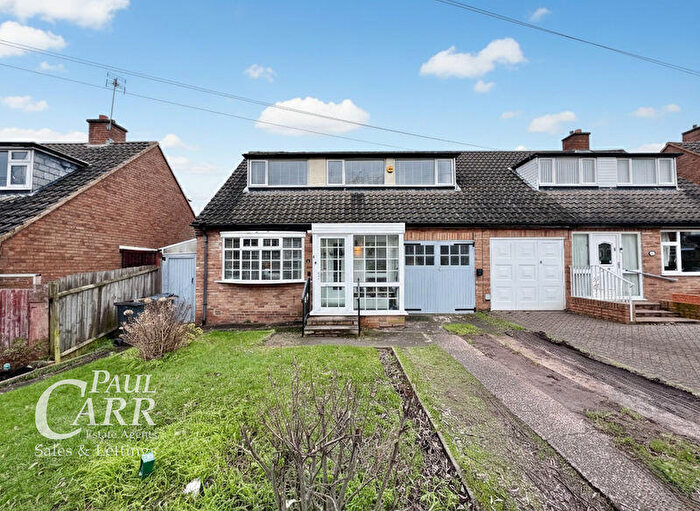
Houses for sale & to rent in Bourne Vale, Lichfield
House Prices in Bourne Vale
Properties in Bourne Vale have an average house price of £368,500.00 and had 8 Property Transactions within the last 3 years¹.
Bourne Vale is an area in Lichfield, Staffordshire with 217 households², where the most expensive property was sold for £870,000.00.
Properties for sale in Bourne Vale
Roads and Postcodes in Bourne Vale
Navigate through our locations to find the location of your next house in Bourne Vale, Lichfield for sale or to rent.
| Streets | Postcodes |
|---|---|
| Barkers Lane | WS14 9QN |
| Birmingham Road | WS14 0LF WS14 0LG |
| Broom Covert Road | WS14 9QU |
| Camp Road | WS14 0QF |
| Church Hill | WS14 0PP WS14 0PW |
| Common Lane | WS14 9TW |
| Derry Court | WS14 0AF |
| Express Way | WS14 0PQ |
| Flats Lane | WS14 9QG WS14 9QQ |
| Green Barns Lane | WS14 0QN |
| Hungry Lane | WS14 0PR |
| Jerrys Lane | WS14 9QA WS14 9QD WS14 9QB |
| Knoxs Grave Lane | WS14 9QE |
| Levett Road | WS14 9PZ |
| Little Hay Lane | WS14 0PU WS14 0PY WS14 0QE |
| London Road | WS14 0PS WS14 0PT WS14 9QR WS14 9QY WS14 9QL WS14 9QX |
| Old London Road | WS14 9QP WS14 9QW |
| Sawpits Lane | WS14 0PX |
| Tamworth Road | WS14 9PU WS14 9PN WS14 9PS WS14 9PT WS14 9PX WS14 9TN |
| The Drive | WS14 9QT |
| Watling Street | WS14 0PJ WS14 0PL WS14 0PN |
| Weeford Square | WS14 0PH |
| WS14 9QS WS14 9RE WS14 9HJ |
Transport near Bourne Vale
-
Shenstone Station
-
Lichfield City Station
-
Blake Street Station
-
Lichfield Trent Valley Station
-
Butlers Lane Station
-
Four Oaks Station
-
Tamworth Low Level Station
- FAQ
- Price Paid By Year
- Property Type Price
Frequently asked questions about Bourne Vale
What is the average price for a property for sale in Bourne Vale?
The average price for a property for sale in Bourne Vale is £368,500. This amount is 2% higher than the average price in Lichfield. There are 2,739 property listings for sale in Bourne Vale.
What streets have the most expensive properties for sale in Bourne Vale?
The streets with the most expensive properties for sale in Bourne Vale are Tamworth Road at an average of £345,000 and Levett Road at an average of £223,000.
What streets have the most affordable properties for sale in Bourne Vale?
The street with the most affordable properties for sale in Bourne Vale is The Drive at an average of £220,000.
Which train stations are available in or near Bourne Vale?
Some of the train stations available in or near Bourne Vale are Shenstone, Lichfield City and Blake Street.
Property Price Paid in Bourne Vale by Year
The average sold property price by year was:
| Year | Average Sold Price | Price Change |
Sold Properties
|
|---|---|---|---|
| 2025 | £219,000 | -39% |
2 Properties |
| 2024 | £305,000 | -74% |
3 Properties |
| 2023 | £531,666 | 52% |
3 Properties |
| 2022 | £254,166 | -8% |
6 Properties |
| 2021 | £274,000 | -105% |
7 Properties |
| 2020 | £560,833 | 0,1% |
3 Properties |
| 2019 | £560,125 | 5% |
12 Properties |
| 2018 | £533,642 | -5% |
8 Properties |
| 2017 | £562,500 | 58% |
4 Properties |
| 2016 | £236,888 | -44% |
9 Properties |
| 2015 | £341,083 | -16% |
6 Properties |
| 2014 | £397,071 | 38% |
7 Properties |
| 2013 | £245,000 | -5% |
2 Properties |
| 2012 | £257,433 | 13% |
6 Properties |
| 2011 | £223,333 | -3% |
3 Properties |
| 2010 | £231,135 | -9% |
7 Properties |
| 2009 | £253,000 | 24% |
5 Properties |
| 2008 | £191,666 | -125% |
3 Properties |
| 2007 | £430,650 | 42% |
10 Properties |
| 2006 | £247,700 | -38% |
5 Properties |
| 2005 | £341,800 | 27% |
5 Properties |
| 2004 | £249,625 | 18% |
4 Properties |
| 2003 | £204,342 | -40% |
7 Properties |
| 2002 | £285,150 | 76% |
10 Properties |
| 2001 | £67,500 | -150% |
2 Properties |
| 2000 | £169,087 | -13% |
8 Properties |
| 1999 | £190,777 | 23% |
9 Properties |
| 1998 | £146,654 | 8% |
12 Properties |
| 1997 | £134,645 | 8% |
10 Properties |
| 1996 | £123,535 | 64% |
7 Properties |
| 1995 | £44,000 | - |
2 Properties |
Property Price per Property Type in Bourne Vale
Here you can find historic sold price data in order to help with your property search.
The average Property Paid Price for specific property types in the last three years are:
| Property Type | Average Sold Price | Sold Properties |
|---|---|---|
| Semi Detached House | £278,600.00 | 5 Semi Detached Houses |
| Terraced House | £215,000.00 | 1 Terraced House |
| Detached House | £670,000.00 | 2 Detached Houses |

